Abstract
By comparing conventional FXLMS (filtered-X least mean square) control algorithms, the present paper introduces an improved adaptive vibration control FXLMS algorithm based on reference signal self-extraction. It overcomes the problem of reference signal which correlated with external excitation signal is needed to be predicted in advance, namely, the reference signal is extracted from structural vibration in real time in the process of control algorithm. Its theoretical basis is: get an original vibration signal estimation using the error signal of the system and the estimation value is taken as the reference signal of adaptive filtering. In addition, to verify the feasibility and advantage of the proposed algorithm, we simulate solar panels with piezoelectric smart flexible plate and construct the corresponding experimental platform. Finally, the results presented in this paper demonstrate that the proposed algorithm is feasible, effective and achieve improvement with significantly faster convergence speed and better control effect compared with other algorithms.
1. Introduction
A growing interest in the area of smart flexible structures has been established in recent years and has found its applications in aerospace, intelligent robots, automotive, and space applications [1-3]. For the flexible structures and equipments of spacecraft system, its slight vibration is likely to cause instability of the entire system because of the particular operating environment of spacecraft systems, so how to effectively reduce or eliminate the structural vibration response has become a hot research [4].
In recent years, vibration reduction has gained momentum in the field of smart flexible structural vibration control. Many control algorithms have been used to perform the vibration reduction as discussed in [5-7]. However, these methods all need require an accurate model of the controlled object, but in some areas such as large flexible structures for spacecraft, it is impossible to establish its precise mathematical model due to the complexity of structural vibration mode and the existence of large deformation nonlinear effects. Therefore, there are some drawbacks in practical engineering applications. Many scholars have explored methods to do controller design using intelligent control methods and have achieved some significant results both in theory and in experiments [8-13], for example, Hacioglu [8] presented a new adaptive backstepping controller with estimation for uncertain systems. Kim [9] proposed a feedback loop with the model predictive sliding mode control in the adaptive filtering system. Rittenschober [10] was concerned with self-sensing actuation for the adaptive vibration control of smart structures with piezoelectric actuators. Erkaya [11] performed an investigation on the vibration analysis of a gearing mechanism using neural network predictors. Nasser [13] introduced a comprehensive methodology for the structural active vibration damping using a fuzzy logic control.
Adaptive filter control method has a high rate of control correction, adaptable and flexible in non-stationary random response and can quickly track the structural changes in parameters and external disturbance response, so it has received wide attention in the field of active vibration smart structures in recent years [14, 15]. Most of the adaptive filter control algorithm are based on least mean square (LMS) control algorithm [16-19], the main algorithms are filtered-X least mean square (FXLMS) based on finite impulse response (FIR) algorithm [16, 18] and filtered-U least mean square (FULMS ) on infinite impulse response (IIR) algorithm [17, 19]. However, they have a common drawback: they need to predict the reference signal associated with external excitation signal in the process of the algorithm, but in most practical engineering, it can not obtained the reference signal in advance, so the algorithm is hindered for the further application in the actual system.
FXLMS control algorithm avoids many problems associated with traditional ways of predicting external excitation signal in advance. The present paper directly extracts vibration response of the residual signal from the vibration structure, and then constructs a reference signal based on the controller structures to meet with the correlation of the excitation signal.
The organization of this paper is as follows: The standard FXLMS control algorithm and vibration control strategy is performed in Section 2. The derivation of improved filtered-X LMS control algorithm is described in Section 3. The construction of piezoelectric experimental models and vibration control experimental platform is introduced in Section 4. The digital simulation analysis and experimental results are reported in Section 5. Finally, the conclusion is presented in Section 6.
2. Standard filtered-X LMS algorithm
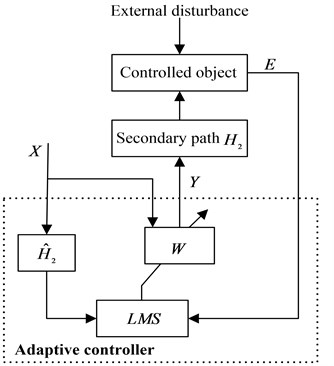
Adaptive filter structural vibration control method offsets the response of the controlled object caused by the external disturbance, its basic thought is shown in Fig. 1: according to the sensor signal , the controller outputs control signal to actuator, thus the control force is exerted to the controlled object and the structural vibration is canceled to eliminate or reduce the vibration response of the controlled object [20]. is the secondary path from actuator to error sensor, is the identified model of . In actual physical control structure, includes D/A, the power amplifier, the actuator, controlled system, the error sensor and A/D, etc. Due to , there are deviations in the estimation of the negative gradient of the performance function for the standard LMS algorithm, so the adjustment of the weight vector is away from the true adjustment direction and can not find a optimal value, leading to the instability of the control process. In order to eliminate the impact of , add into between the reference signal and LMS algorithm for updating the weights.
Fig. 1Schematic of adaptive filtered-X LMS algorithm
3. Improved filtered-X LMS algorithm
3.1. Strategy of reference signal self-extraction
In response to the problem of being difficult to predict the reference signal in advance and according to the features of adaptive filter vibration control method, the reference signal is got by the error signal directly extracted from the vibration response structure and combining the controller structures and algorithm process. Fig. 2 illustrates a strategy of reference signal self-extraction.
Fig. 2Schematic of improved filtered-X LMS algorithm
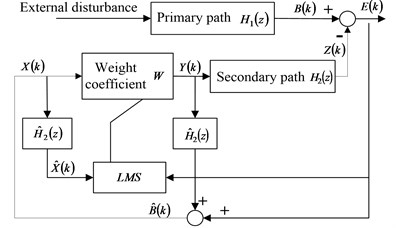
As shown above, is the input of the filter, is the filter output, is the structural vibration error signal detected by the sensor, is the vibration response without control at time , is an estimation of . Suppose that , can be estimated from by :
In Eqs. (1) and (2), suppose that , , is a good estimation of . If the primary path is linear, and the external signal is linearly associated with , then external signal is also linearly associated with . Thus, theoretically, can be used as the reference signal .
3.2. Analysis and reasoning process of improved algorithm
For convenient illustration, hybrid representation in [21] was adopted. and . If is a finite th order, then and . Let be the unit impulse response of , then .
is the output vector of the controlled object at time , is an estimation of by and , is obtained by through . is the th weighting coefficient of the feedforward filter at time , is the order of the feedforward filter. is the identified model of , according to the identification accuracy requirements, the order is described by human-defined identification model to be set th order. Also assume that there are sensors and controllers for MIMO control system, the reasoning process of the algorithm is as follows:
In Eq. (4), is the vector set of th controller output at time , is the vector set of the th controller output in time delaying for times:
here, , .
At the initial time, the moment before the control is on, is satisfied:
On the basis of the feature of FIR filter, the input and output relationship can be obtain:
Thus, the expansion of Eq. (15) is:
According to the structural model feature of , the following relationship can be obtain:
And according to , the following relationship can be obtain:
The cancelation residual in time is:
The estimating function of in time is:
Eq. (20) is expanded as:
Combining Eqs. (14) and (20):
The cancelation residual in time is:
Eq. (22) is expanded as:
Assume that 1, 2,…, , Eq. (23) can be expressed as:
If the change of the controller weights is very slow in a tiny time, then:
Eq. (24) can be transferred as:
Let , then:
According Eqs. (25) and (26), the following equations are obtained:
Considering 1, 2,…, , Eq. (27) can be expressed as the matrix form:
The MIMO adaptive control is to search the optimal by minimizing the error residual of the sensor signal through the controller output.
Thus, the performance evaluation function is:
And let .
The recursion formula can be obtained by steepest descent method:
The adaptive filter feed forward control algorithm for MIMO can be summarized as follows:
Seen from the above illustration, the values of the convergence step factor and the feature matrix first need to be determined to implement the control algorithm, depends on the eigenvalues of the autocorrelation matrix, it need have a faster convergence speed under the premise of ensuring the algorithm convergence, , here, is the largest eigenvalue; is obtained by off-line identification method. FIR filter is adopted as the structural identification model of each control channel in the paper, selecting th order filter.
4. Construction of experimental platform
The experimental platform is established by cantilever beam in structural model and simulates the solar panels by the epoxy board, both sides of the beam are attached by PZT sensors and actuators whose locations directly affect the control precision and continuous energy on the drive. Theoretically, structural modal vibration morphology and characteristics are analyzed, considering low-frequency vibration caused by low mode shapes in the paper. Therefore, only the first-order low-frequency modal need to be analyzed.
4.1. Modal analysis of smart flexible board
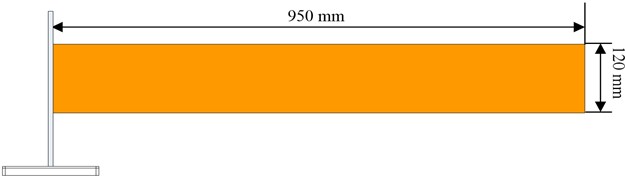
Considering that the epoxy board has good strength and flexibility, it maintains good planar structure in static and produces better curved surface shape with an external force, so it is set as the base board of the flexible beam as shown in Fig. 3. Its main parameters: Flexible modulus , Poisson’s ratio , density , the size is .
Fig. 3Schematic diagram of experimental base plate
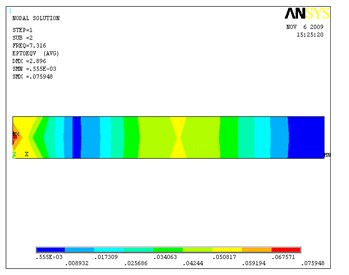
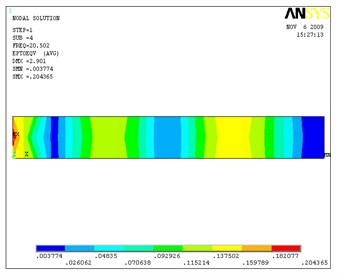
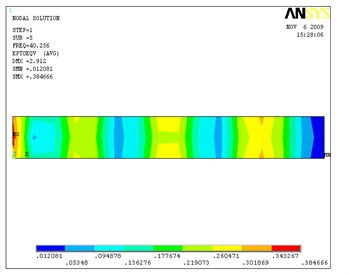
The finite element model is built based on the actual object of epoxy board by finite element analysis software ANSYS 9.0 and made modal analysis. According to low-level bending mode energy of the epoxy board when vibrating and the distorted modal energy is relatively weak, modal frequencies within 50 Hz are adopt. At the same time, the actual model experiment are being carried out and measure the primary modal frequencies within 50 Hz. Then they are compared and the maximum error is within 5 %, indicating that theoretical analysis is closed to experimental results. And in the algorithm simulation and the actual experimental control, the first 4th order measured modal frequencies are taken as the experimental parameters, the values are: 1.16 Hz, 7.32 Hz, 20.50 Hz, 40.25 Hz. Fig. 4 is the modal analysis of the test model base plate.
Fig. 4Modal analysis of the test model base plate
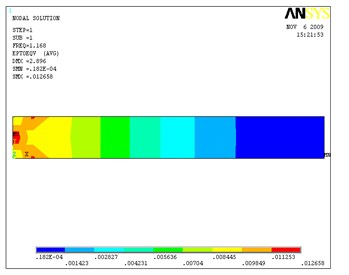
a) The first bending mode stress pattern
b) The second bending mode stress pattern
c) The third bending mode stress pattern
d) The fourth bending mode stress pattern
4.2. Placements of the sensors / actuators
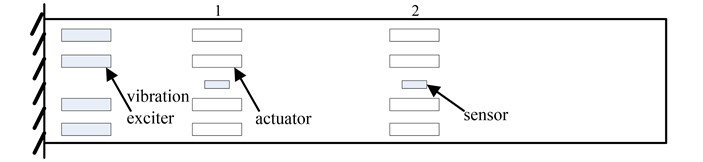
Considering that the distribution of the sensors and actuators depends not only on the model structural feature, also with device characteristics, control rate and the environmental damping, optimal criteria is proposed by Bayard in the paper [22], which divides the optimal placements of the sensors and actuators and the design of control rate into two independent processes, determine the position of the sensor according to the first order vibration mode, and then determine the position of the drive. By the analysis of the results, structural vibration stress concentrates on the boots nearby the beam where the placements of the sensors is optimal and the control effect of the drive is most obvious. Taking into account the concentrated distribution of the vibration stress in other parts of the beam, the distributions should be integrated into account [23].
The 2×2 channels of sensors and actuators are used, whereas the piezoelectric group in the boot is used as the vibration exciter. The size of the piezoelectric sensors is the weight is 1.67 g. whereas the size of the actuators is , the weight is 30 g. Every sensor is a measurement channel, whereas one group actuator is a drive channel. The numbers 1 and 2 in Fig. 5 illustrates that the sensors and actuators has two channels.
Fig. 5Diagram of the sensors / actuators placements
4.3. Construction of experimental platform
The experimental platform is constructed by fixed support base, smart beam, computer, high speed AD and DA card, signal generator, low passfilter, power amplifier, oscilloscope, and other control and measurement units.
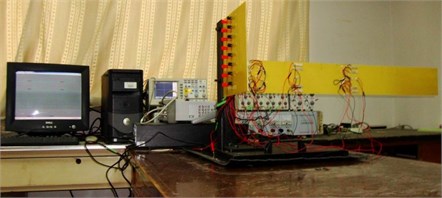
The rubber pad is spread on the basic test table, the fixed support base is installed on the rubber pad to minimize vibration response of the model object on the basic test table, cantilever solid rods and wire terminal block are mounted on the experimental base, the specific size of the fixed support base is 600×600×25 mm; high speed AD and DA card are respectively PIC-1712 and PIC-1721 of Advantech Co., Ltd. Two cards with 12-bit accuracy and computer constitute the core controller hardware part by PCI, the overall experimental platform is shown in Fig. 6.
Fig. 6The platform for the overall control experiment
The measure and control software is developed based on the experimental platform by VC6.0, in order to protect the system functions and implementation of the control process. The basic control process is: At first, a continuous signal is output by the signal generator, and the signal is amplified by the power amplifier to the exciter actuator group. Then the smart beam will keep on vibrating, and the piezoelectric sensors network picks up the vibration signal, which is amplified by charge amplifier and collected by the PIC-1712 AD card through low-pass filter. Finally, after the algorithm process, the control signal is output through PIC 1721 DA card and then amplified by the power amplifier.
5. Experimental analysis and verification
5.1. Simulation analysis
Fig. 7Structural vibration power spectrum without control and imposing control
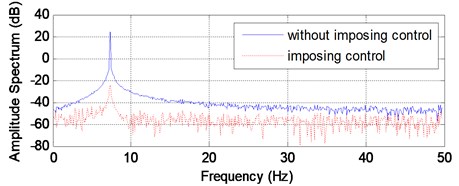
Through offline adaptive identification, the transfer function is obtained as 0.0383+ 0.0772+0.0925+0.0451, which is used for the simulation analysis by Matlab7.1. To make the simulation in consistent with the real situation, the mixed signals are adopted as the exciting signals, which consist of a sinusoidal signal with the frequency 7.32 Hz, the sampling frequency 300 Hz, the step convergence factor 0.01, the length of the adaptive filter is 24, the numbers of iterations is 1500. Comparison diagram of structural vibration power spectrum without control and imposing control is shown in Fig. 7. As the exciter signal is mixed signal, many harmonic components are also contained with the primary component whose frequency is 7.32 Hz. While the control is on, the amplitude of the primary frequency is suppressed to a great extent as well as the harmonic components.
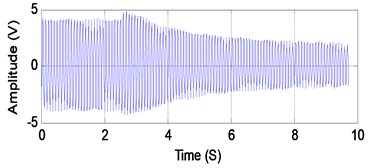
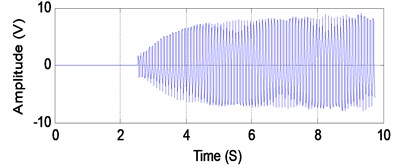
Whereas Fig. 8 and Fig. 9 are respectively simulation results of standard filtered-X LMS algorithm and improved filtered-X LMS algorithm, a) is the vibration response under control, b) is the applied control signal, c) is the performance object function (minimum mean square error, MSE) and d) is the convergence curve for controller weights.
Fig. 8Simulation result of standard filtered-X LMS algorithm
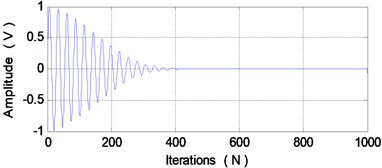
a) Vibration response under control
b) Applied control signal
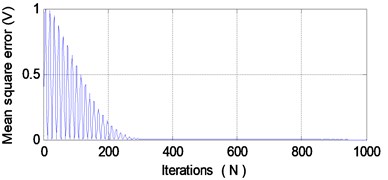
c) Performance object function
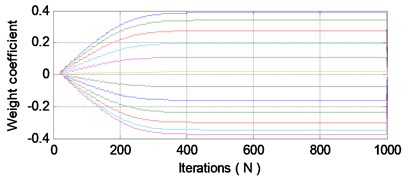
d) Convergence curve for controller weights
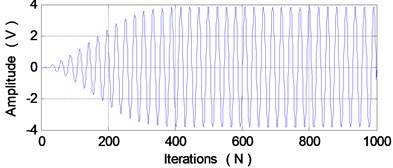
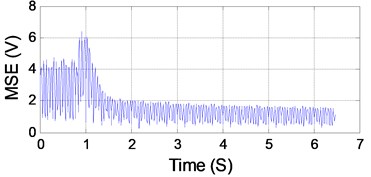
Fig. 9Simulation result of improved filtered-X LMS algorithm
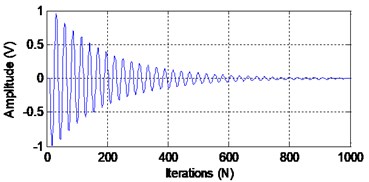
a) Vibration response under control
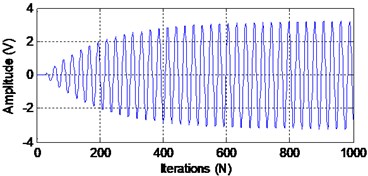
b) Applied control signal
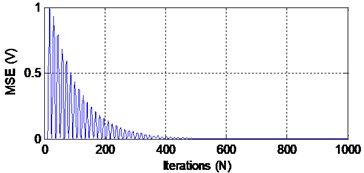
c) Performance object function
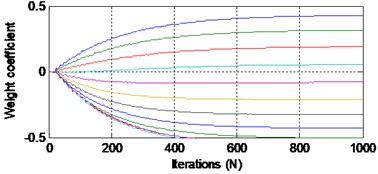
d) Convergence curve for controller weights
As shown in Fig. 8(a), the vibration amplitude is suppressed, which is close to zero 350 times after control is started, whereas it is close to zero 600 times in Fig. 9(a). Seen from Fig. 8(b), the control output signal becomes stable as the numbers of iterations increase, and it is same in Fig. 9(b). Fig. 8(c) shows that the MSE of the performance object function is closed to zero 350 times, whereas it is closed to zero 500 times in Fig. 9(c). Fig. 8(d) illustrates that as the numbers of iterations increases, the convergence curve is converged and it is same in Fig. 9(d). Simulation results between Fig. 8 and Fig. 9 show that the improved control algorithm is slower than standard control algorithm in convergence speed, but is still good in control effect. It is worth to get the practicality of the algorithm by the sacrifice of the convergence speed.
5.2. Experimental validation and analysis
At first, a sinusoidal signal with the frequency 7.32 Hz is output by the signal generator, and the signal is amplified by the power amplifier to the vibration exciter, then the smart beam will keep on vibrating, and the piezoelectric sensors network picks up the vibration signal, which is amplified by charge amplifier, collected through low-pass filter and input to Industrial PC by PIC 1712 AD card. Industrial PC outputs control signal and the control signal output by PIC 1721 DA card, and it is applied to the actuator through the power amplifier, ultimately achieve the purpose of structural vibration control.
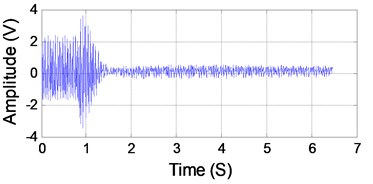
Fig. 10Control performance of SISO improved filtered-X LMS algorithm
a) Vibration response time history
b) Control signal time history
Fig. 11Control performance of MIMO improved filtered-X LMS algorithm
a) Control signal time history for channel 1
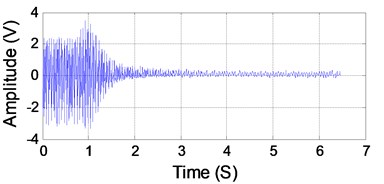
b) Vibration response time history for channel 2
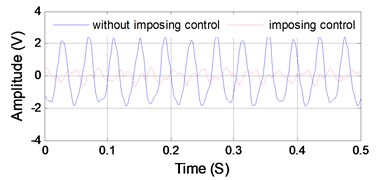
c) Vibration response comparison of channel 1
d) Vibration response comparison of channel 2
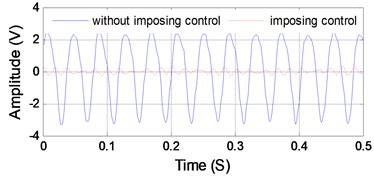
e) Overall vibration control performance
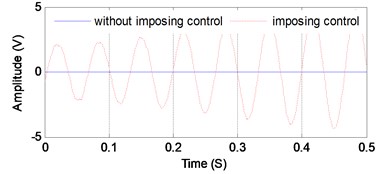
f) Reference signal contrast diagram
When the smart beam will keep on vibrating, the modal frequency is obtained as 7.32 Hz which is one of the first 4th orders for single-input single-output experiment, and sensors and actuators in the second channel are selected as the input and output channels, the order of FIR filter is the 24th order, the convergence step is . By the analysis of the experimental and actual data, diagrams are drawn as shown in Figs. 10(a), (b), which respectively are the sensor signal vibration response in the second channel and the actuator signal output response. The signal sampling frequency is converted data sampling interval time, considering that the data collected is more intensive, every 60 data is as a drawing sampled value for more intuitive effect, the methods are also applied into the rest of the paper.
As shown in Fig. 10(a), (b), the control signal is applied at about 1.6 s, then the vibration response has been greatly suppressed between in 3 s and 8 s, the output control signal is relatively stable after 8 s, the system is basically at the point of balance.
In the case of the above experimental conditions, 2×2 multi-channel active vibration control experiment are carried out as shown in Fig. 11(a)-(f), Fig. 11(a) and (b) show that the amplitude of the vibration response decreases greatly at 1.8 s, and then immediately remain stable. To easily compare with the different effects of structural vibration response before and after control, the vibration response signals are respectively shown in Figs. 11(c) and 11 (d) in the form of a solid line and a broken line, we can see that the vibration response dropped more than 70 % after applying control. Comparative analysis with Fig. 10 show that multi-channel control is better in the overall control effect than single-channel control.
Fig. 11(e) is an overall suppression effect diagram of structural vibration response (i.e., the sum of each sensor signal minimum mean square error (MSE)). Seen from the figure, structural overall response significantly decreased after applying control, indicating that the overall vibration obtains effective inhibition. Fig. 11(f) is the reference signal contrast diagram of without control and control. Seen from above, the reference signal obtained by self-extracting has a strong correlation with the excitation signal through the control algorithm.
6. Conclusions
Large flexible space structures, illustrated by the solar panels, have the properties of low stiffness and small damp, large structural size, low natural frequency and modal-intensive. Considering that the space environment is closed to the vacuum and the damping is extremely small, slight vibration will result in great influence on spacecraft systems, so the vibration suppression control has become a hot topic in the development of aerospace systems. An improved LMS control algorithm is proposed for solving the shortcoming of predicting the reference signal in advance by analyzing the classical FXLMS, its reference signal is a direct synthesis of the structural vibration response (i.e. no special reference sensors in structure). The preliminary experimental results show that: the improved active vibration control algorithm is better in the suppression of vibration effect.
Another: The impact of the selections of the filter order and the convergence factor on the algorithm and system control delay, which has a certain relationship with the shortening of the convergence time and the improvement of control accuracy, so it can promote the study in this field.
References
-
Ozer A, Semercigl S. E. An event-based vibration control for a two-link flexible robotic arm: Numerical and experimental observations. Journal of Sound and Vibration, Vol. 313, Issue 3-5, 2008, p. 375-394.
-
Laborde S., Calvi A. Spacecraft base-sine vibration test data uncertainties investigation based on stochastic scatter approach. Mechanical Systems and Signal Processing, Vol. 32, 2012, p. 69-78.
-
Lardeur P., Scigliano R., Scionti M. Verification and validation for the vibration study of automotive structures modelled by finite elements. Journal of Strain Analysis for Engineering Design, Vol. 48, Issue 1, 2013, p. 59-72.
-
Rutkovskii V. Y., Sukhanov V. M., Glumov V. M. Stabilization of low-frequency vibrations of a large satellite structure with powered gyro control. Automation and Remote Control, Vol. 74, Issue 3, 2013, p. 413-425.
-
Adachi K., Ueha S. Modal vibration control of large ultrasonic tools with the use of wave-trapped horns. Journal of the Acoustical Society of America, Vol. 87, Issue 1, 1990, p. 208-214.
-
Kumar R., Khan M. Pole placement techniques for active vibration control of smart structures: A feasibility study. Journal of Vibration and Acoustics-Transactions of the ASME, Vol. 129, Issue 5, 2007, p. 601-615.
-
Rajamohan V., Sedaghati R., Rakheja S. Optimal vibration control of beams with total and partial MR-fluid treatments. Smart Materials and Structures, Vol. 20, Issue 11, 2011, p. 115016.
-
Hacioglu Y., Yagiz N. Adaptive backstepping control with estimation for the vibration isolation of buildings. Journal of Vibration and Control, Vol. 18, Issue 13, 2012, p. 1996-2005.
-
Kim B., Washington G. N., Singh R. Control of modulated vibration using an enhanced adaptive filtering algorithm based on model-based approach. Journal of Sound and Vibration, Vol. 331, Issue 18, 2012, p. 4101-4114.
-
Rittenschober T., Schlacher K. Observer-based self sensing actuation of piezoelastic structures for robust vibration control. Automatica, Vol. 48, Issue 6, 2012, p. 1123-1131.
-
Erkaya S. Analysis of the vibration characteristics of an experimental mechanical system using neural networks. Journal of Vibration and Control, Vol. 18, Issue 13, 2012, p. 2059-2072.
-
Eski I. Vibration analysis of drilling machine using proposed artificial neural network predictors. Journal of Mechanical Science and Technology, Vol. 26, Issue 10, 2012, p. 3037-3046.
-
Nasser H., Kiefer-Kamal E. H., Hu H., Belouettar S., Barkanov E. Active vibration damping of composite structures using a nonlinear fuzzy controller. Composite Structures, Vol. 94, Issue 4, 2012, p. 1385-1390.
-
Montazeri A., Poshtan J. A new adaptive recursive RLS-based fast-array IIR filter for active noise and vibration control systems. Signal Processing, Vol. 91, Issue 1, 2011, p. 98-113.
-
Zhu Xiaojin, Gao Zhiyuan, Huang Quanzhen Analysis and implementation of Mimo Fulms algorithm for active vibration control. Transactions of the Institute of Measurement and Control, Vol. 34, Issue 7, 2012, p. 815-828.
-
Carnahan J. J., Richards C. M. A modification to filtered-X LMS control for airfoil vibration and flutter suppression. Journal of Vibration and Control, Vol. 14, Issue 6, 2008, p. 831-848.
-
Tsai C. W., Huang C. H., Lin C. L. Structure-specified IIR filter and control design using real structured genetic algorithm. Applied Soft Computing, Vol. 9, Issue 4, 2009, p. 1285-1295.
-
Yang Z. D., Huang Q. T., Han J. W., Li H. R. Adaptive inverse control of random vibration based on the filtered-X LMS algorithm. Earthquake Engineering and Engineering Vibration, Vol. 9, Issue 1, 2010, p. 141-146.
-
Kim H. W., Park H. S., Lee S. K., et al. Modified-filtered-U LMS algorithm for active noise control and its application to a short acoustic duct. Mechanical Systems and Signal Processing, Vol. 25, Issue 1, 2011, p. 475-484.
-
Glugla M., Schulz R. K. Active vibration control using delay compensated LMS algorithm by modified gradients. Journal of Low Frequency Noise Vibration and Active Control, Vol. 27, Issue 1, 2008, p. 65-74.
-
Sun X., Chen D. S. A new infinite impulse response filter-Based adaptive algorithm for active noise control. Journal of Sound and Vibration, Vol. 258, Issue 2, 2002, p. 385-397.
-
Bayard D. S., Hadaegh F. Y., Meldrum D. R. Optimal experiment design for identification of large space structures. Automatica, Vol. 24, Issue 3, 1988, p. 357-364.
-
Kumar K. R., Narayanan S. Active vibration control of beams with optimal placement of piezoelectric sensor/actuator pairs. Smart Materials and Structures, Vol. 17, Issue 5, 2008, p. 1-15.
About this article

This research is supported by the Key Projects of the National Natural Science Foundation of China (No. 61233010), National High Technology Research and Development Program of China (863 Program, No. 2011AA040202), National Nature Science Foundation of China (No. 61104006, No. 11202121, No. 61305106), Key Science and Technology Program of Henan Province (No. 14A413003), Doctoral Science Foundation Project of Henan Institute of Engineering (No. D2013011).
