Abstract
This work presents the analytic and experimental research of a vibration de-icing method for aircrafts with piezoelectric transducer as the actuator. The maximum displacement of the structure will be achieved when excited at the natural frequencies. The vibration induces shear stress at the interface of the ice and structure, which leads to the shedding off of ice. A shear model of linear Bernoulli-Euler type is derived with ice attached to a flat plate, which is capable of predicting the shear stress along the interface and gives guidance to the choice of vibration modes for de-icing. The finite element method (FEM) is used to get the relationship between the length of piezoelectric actuator and the vibration intensity of the modes to be excited. The optimal length is determined in order to maximize the shear stress. The results indicate that peak values of the shear stress at the interface appear at the edges of the ice, and the amplitudes depend upon the strains on the surface of plate underlying the edges of ice. For a specific mode the maximum excitation happens when the length of piezoelectric actuator is an odd integer multiple of the half wavelength of that mode. Actually the optimal length would be a slightly longer due to the influence of the actuator. Finally, experimental investigations on a clamped aluminum plate are carried out to verify the results of the analysis. The power consumption for vibration de-icing is about 36.5 w/m2, which is only 1.57 % of the power consumption when using the latest electro-thermal de-icing method.
1. Introduction
Aircraft icing is one of the major hazards to aviation. When the aircraft flies through clouds containing “super-cooled” liquid water droplets, icing is likely to occur on impact. The ice will distort the smooth flow of air over the wing, resulting in the reduction of the wing’s maximum lift and the critical angle of attack leading to a stall, as well as significantly increasing drag and adversely affecting the handling qualities of airplanes [1-3]. Icing problems bring serious security threats and potential economic losses to the aviation, thus efficient de-icing methods are in urgent demand.
The de-icing methods consist of freezing point depressants, thermal melting and surface deformation according to their mechanism [4]. De-icing by thermal melting is a well-developed and commonly used technology while its high power requirement is a significant disadvantage. Freezing point depressants have a low power demand, but the weight brought by the huge demand for certain chemistry fluid limits its usage on in-flight de-icing compared with its application on the ground. The surface deformation systems are developed to reduce the amount of energy required for de-icing. The ice cracks and debonds from the deformed surface, and the particles are carried away by the aerodynamics force. Among the prevalent surface deformation systems, some have to change the outer surface of the wing, and others produce strong forces to destroy the adhesive strength of ice, which present a threat to the fatigue of the skin [5-9]. The research on the adhesive properties of ice indicates that the adhesive strength of ice is much lower in shear than in tension [10]. Based on this conclusion, a vibration method with piezoelectric actuators is carried out to de-ice in a softer and efficient manner.
The global research on de-icing by piezoelectric actuators can be divided into two categories. One stimulates the actuator at ultrasonic frequency range [11, 12], and the other induces the resonance of structures at much lower frequency. The latter method is studied in this work. Kandagal and Venkatraman used piezoceramic actuators to induce vibration in a flat plate, the de-icing experiment was successful at resonance frequencies at which the peak values of shear stresses exceeded the adhesive shear strength values of ice on the plate [13]. Venna and Lin et al. developed this method on an aircraft leading edge structures, and the experimental results confirmed the advantages of this method in the aspect of the less power consumption and the relatively light weight [14]. However, though effective de-icing is achieved, the current researches all take aim at searching for appropriate vibration modes which generate shear stress that is big enough for ice to shed off on the premise of certain determined arrangement of piezoelectric actuators, while in this paper some basic questions such as the stress analysis of ice patch and the influence of actuator dimensions on the vibration intensity of certain mode would be investigated with the main purpose of promoting the application design of this method to a more active level.
2. Stress analysis of the ice under deformation
The vibration de-icing method removes the ice on skins through surface deformation in certain resonant mode. The analysis of shear stress at the interface between the ice and airfoil surface would help interpreting the mechanism of this method and conducting the selection of vibration modes against the icing position. A 2D analytical model is developed to get the stress distribution, and then the result is compared with that obtained from the finite element model.
2.1. Shear model of ice/substructure bonding
Santoni-Bottai [15] presented an analytical solution for the transfer of stress between a structurally attached piezoelectric transducer and the support structure. Linear distribution across the thickness of piezoelectric transducer was assumed, and the strain distribution across the structure was supposed to be a linear Bernoulli-Euler type. Good results were obtained under these hypotheses, thus the interfacial shear stress between ice and substructure would be investigated on the basis of the Euler–Bernoulli theory as well.
Considering an ice patch frozen on the surface of an aluminum plate as a substitution for skin of the wing, as shown in Fig. 1. The free body diagram for the infinitesimal elements of the ice and plate is also depicted. The ice is divided into two parts in the thickness, and the layer adjacent to the plate is assigned to transfer shear stresses only.
Fig. 1Shear model of ice-plate geometry
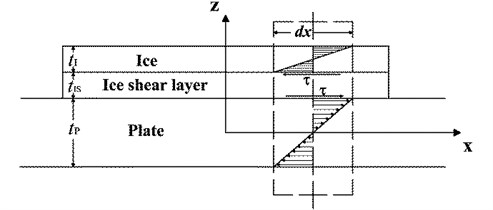
The axial stress has a linear distribution across the thickness when the plate undergoes the bending deformation, and a moment resultant is generated:
where is the axial stress, is half of the thickness, and superscript denotes the surface of the ice or plate.
Equilibrium of the infinitesimal element of Fig. 1 yields:
where means taking the derivative in the -direction.
Substituting Eq. (1) into Eq. (2) yields , i.e.:
where is the thickness, and subscript and denote ice and plate respectively.
Under the assumption of pure axial strain in the ice and plate and pure shear in the ice shear layer, the strain-displacement relationships are:
where subscript denotes the ice shear layer.
For the ice and plate, the isotropic stress-strain relations are:
where is the Young’s modulus, and is the shear modulus.
Eqs. (3)-(10) constitute the eight governing equations with the eight unknowns: the displacements on the bottom surface of ice () and top surface of plate (), and the stresses and strains on the surface of the ice (,), the ice shear layer (,), and the plate (,). Substituting Eq. (7) into Eq. (10), inserting the result into Eqs. (3) and (4), differentiating Eqs. (5), (6), (8) and (9) and substituting the former derivations yields two coupled second-order differential equations:
Eqs. (11) and (12) can be further reduced to a pair of uncoupled fourth-order differential equations:
in which:
Solving Eqs. (13) and (14) for the strain distribution and applying the coupling constrains underlying Eqs. (11) and (12) give:
The four unknown constants in Eq. (17) can be determined by applying four strain boundary conditions. The strains at the edges of the ice should be zero due to the stress-free condition, and strains on the plate surface underlying the edges of ice depend on the deformations. Thus the boundary conditions are, at:
and at:
where and are the known plate surface strain values at the locations underlying the right (+) and left (-) edges of the ice, and the length of ice x is scaled to ±1 for ease of calculations.
Substituting boundary conditions into Eq. (17), the unknown constants are obtained:
Substituting Eqs. (17) and (18) into Eqs. (5) and (6), the result are integrated and inserted into Eq. (7), then are substituted into Eq. (10). At last the shear stress in the ice shear layer is derived:
When the thickness of the ice shear layer is determined, the shear stress in Eq. (19) can be regarded as deponding on the strains on the plate surface underlying the boundary of the ice, which is relevant to the vibration intensity or deformation of the plate. This is helpful in selecting the optimal resonant mode to de-ice when the position of freezing is known, since the strains around the peaks of certain mode shape are maximum.
2.2. Numerical analysis
On the basis of the shear model, a specific analysis is carried out to calculate the interfacial shear stress between the ice and a 1 mm thick aluminum plate under resonant excitation. A finite element model of the plate with an ice patch is set up by the multiphysics software ANSYS, with which the strains on the plate surface ( and ) are calculated, and the result of the shear model is calibrated afterwards.
To simulate the same setup as that in the practical experiment, the plate is fixed on two sides. The material properties used in the calculations are listed in Table 1. The first vibration mode of the plate is picked out to perform the analysis, and a 1 mm thick ice patch is located at the middle along the length direction of the plate, just upon the crest of the mode shape. The mesh of the finite element model is chosen to be a 2D structured quadrilateral, and the calculation results are shown in Fig. 2.
Table 1Material properties used for the analysis
Material | Density (kg/m3) | Young’s modulus (GPa) | Poisson’s ratio |
Ice | 920 | 9.33 | 0.325 |
Aluminum plate | 2780 | 70.5 | 0.33 |
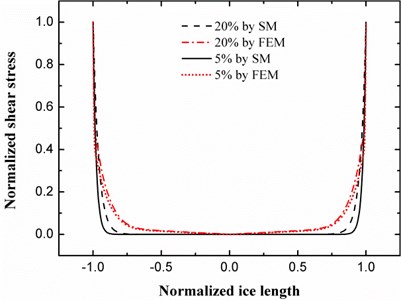
The percentage in Fig. 2 represents the thickness ratio of the ice shear layer to the total thickness of the ice. In the finite element model the ratio 20 %, for example, indicates that the ice contains 5 elements in the thickness. The stress values are normalized to 0-1 range to compare, and the results show that the shear stress obtained by shear model and finite element method share common characteristics, which is approximately zero at the middle section and changes slowly until finally rushes up to the maximum at the tips. The spike in stress value at the tips ascends faster when the ice shear layer is thinner, which leads to the fact that the shear stress concentrates on the tips of ice in ideal situation. Therefore, we can conclude that the initial debonding of ice would occur at the edges during the vibration de-icing process.
Fig. 2Shear stress at the interface between ice and plate calculated by shear model and finite element method
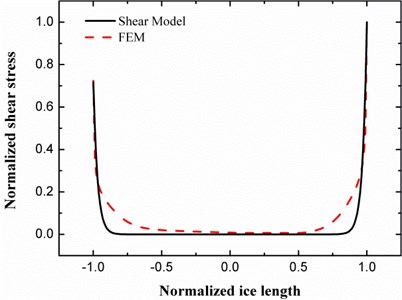
When the midpoint of ice patch is deviate from the wave crest of the plate at resonance, the corresponding left and right strains on the plate surface become unequal, and the shear stress is also affected. To illustrate this in a new model, the ice patch in the above model is moved to the left for a short distance so that the right edge is attracted toward the crest while the left edge is repelled backward, thus the left strain is smaller than the right one as a result. The new stress distribution is depicted in Fig. 3.
The values of strain are got from the finite element calculation and substituted into the shear model, and then the shear stresses at the edges are derived which are nearly equal to that from the finite element calculation after being normalized. Fig. 3 proves that the magnitude of shear stress at the interface is positively related to the strain values on the plate surface, i.e., when the strain at the edge of the ice decreases the shear stress is also impaired. Therefore, both of the ice position and the scope of icing are crucial factors that influence the effectiveness of de-icing. This conclusion is useful in determining the vibration mode. The edges of ice should be placed around the area with relatively large surface extensional strain on the plate, which can be achieved by selecting a proper mode shape.
Fig. 3The shear stress distribution of the ice patch coresponding to unequal strains on the plate
3. Optimal length of PZT for vibration excitation
The finite element analysis software ANSYS has been proved effective in years of applications on vibration analysis, thus it is employed here to investigate the influence of the length of piezoceramic actuator to the vibration excitation of the plate. In the finite element model the length of the plate is 200 mm and the thickness is 1 mm, and the material property can be found in Table 1. The material of the rectangular actuator is PZT8 with the thickness 1 mm. The plate is fixed on two sides, and a single PZT is bonded on the plate at the wave crest or trough where produces the largest strain energy. Alternating voltage is applied to the PZT to excite the vibration of the plate through reverse piezoelectric effect, and the length of the PZT will be changed to search for its relationship with the vibration intensity of certain mode.
3.1. The principle of equivalent power consumption
The major advantage of vibration de-icing method is its capability to minimize the power consumption. High stress is generated with low power inputs by exciting the structure to its natural frequency. The power consumption should be considered carefully in the design progress, thus a principle of equivalent power consumption is proposed here.
The current required to drive the PZT is given by the equation:
where is the capacitance in Farads, is the peak drive voltage in Volts, and is the frequency in Hz. Capacitance for a given PZT and frequency is constant and hence, the power requirement of the PZT for a given structure at a given frequency of operation is:
In the research of the relationship between the length of PZT and the vibration intensity at certain natural frequency, the power consumption on each PZT with different length should be invariable in order to make the comparison more meaningful, which requires:
where denotes a constant. Assume the rectangular PZT with electrodes on two surfaces is treated as a parallel-plate capacitor, the capacitance would have the expression . Substitute it into Eq. (22) and get:
where is the permittivity of PZT, is the area of the cross-section parallel to the electrode, and is the thickness of PZT between two electrodes. If the width of PZT is a constant, the area will only depend on the length of it. Considering the applied voltage at unit length of PZT as a baseline, the voltage corresponding to the length should be:
Eq. (24) indicates that the applied voltage should be reduced with the increase of the length of PZT to keep the power consumption at a constant level. This principle will be complied with during the following investigations.
3.2. Finite element analysis on length variation of PZT
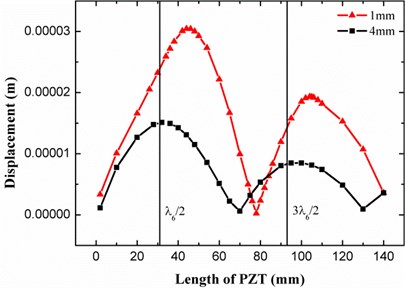
The bending vibration of the plate instead of the torsional vibration is primarily considered, thus a 2D finite element model is established. Since the plate is fixed on two sides, the nomenclature of resonant modes depends on the number of wave peaks of the mode shape. For example, the first mode has only one peak in the middle, and the second mode has a wave crest and a wave trough. A single piece of PZT is attached to the surface of the plate to excite the vibration. The PZT patch is placed in the middle peak of the plate when an odd mode is excited, while it is moved to the right peak adjacent to the middle node when an even mode is studied. Varied voltage is applied to the PZT according to the different length, and the displacement of a point on the plate is selected as a response to the intensity of vibration at a specific natural frequency. The analysis results of the fifth and sixth mode are shown in Fig. 4.
Fig. 4The relationship between displacement response of the plate and the length of PZT actuator under the 5th and 6th vibration modes
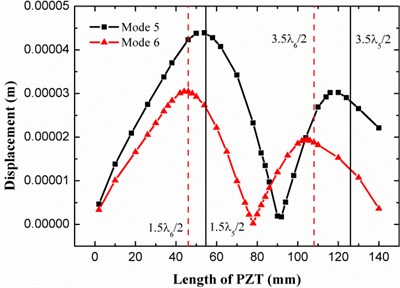
Fig. 4 displays two peaks on the displacement-length curve for both of the fifth and sixth modes, which appear around the PZT length of about 1.5 times and 3.5 times the corresponding half wavelength. This relationship implies that maximum excitation happens when the PZT length satisfies the condition:
where is the wavelength of the vibration mode to be excited.
Giurgiutiu studied the Lamb wave excitation with piezoelectric wafer active sensors, and a conclusion was obtained through theoretical derivation that [16] the construction of optimum match between the sensor and structure for the excitation of axial waves for a given wavelength can be achieved when:
where is the length of piezoelectric sensors.
In fact, the equations of motion for vibration problems and the wave equations are derived from the same governing equations, strain displacement equations and constitutive equations, and the differences between them are owing to the different treatments to the boundary conditions. Therefore, it is not difficult to understand the similarity between Eqs. (25) and (26). Furthermore, the deviation is supposed to derive from the simplification to the theoretical model by Giurgiutiu, i.e., the additional local stiffness brought by the piezoelectric sensors is not taken into account. To verify this assertion, a new finite element model is built with the variation of the plate thickness from 1 mm to 4 mm, through which the influence of the additional stiffness brought by the PZT is relatively diminished. The analysis results of the sixth mode are shown in Fig. 5.
Fig. 5The displacement response of the 1 mm and 4 mm plates to different length of PZT actuator at the 6th vibration modes
In Fig. 5 the voltage applied on the PZT for the 1 mm plate is the same as that in Fig. 4, while for the 4 mm plate it is 4 times magnified for the convenience of comparing. Compared with the displacement-length curve for the 1 mm plate, the curve for the 4 mm plate has an evident shift to the left, and the length values corresponding to the two peaks varied from 1.5 and 3.5 multiple of the half wavelength to 1 and 3 as that revealed in Eqs. (25) and (26). Therefore, a conclusion is drawn that theoretically the maximum excitation of certain mode happens when the PZT length is an odd integer multiple of the half wavelength, but in practice the optimal length would be a little longer due to the additional stiffness brought by the PZT.
4. Experimental verification
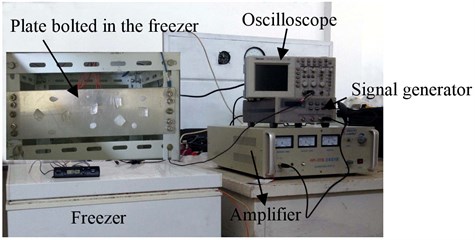
A set of practical tests was carried out in a commercial freezer with temperature maintained between –20°C to –15°C to verify the conclusions from the above investigation. The plate was 300×80×1 mm in size and clamped on two edges. Six pieces of PZT actuators with the size 20×20×1.5 mm were glued on one side of the plate by epoxy resin adhesive, and the arrangement was depicted in Fig. 6. Ice patches were formed on the other side by pouring the purified water onto the plate surface surrounded by a small lattice with plastic tape on the inner side to avoid sticking of ice to the lattice, which were approximately 20×20 mm in size with a varied thickness from 2 mm to 6 mm.
To excite the PZT actuators, an amplifier was used to amplify the alternating current signal proceeding from a signal generator. A small piece of PZT sensor was placed in the middle of the plate as a feedback on the vibration intensity which was observed through an oscilloscope. The frequency of the output signal from the generator was adjusted to meet the resonance frequency of certain mode, where the amplitude of the feedback signal reached a local maximum, and enough shear stress was generated to break the interfacial adhesion between the plate and the ice and shed the ice off. See Fig. 7 for the entire experiment setup.
Fig. 6The placement of PZT in the experiment
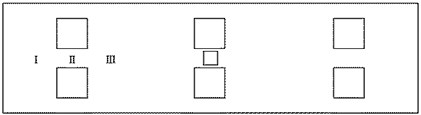
Fig. 7A photo of the experimental setup
4.1. Vibration test and finite element simulation alignment
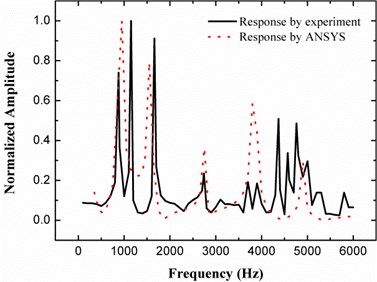
The dynamic response of the whole structure was recorded through the feedback signal from the middle sensor by a sweep of excitation signal frequency from 100 to 6000 Hz. The sine excitation signal was generated by a signal generator and amplified to around 200 Vpp before applied on the PZT actuators. Vibration was excited thereafter and a voltage signal was induced as a feedback from the small PZT sensor in the middle position due to the deformation of the plate. The feedback signal was collected by an oscilloscope and shown in Fig. 8. A theoretical calculation is conducted through the harmonic analysis function of ANSYS. A 2D finite element model of the plate with actuators attached is established and a similar sweep signal was added to the actuators. The displacement of a point at the central area was recorded to represent the response of vibration. The comparison between the structural response calculated by the infinite element model and that acquired in the practical experiment is shown in Fig. 8.
Influenced by the arrangement of actuators, the theoretical excited modes shown in Fig. 8 are the fifth, seventh, ninth, eleventh and thirteenth mode respectively. The frequency of the fifth mode is 950 Hz while the correspondingly experimental value is 880 Hz with a discrepancy of 7.4 %. The frequency of the seventh mode is 1550 Hz and its counterpart is 1660 Hz with a discrepancy of 7.1 %. The discrepancy between the ninth modes is 0.4 %. The comparison shows that the finite element simulation is capable to predict the resonant modes quite accurately. However, there are still some modes on the experimental curve lost their counterparts on the theoretical curve, for example, the mode at 1150 Hz seems alone, and there are two modes around the frequency corresponding to the theoretical eleventh mode, and the modes between 4000 to 5000 Hz are complicated. This is partly due to the simplification to the finite element model, since the 2D model loses the information of torsional vibration, and the modes calculated are the bending vibration along the longitudinal direction while acturally there also exists the interference of vibration in the transverse direciton due to the imperfectly fixed boundary and the bi-directional exciting behavior of PZT actuators. The inaccuracy of model parameters is another possible reason. Overall, although there are some discrepancies, the coincidence between the test results and the finite element simulation is satisfying.
Fig. 8Structural response by experimental measurement and harmonic analysis calculation
4.2. Verification of shear model
It is not hard to deduce from the conclusion of section 2 that the shear stress at the edge of ice is larger when the ice patch is located around the wave crest of the mode shape than that around the area in the middle of the crest and trough due to the different magnitude of plate strain. Therefore, the ice patch around the wave crest is easier to remove. The fifth mode is selected to verify this deduction. Area I and III marked in Fig. 6 are proved to be the wave creat or trough of the fifth mode by a measurement, while II is a lower strain area. The measurement was made by Chladni method, which involved sprinkling fine powder on the surface of the plate when vibrating at the fifth resonant frequency and then observing the formed pattern as the powder gathered along the nodal lines of the fifth mode shape. Three pieces of ice patches with the same size were formed in the three areas simultaneously under the same icing environment. The exciting voltage increased gradually until the induced shear stress exceeded the adhesive shear strength of ice, then the ice patch shed off immediately.
This experiment was repeated for numerous times, and in most cases the ice patches in area I and III dropped off firstly, then the ice in area II dropped as the exciting voltage kept rising up, which means that the ice in a larger strain area is easier to remove than an area with lower strain. This phenomenon is quite in accordance with the prediction, therefore it would be an effective verification to the shear model.
4.3. Verification of the optimal PZT length
Extensive tests with ice frozen on numerous positions indicate that the best vibration mode for de-icing is the thirteenth around 5000 Hz followed by the fifth around 900 Hz. However, the strongest tested feedback signal appears at vibration modes before 2000 Hz as depicted in Fig. 8, and the feedback at around 5000 Hz is relatively weak. A possible interpretation is that the feedback signal is a reflection of the electrical charges generated on the electrodes of the middle PZT sensor as a result of the mechanical deformation of the plate, which could offer a reference to the vibration intensity of a mode under differernt magnitudes of excitation, but may be less precise when comparing the intensities of different modes due to the complexity of energy harvesting. Therefore, a more straightforward and efficacious parameter should be adopted to predict the de-icing capability of different modes. The extensional strain on the surface of structure is much anticipated according to the analysis of shear model. A representative point around the middle zone of the plate is selected, and the strain on this point is calculated through harmonic analysis on a 2D finite element model. The strain response is shown in Fig. 9.
Fig. 9 shows that the maximum strain appears at the thirteenth mode around 5000 Hz, thus the thirteenth mode is believed to have the ability to obtain optimal de-icing result, which is in good accordance with the experimental statistics. Meanwhile, the half wavelengths of the five conspicuous modes are calculated and listed in Table 2 to further illustrate this argumentation.
Fig. 9Strain response by harmonic analysis calculation
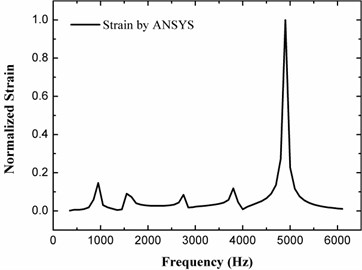
Table 2 shows that the half wavelength of the 13th mode is the closest to the length of PZT used in the experiments, which is 20 mm. The analysis in section 3 indicates that the maximum excitation of a mode will happen when the PZT length equals to or slightly longer than the odd integer multiple of the half wavelength, thus when the odd integer equals to 1 the thirteenth mode is definitely the optimal choice for the current size of PZT actuators. This is a reasonable explanation to the actual effect of numerous de-icing experiments, as well as a powerful verification to the analysis on optimal PZT length.
Table 2Half wavelength of the dominant vibration modes
Mode number | Frequency (Hz) | Half wavelength (mm) |
5th | 950 | 58.5 |
7th | 1550 | 40 |
9th | 2750 | 31.5 |
11th | 3800 | 25 |
13th | 4900 | 21.5 |
5. Conclusions
A shear stress model is established to analyze the distribution of shear stress at the interface between the ice and substucture when the deformation is produced, and the maximum shear stress is found to be concentrated on the edges of the ice. As a result, the debonding starts off from edges of the ice, then maximum shear stress emerges on the new edges until the shedding off of the entire ice patch. The magnitude of the shear stress depends on the extensional strain of the substucture at the interface underlying the edges of the ice, thus the strain can be treated as an effective reference in the theoretical calculation for mode selection. Furthermore, the choice of vibration mode should insure that the probable icing position is situated at sections of a mode shape with relatively large strain.
The length of the piezoelectric actuator that leading to maximum excitation of a vibration mode is invertigated through finite element analysis software ANSYS. A principle of equivalent power consumption is proposed to assign the magnitude of exciting signals in the analysis. The displacement is chosen as a reflection of the vibration intensity of the substructure. Theoretically, the maximum excitation of a vibration mode is acquired when the length of actuator is an odd integer multiple of the half wavelength, whereas in practice the optimal length would be a little longer due to the additional stiffness brought by the actuator. This conclusion is instructive during the design and arrangement of the actuators when the vibration mode for de-icing is determined.
The shear model and the analysis on the optimal PZT length are verified through a series of de-icing experiments, convincing demonstrations are acquired attribute to the alignment of the theoretical analysis with the experiments. Voltage lower than 700 Vpp is applied to drive the PZT actuators, and the tested electric current is lower than 0.01 App. Therefore the power consumption of PZT actuators is about 36.5 w/m2 without considering the consumption of electric apparatus, which is quite small compared with the consumption 2.325 kw/m2 of the low power electrothermal de-icing system [17]. Therefore, the vibration de-icing method is effective and energy efficient, and deserves prosperous perspective.
When applying this technology to aviation industry, a critical question is how to install the piezoelectric actuators on wings of commercial airliners. The ice always accretes at the leading edge of the wings, where the curve is too large for the adhesion of actuators. Modes should be selected carefully so that the deformation of the leading edge is relatively great and large strain can be induced, and the actuators could be placed in the rear where the surface is flatter and at the wave crest or trough with an appropriate length. The finite element simulation and experimental verification should be applied for the de-icing design against a specific structure of the wing, which would be the next step of this work.
References
-
Han Y., Palacios J. Analytical and experimental determination of airfoil performance degradation due to ice accretion. 4th AIAA Atmospheric and Space Environments Conference, New Orleans, 2012.
-
Hoadley A., Pederson E. Prediction of airfoil stall in icing conditions using wing surface pressures. Journal of Aircraft, Vol. 39, Issue 2, 2002, p. 326-330.
-
Lee S., Bragg M. B. Investigation of factors affecting iced-airfoil aerodynamics. Journal of Aircraft, Vol. 40, Issue 3, 2003, p. 499-508.
-
Thomas S. K., Cassoni R. P., MacArthur C. D. Aircraft anti-icing and de-icing techniques and modeling. Journal of Aircraft, Vol. 33, Issue 5, 1996, p. 841-854.
-
Zumwalt G. W. Analysis and tests for design of an electro-impulse de-icing system. NASA contractor report NASA CR-174919, National Aeronautics and Space Administration, Washington, 1985
-
Haslim L. A., Lee R. D. Electro-expulsive separation system. United States, Patent No. 4690353, 1987.
-
Martin C. A., Putt J. C. Advanced pneumatic impulse ice protection system (PIIP) for aircraft. Journal of Aircraft, Vol. 29, Issue 4, 1992, p. 714-716.
-
Gerardi J. J., Ingram R. B. Electro-magnetic expulsion de-icing system. Unite States, Patent No. 6102333, 2000.
-
Al-Khalil K. Thermo-mechanical expulsion deicing system – TMEDS. 45th AIAA Aerospace Sciences Meeting, Reno, NV, United States, 2007.
-
Raraty L. E., Tabor D. The adhesion and strength properties of ice. Proceedings of the Royal Society of London Series A Mathematical and Physical Sciences, Vol. 245, Issue 1241, 1958, p. 184-201.
-
Ramanathan S., Varadan V. V., Varadan V. K. Deicing of helicopter blades using piezoelectric actuators. Smart Structures and Materials – Smart Electronics and MEMS, Newport Beach, CA, USA, 2000.
-
Palacios J. L., Smith E. C., Rose J. L. Investigation of an ultrasonic ice protection system for helicopter rotor blades. 64th Annual Forum – AHS International, Montreal, Canada, 2008.
-
Kandagal S. B., Venkatraman K. Piezo-actuated vibratory deicing of a flat plate. 46th Structures, Structural Dynamics and Materials Conference, Austin, TX, United States, 2005.
-
Venna S. V., Lin Y. J., Botura G. Piezoelectric transducer actuated leading edge de-icing with simultaneous shear and impulse forces. Journal of Aircraft, Vol. 44, Issue 2, 2007, p. 509-515.
-
Santoni-Bottai G., Giurgiutiu V. Shear lag solution for structurally attached active sensors. Sensors and Smart Structures Technologies for Civil, Mechanical, and Aerospace Systems, San Diego, CA, United States, 2010.
-
Giurgiutiu V. Structural Health Monitoring with Piezoelectric Wafer Active Sensors. Boston, Academic Press, 2008, p. 312-316.
-
Botura G. C., Sweet D., Flosdorf D. Development and demonstration of low power electrothermal de-icing system. 43rd AIAA Aerospace Sciences Meeting and Exhibit, Reno, NV, United States, 2005.
About this article

This work was supported in part by the Aeronautical Research Foundation of 611 (Study on the Structural Integration System of New Efficient Piezoelectric Ice Detection and De-icing), the Funding of Jiangsu Innovation Program for Graduate Education (No. SJLX_0143), and the Fundamental Research Funds for the Central Universities.
