Abstract
The paper presents results of investigation of hydropneumatic strut on indicator test stand. On this stand the force versus displacements and force versus velocity loops were determined. The research were made for changeable static pressure corresponding static load of car with hydropneumatic suspension system. Based on results of investigation the damping characteristics as a function of velocity and static pressure damping surface were determined. Three-dimensional damping characteristics taking into account the static load of the vehicle will be used to build a comprehensive model of hydropneumatic suspension strut.
1. Introduction
Suspension based on mechanical solutions with passive elements are some compromises in terms of the criteria of safety and comfort, and price. They are cheap and the main disadvantage is the inability to control the characteristics of mechanical spring.
Hydropneumatic suspension has a key advantage over conventional mechanical suspensions, because it is able to control the road clearance. The clearance value is constant irrespective of the static vehicle load and can be controlled by the driver or automatically (active suspension), depending on the conditions on the road. Another advantage of hydropneumatic suspension is the possibility to choose the optimum geometry of the suspension at the nominal ground clearance as a result of reduced tire wear and ensured optimum illumination of the road by a vehicle. Presented study is one of the areas of research in the broadest sense vibrodiagnostic machines. This area is now widely developed and conducted a lot of research in this area [1-15].
An objective assessment of the characteristic of the shock absorber can be examined on indicator shock absorber test stand. Such an examination can plot the work graph of the shock absorber (force-displacement) and a velocity graph (force- linear velocity) and determine damping characteristics. Determination of the damping characteristics can be achieved in two ways. In the first the basis of designated force-displacement diagram at a constant stroke and variable angular velocity. In the second approach, the angular velocity is constant and is changed the value of the stroke. Forced damping value assuming the maximum linear velocity of the piston at compression and decompression can receive points for the shock absorber damping characteristics. The implementation of the designation of the characteristics of the first and second approach may lead to some discrepancies in the designated characteristics [16].
If the shock absorbers of modern cars, which have asymmetric and nonlinear damping characteristics significantly differ from all the theoretical shape of the ellipse. The forms of loop determined on indicator test stand differ considerable from theoretical elliptic loop describing viscosity dumpers. These differences are connected with many factors: cavitations, valve inertia, oil properties, friction between moving parts and many other. Force versus velocity loops and typical characteristic of twin-tube hydraulic shock absorber currently used is shown in Fig. 1.
In the case of a hydropneumatic column indicator diagram defines the total force of restitution and resistance as a function of displacement. Loading and unloading curves have different waveforms to form the graph hysteresis loop [16-24]. An example of a theoretical hysteresis loop whose shape corresponds to an ellipse in the case of linear damping presented in Fig. 1.
Damping ratio is equal to the ratio of the force which is determined by the intersection graph of the abscissa (point 4 in Fig. 2) to the product the angular frequency and the length of the arm (). By determining the force ( in point 4) damping ratio can be get by relationship:
Fig. 1Force versus velocity and asymmetric and nonlinear shock absorber characteristic
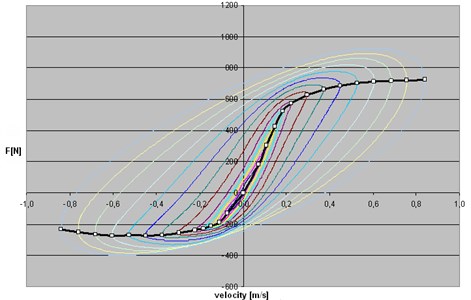
Fig. 2View of theoretical hysteresis loop (force vs. displacement diagram)
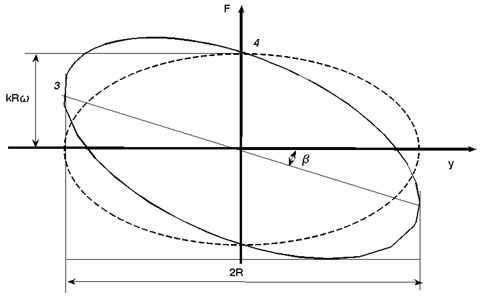
The value of the contractual stiffness is equal to the tangent of the angle of inclination line passing through the origin and the point of contact sheet with lines parallel to the -axis (point 3 in Fig. 2) at the points of maximum stroke (2), hence the contractual stiffness is expressed by the relation:
In the case of loops obtained for hydropeumatic strut their shape often deviate from the shape of the ellipse, due to the asymmetric and non-linear damping characteristics and for other reasons as inertia of valves, cavitations.
2. Hydropneumatic strut
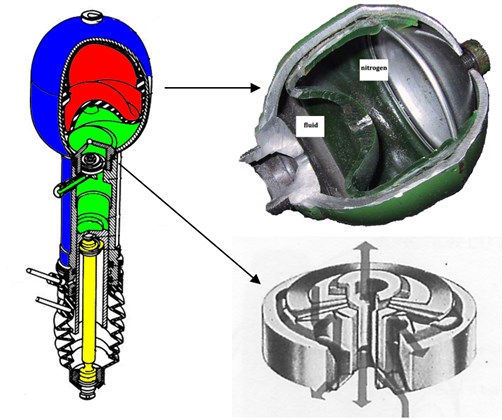
Determining of damping characteristic of hydropneumatic strut is carried out in conjunction with a gas spring (the gas spring is part of hydraulic cylinder) – Fig. 3. In hydropneumatic suspension the role of spring elements takes gas spring with constant mass of gas (nitrogen). Gas and oil are separated by special membrane. Suspension vibration causing changes in the volume and pressure of gas. The fluid flows through the gland – central hole and holes around overshadowed disc springs. This elements plays the role of shock absorber in hydropneumatic strut. Dimensions of central hole and holes around and disc spring characteristic determine the characteristics of hydropneumatic strut.
Fig. 3Hydropneumatic strut, sphere and damper
In the case of hydro-pneumatic suspension static clearance is independent of the load, the full range of spring deflection is equal to the dynamic deflection. So there is no situation to reduce the wheel stroke range with an increase of static load, which allows the use of a gas spring with low coefficients of stiffness ensuring a high comfort, compared to spring rates of coil spring used in the mechanical suspensions.
The hydropneumatic suspension of gas springs are used at a constant gas mass spring, which are defined by two parameters: the nominal pressure and the nominal volume . These two parameters are specified for a state where on membrane does not affect the pressure of fluid. The pressure and volume changes from nominal parameters to static parameters for the static load and required position of the vehicle (Fig. 3).
Fig. 4Hydropneumatic front BX sphere parameters – volume versus pressure (corresponding to static load), (piston area S= 380·10-6 m2; p0= 5,5 MPa; V0= 400·10-6 m3)
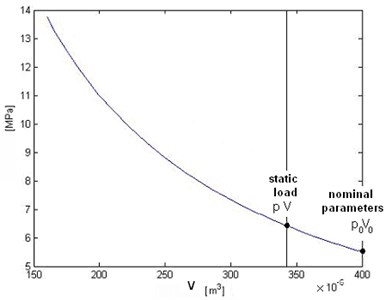
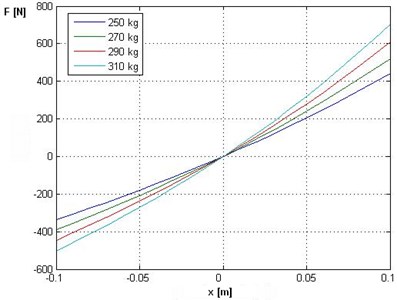
Fig. 5Changes to dynamic forces as a function of displacement suspension for different values of static load
Slow changes in pressure in the sphere when establishing permanent vehicle clearance and achieving static parameters value is the achieved by assumption isothermal transformation (as opposed to dynamic loads which assume polytropy transformation). As regards the dynamic loads occurring in hydropneumatic suspension systems, one should assume that they follow the adiabatic process described by the following expression:
where – polytropic exponent for the adiabatic process of 1.4.
With the increase of static load progression is an increase in the dynamic characteristics of force as a function of displacement (Fig. 5).
The most common changes in technical condition in a vehicle hydropneumatic suspension are LHM fluid leaks and pressure drop in hydropneumatic sphere (diffusion of nitrogen through the membrane material) influence on characteristics of spring element and dumping. Low pressure in hydropneumatic sphere causes the increase of progressive in spring characteristic and decrease of damping force (the pressure loss depends very much on the amount of volume flow through the flow resistor). Due to the design solution (stationary damper fluid flow) defects that element does not exist in practice.
3. Test stand and measurement system
Determining of damping characteristic of hydropneumatic strut is carried out in conjunction with a gas spring, so it is necessary pressurizing of fluid in hyropneumatic strut. For this purpose was used single section hand pump. View of laboratory test stand with build in hydropneumatic strut and hydraulic pump is presented on Fig. 6.
Fig. 6View of laboratory test stand and hydraulic pump
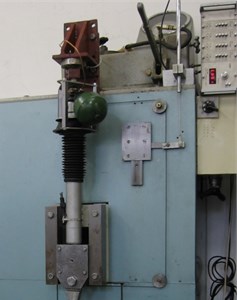
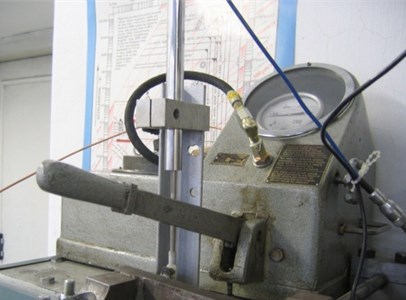
Fig. 7Scheme of measurement system
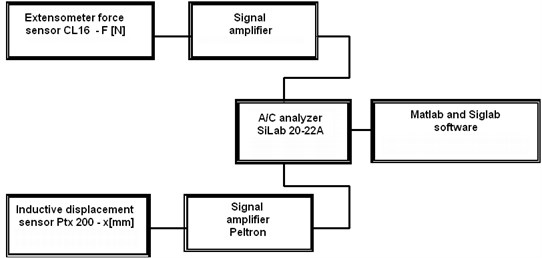
The measurement system used in test is shown on Fig. 7. The force sensor CL 16 and displacement transducer PTx-200 was used to measurement of force and displacement. The analyzer SigLab 20-22 was used to recording signals.
In the case of the force sensor CL 16 accuracy class of 0.5 % is relative to the result of a measurement in the range of 10 % to 100 % range of the sensor. Displacement transducer is characterized by a basic error of 0.5 % of the measuring range. The analyzer SigLab 20-22 overall accuracy: ±0.0025 % of full scale.
4. Methodology of signal processing
After installing the hydropneumatic strut to the test stand, and check the correctness of the assembly process followed warm up of the cold fluid in strut (work for about 60 [s]). After an initial warm-up followed data acquisition were made. The time realization of recorded signal and close loop force vs. displacement are presented on Fig. 8.
Fig. 8Recorded signals a) time realization of displacement (x) – blue line and force (F) – green line, b) close loop force vs. displacement for few cycles
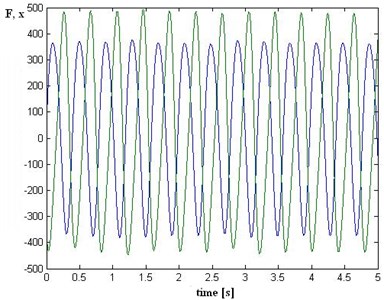
a)
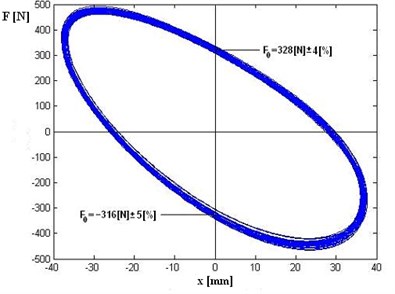
b)
Time realizations imposed for subsequent complete cycles to give the closed loops (force versus displacement diagrams). The next step was determining the average loop and value of the forces for damping characteristics. (The value of force for displacement zero – maximum linear velocity, separately for compression and decompression). Determination of the damping characteristics based on the average value of force in point of maximum velocity is characterized by small uncertainty below 5 %.
Measurements were made for different static pressure (corresponds to static load of vehicle) and for constant stroke 50 mm. The averaged loop of force vs. displacement and force vs. linear velocity are presented on Figs. 9 and 10.
Force vs. displacement (Fig. 9) and force vs. linear velocity (Fig. 10) are average loop determined for maximum linear velocity 0,12 m/s. The diagrams presented influence of static pressure (load) on loop shapes. The shapes of loops are similar but the angle between loop and axis is increases. That corresponds to theoretical hysteresis loop presented on Fig. 1 and to increase of contractual stiffness.
Force vs. displacement (Fig. 11) and force vs. linear velocity (Fig. 12) are average loop determined for maximum linear velocity 0,25 m/s. The shape of loops are similar too but the angle between loop and axis is increase (increase of contractual stiffness). For higher velocity value (0,25 m/s) the shape of loop is more similar to theoretical ellipse shape.
Based on the diagrams above the values of damping forces are determined as the points of intersection the loop and value equal zero (damping force for the piston maximum relative velocity). Based on these points damping characteristics were determined for each static pressure (static load) Fig. 13.
Fig. 9Force versus displacement diagram – different colors correspond to static load of hydropneumatic strut
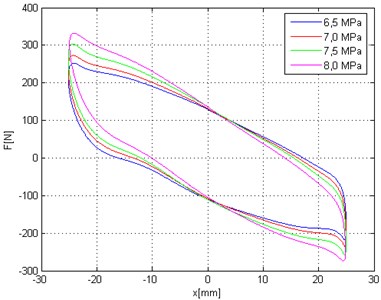
Fig. 10Force versus velocity diagram – different colors correspond to static load of hydropneumatic strut
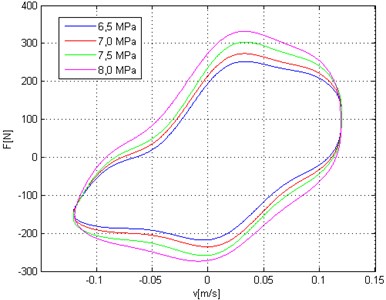
Fig. 11Force versus displacement diagram – different colors correspond to static load of hydropneumatic strut
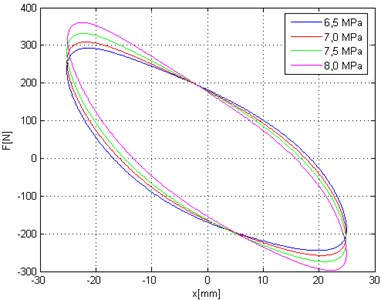
Fig. 12Force versus velocity diagram – different colors correspond to static load of hydropneumatic strut
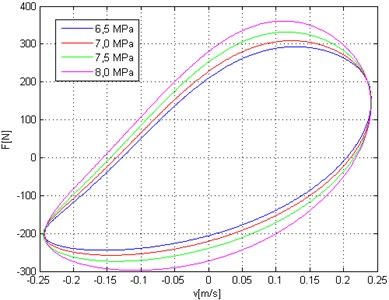
Fig. 13Damping characteristics – different colors correspond to static load of hydropneumatic strut
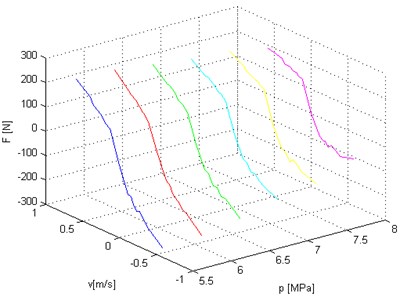
Fig. 14Three dimensional plane of damping plane – force versus velocity and static load of hydropneumatic strut
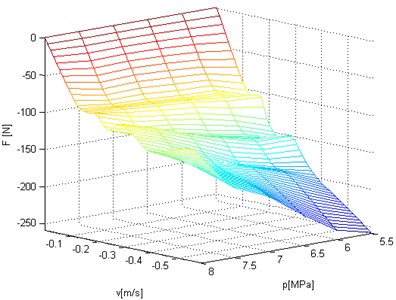
The results was interpolated separately for the compression and decompression and was determined surface of damping as a function of velocity and static pressure. Surface for decompression is presented on Fig. 14.
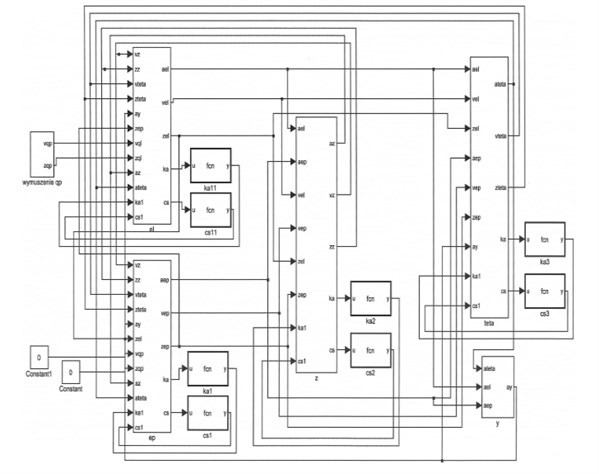
Analysis Fig. 14 and three-dimensional characteristics (Fig. 14) leads to the conclusion that the static load of the vehicle with the hydropneumatic suspension not only affects the stiffness of the springs gas but also causes changes in the damping characteristics. Three-dimensional damping characteristics taking into account the static load of the vehicle will be used in simulation reasech of hydropneumatic suspension strut in the Matalb/Simulink (Fig. 15).
This model in Simulink (5 DOF front McPheson suspension) has five blocks describing generalized coordinates, two blocks describing nonlinear spring characteristics and nonlinear damping characteristics and block describing input function [21].
Fig. 155 DOF front McPherson suspension model in Matlab/Simulink
5. Conclusions
The test results are only part of the tasks performed research of hydropneumatic suspension properties. Designated damping characteristics to allow a simulation research of vehicle model with hydropneumatic suspension. Presented damping characteristics in the form of a surface allow for research within the prescribed range static loads of vehicle. Three-dimensional damping characteristics taking into account the static load of the vehicle allows to build a comprehensive model of hydropneumatic suspension strut in the Matalb/Simulink environment. A similar study for the hydropneumatic suspension strut of the reduced nominal pressure (damage of sphere) will also allow to build a three-dimensional damping characteristics. This allows the simulation research-oriented on vibration diagnostics of the technical condition of the vehicle hydropneumatic suspension.
References
-
Burdzik R., Konieczny Ł., Stanik Z., Folęga P., Smalcerz A., Lisiecki A. Analysis of impact of chosen parameters on the wear of camshaft. Archives of Metallurgy and Materials, Vol. 59, Issue 3, 2014, p. 957-963.
-
Pankiewicz J., Homik W. Examinations of torsional vibration dampers used in reciprocating internal combustion engines. Polish Journal of Environmental Studies, Vol. 20, Issue 5A, 2011, p. 108-111.
-
Pankiewicz J., Deuszkiewicz P., Dziurdź J., Zawisza M. Modeling of powertrain system dynamic behavior with torsional vibration damper. Advanced Materials Research, Vol. 1036, 2014, p. 586-591.
-
Warczek J., Burdzik R., Peruń G. The method for identification of damping coefficient of the trucks suspension. Key Engineering Materials, Vol. 588, 2014, p. 281-289.
-
Dąbrowski D., Batko W., Cioch W. Model of the gears based on multibody system and its validation by application of non-contact methods. Acta Physica Polonica A, Vol. 123, Issue 6, 2013, p. 1016-1019.
-
Kłaczyński M., Wszołek T. Detection and classification of selected noise sources in long-term acoustic climate monitoring. Acta Physica Polonica A, Vol. 121, Issue 1A, 2012 p. 179-182.
-
Dąbrowski Z., Dziurdź J., Klekot G. Studies on propagation of vibroacoustic energy and its influence on structure vibration in a large-size object. Archives of Acoustics, Vol. 32, Issue 2, 2007, p. 231-240.
-
Dąbrowski Z., Deuszkiewicz P. Designing of high-speed machine shafts of carbon composites with highly nonlinear characteristics. Key Engineering Materials, Vol. 490, 2011, p. 76-82.
-
Ragulskis K., Kanapeckas K., Jonušas R., Juzėnas K. Applications of torsional vibrations for vibro-driling operations. Mechanika, Vol. 17, Issue 5, 2011, p. 498-502.
-
Folęga P., Siwiec G. Numerical analysis of selected materials for flexsplines. Archives of Metallurgy and Materials, Vol. 57, Issue 1, 2014, p. 185-191.
-
Paś J., Duer S. Determination of the impact indicators of electromagnetic interferences on computer information systems. Neural Computing and Applications, Vol. 23, Issue 7-8, 2013, p. 2143-2157.
-
Figlus T., Wilk A., Madej H., Łazarz B. Investigation of gearbox vibroactivity with theuse of vibration and acoustic pressure start-up characteristics. Archive of Mechanical Engineering, Vol. 58, Issue 2, 2011, p. 209-221.
-
Dąbrowski Z., Zawisza M. Investigations of the vibroacoustic signals sensitivity to mechanical defects not recognised by the obd system in diesel engines. Mechatronic Systems, Mechanics and Materials, Solid State Phenomena, Vol. 180, 2012, p. 194-199.
-
Wierzbicki S. Laboratory control and measurement system of a dual-fuel compression ignition combustion engine operating in a cogeneration system. Solid State Phenomena, Vol. 210, 2014, p. 200-205.
-
Siergiejczyk M., Rosinski A. analysis of power supply maintenance in transport telematics system. Mechatronic Systems, Mechanics and Materials II, Solid State Phenomena, Vol. 210, 2014, p. 14-19.
-
Konieczny Ł., Burdzik R., Warczek J. Determinations of shock absorber damping characteristics taking stroke value into consideration account. Diagnostyka, Vol. 55, Issue 3, 2010, p. 51-54.
-
Konieczny Ł.,Burdzik R., Figlus T. The possibility to control and adjust the suspensions of vehicles. Activities of Transport Telematics, Vol. 395, p. 378-383.
-
Czop P., Sławik D., Włodarczyk T. H., Wojtyczka, M., Wszołek G. Six Sigma methodology applied to minimizing damping lag in hydraulic shock absorbers. Journal of Achievements in Materials and Manufacturing Engineering, Vol. 49, Issue 2, 2011, p. 243-250.
-
Dixon J. C. The Shock Absorber Handbook. Society of Automotive Engineers Inc., Warrendale, PA, 1999.
-
Bauer W. Hydropneumatic Suspension Systems. Springer Heidelberg Dordrecht, London, New York, 2011.
-
Konieczny Ł., Gardulski J. Application of simulation researches in diagnostic’s of vehicle hydropneumatic suspension. Transport Problems, Vol. 2, Issue 1, 2007, p. 13-21.
-
Burdzik R., Konieczny Ł. Vibration issues in passengers car. Transport Problems, Vol. 9, Issue 3, 2014, p. 83-90.
-
Konieczny Ł., Burdzik R. Comparison of characteristics of the components used in mechanical and non-conventional automotive suspensions. Mechatronic Systems, Mechanics and Materials II, Solid State Phenomena, Vol. 210, 2014, p. 26-31.
-
Konieczny Ł. The statistical analysis of damping parameters of hydraulic shock absorbers. Diagnostyka, Vol. 15, Issue 1, 2014, p. 49-52.
About this article

