Abstract
In this paper an experimental investigation is performed on a range of transverse gap ratios () between the cylinders arranged in side by side configuration. The pattern of the test cylinder motion, spectral diagram and amplitude are used to analyze the vibration excitation at different conditions such as free stream velocity, natural frequency of the test cylinder. From the results, for the spacing ratio of 0.5 it is observed that the cylinders gets excited beyond the critical velocity and vibrates in a spiral pattern with the line dominated spectrum, which implies that by having a similar frequency along with a phase shift, the characteristics behavior of the cylinder is observed to be like an oscillator with the cross wise and stream wise response. Besides that, it is also observed that the cylinders at higher spacing ratios ( 4.5) producing minimum oscillation when compared to the smaller spacing ratios.
1. Introduction
In the recent years, the investigation on fluid flow field characteristics has considerably increased in different fields of applications. The vibration developed by the fluid flow can be categorized according to the nature of interaction between the fluids and structure. Besides that the fluid-flow is generally classified into three categories, i.e. free shear flow, internal and external. The current study is about the flow induced vibration due to the external flow of fluid over the bluff bodies i.e. square cylinders. Basically the relationship among fluids and the structures is of more complicated phenomenon to study. D. Shiels et al., [1] observed that the FIV of an elastically constrained 2-D circular cylinder has become a major problem in studying the interaction between the fluids and structures. On behalf of these problems, L. Cheng, Y. Zhou [2] suggested a novel surface perturbation technique to organize the factors/parameters which are involved in the fluid-structure interactions such as vortex shedding, flow-induced vibrations and vortex-induced noises. From the view of various researchers, some possible sources for the FIV and its analyzing techniques are stated below. The flow induced vibration is developed due to an alternating low-pressure caused by the vortex shedding in the rear of a submerged cylinder, Hyun-Boo Lee, et al. [3]. From the studies of M. J. Pettigrew et al. [4], it was recognized that the occurrences of vibration induced in the tube bundles by the cross flow is mainly due to the fluid elastic instability. Ajith Kumar R. and Gowda B. H. L. [5], Korkischko I., and Meneghini J. R. [6] recommended that the total number of cylinders and its arrangements was one of the parameters which had significant impact on the induced vibration due to fluid flow. H. S. Kang et al., [7], proposed an axial-flow-induced vibration model to evaluate the sensitivity to spring stiffness on the FIV of the bluff bodies. The significant parameters of the heat exchangers to withstand the FIV are damping, mass per unit length, mass ratio, etc. which must be significantly evaluated at the stage of designing, H. Gelbe et al., [8]. J. K. Ostanek and K. A. Thole [9] investigated the near wake flow developed through the arrays of staggered pin fins in a heat exchanger. Y. Zhou [10] experimentally investigated the flow behind three side-by-side circular cylinders using different techniques, including Particle Image Velocimetry, Hot-Wire Anemometry, Laser-Illuminated Flow Visualization and Laser Doppler Anemometry. Biswas and Ahamed, [11], investigated the self-excited lateral vibration of a pipe due to an internal fluid flow and applied an integral minimum principle of Pontryagin to analyze the optimum flow velocity for lesser pipe vibration i.e. to maximize the fluid transport efficiency whereas, it is important to maximize the flow velocity while minimizing the lateral vibration of the pipe. L. Perotin and S. Granger [12], stated that the dynamic behavior of the tube equipped with all the linear and non-linear supports, deduced from an identified turbulent excitation, which provides a highly satisfactory validation for the regularized inverse identification process. Sang-Nyung Kim, and Yeon-Sik Cho [13], applied a mode frequency analysis, subroutine of Structural Routine in ANSYS, to carry out the analysis of the natural frequency and relative amplitude of the tube. B. A. Jubran et al., [14], applied the newly developed joint time-frequency analysis techniques (JTFA) and in particular, the modulated Gaussian wavelet to identify the characteristics of the FIV of an elastically mounted single cylinder subjected to cross flow. Kumar R. A. et al., [15] analyzed the flow-induced oscillations of a square section cylinder under interference conditions using a data-mining tool called ‘decision tree’. Wu W. et al., [16] investigated the high-frequency perturbation effects on the performance, to suppress the FIV in the bluff bodies. Baranyi L., [17] stated that the experimental and numerical analysis were much better methods, to study the near-wake structure of bluff bodies rather than using the theoretical approach. Besides the study on circular cylinders under different conditions, the investigations of flow characteristics around the square cylinders/structures were also important phenomena. Some of the investigations performed on square cylinders as follows, kolar et al. [18] performed a phase averaging along with investigating the influence of vortices near the gap and at the outer shear layers on a set of square cylinders by employing the 2- component laser Doppler velocimetry at the Reynolds number of 23100 and 2. In turn, Agarwal et al. [19] performed the numerical study on fluid flow over the square cylinders for the Reynolds number of 73, by employing linear stochastic estimation technique, whereas it is observed that the configuration of in-phase and anti phase are occurs in the flip flop regime with equal probabilities. In the present study, it is intended to study the flow induced vibration excitation in an elastically mounted square cylinders in the cross flow direction. The emphases of the study are the effects of the transverse spacing between the two cylinders and the natural frequency of the test cylinder with respect to the vibration excitation in the cylinder. Regarding this, the motion, spectra and amplitude response of the cylinder were obtained along with measurement of test cylinder vibration in cross flow () and stream wise () directions.
2. Experimental methods and materials
The experimental investigations were performed in an open type low turbulence (0.1 % turbulence intensity) wind tunnel. The wind tunnel has test section of 0.3 m×0.3 m×1.0 m, with a maximum wind speed up to 75 m/s and the temperature of the fluid flow was at 23°C. In turn, prior to the 9:1 contraction a layer of honeycomb and some screens were installed to reduce the turbulence. At the opening of the test section, a pitot tube was equipped to monitor the inlet fluid flow velocity. The Reynolds number based on the inlet flow velocity and the diameter of the test cylinder is 1.6×10⁴. The flow velocity distribution without considering the boundary layer in the test section area is found to be even within 1.2 %. The section models tested were hollow square copper tubes of 16 mm×16 mm with a span length of 150 mm were used as a test cylinders at different transverse gap ratios on a range of (0.5 4.5). To visualize the fluid flow around the test cylinder surface, a smoke generator with a small orifice was placed at a half a diameter of the cylinder distance in the upstream condition. The orifice of the smoke generator was located at the mid-span of the cylinders and about the similar height of the cylinder axis in mid-span. As shown in the Fig. 1, two accelerometers are equipped at the top edge and bottom edge of the respective test cylinders. Whereas in the present study, the natural frequency of the surrounding cylinders were fixed at 25 Hz and the natural frequency of the test cylinder was set at 12.5 Hz (=), 18.75 Hz (=), 25 Hz, and 31.25 Hz (=) for tests with different natural frequencies.
Fig. 1A typical sketch of wind tunnel test equipment
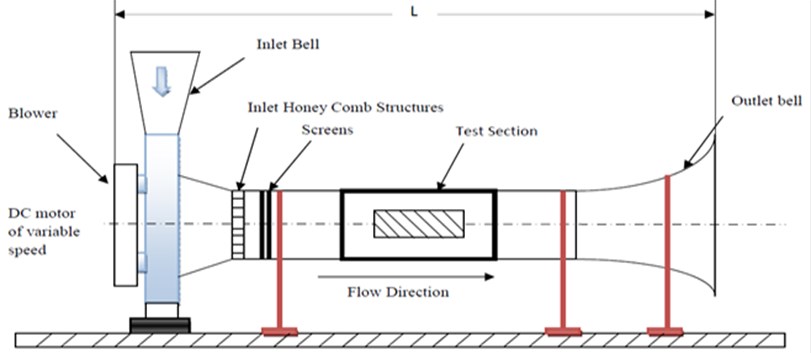
Fig. 2A sketch of elastically mounted square cylinders in cross-flow along with the data acquisition and signal measurement setup
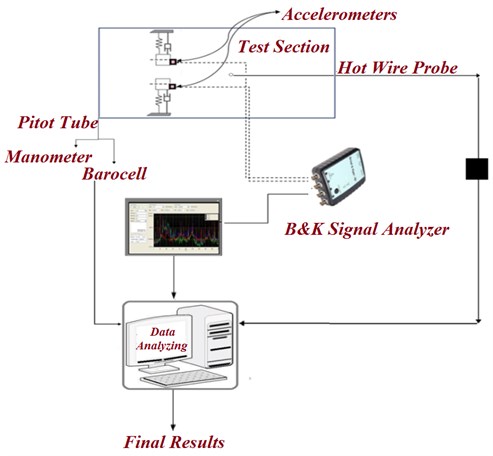
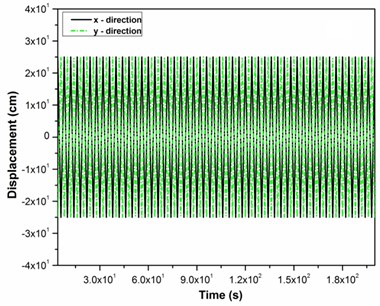
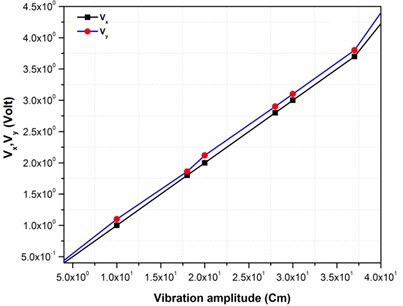
The instrumentation set up includes two accelerometers manufactured by B&K having sensitivity of 100 mV/sec-2 with the frequency response up to 0.3-8 kHz. The two accelerometers were installed at the each edge of test cylinders. The orientation of the accelerometers were adjusted according to their sensitive with respect to the tube vibration in the stream wise () and cross flow () direction respectively. Further the observed output from each accelerometer was analyzed by employing a B&K 2 channels dynamic signal analyzer as shown in the Fig. 2. The obtained and displacement signals were digitized simultaneously at a sampling rate of 192 K samples/sec by a 24 bit ADC, whereas the B&K signal analyzer is connected to a PC computer to store the data for further processing and to monitor the amplitude spectra of the test cylinder during the experimental investigation. Prior to measuring the vibration excitation in the test cylinder, the voltage outputs from the data acquisition and signal analyzer system is calibrated in opposition to the vibration amplitudes. While calibration, two accelerometers were placed at each edge of the test cylinder. Further, a idiosyncratic time series of displacements in the stream wise () and cross flow () direction are shown in Fig. 3(a). The amplitudes with respect to the sinusoidal output voltages for the stream wise () and cross flow () directions were observed and then plotted in opposition to the vibration amplitude. As shown in Fig. 3(b), the calibration data for both the stream wise () and cross flow () directions are fixed to a straight line , where represent the vibration amplitude and represents the voltage output. Curve-fitting gives the values of the coefficients, 0.13 and 0.007. It is thus shown that the voltage outputs can linearly represent the vibration amplitudes in the experimental range. To distinguish the enormity of the test cylinder vibration, the real mean square value with respect to the vibration amplitude () is expressed in a dimensionless form as:
where the diameter of the cylinder is represented as , rms values of the cylinder displacement in and direction is represented as and respectively. The cylinder displacements were observed by digitizing the yield voltages observed from the measurement system which transforms the cylinder displacement into voltage signal. Whereas, the fine accuracy of the vibration measurement and data acquisition system resulting in causing uncertainties in the measurement of displacement of the cylinders in and direction. Further the basic parameters for the experimental analysis are summarized in the Table 1.
Fig. 3a) Displacement in x and y direction, b) output voltage Vx and Vy versus vibration amplitude in x and y direction
a)
b)
Table 1Basic parameters such as, natural frequency, mass damping and damping factor with respect to the different test case
S. No | ||||
1 | 25 | 3.75±0.03 | 0.00895±0.0004 | 0.19±0.008 |
2 | 12.5 | 3.75±0.03 | 0.00943±0.0003 | 0.22±0.007 |
3 | 18.75 | 3.75±0.03 | 0.01058±0.0005 | 0.23±0.005 |
4 | 31.25 | 3.75±0.03 | 0.00968±0.0002 | 0.21±0.006 |
3. Result and discussion
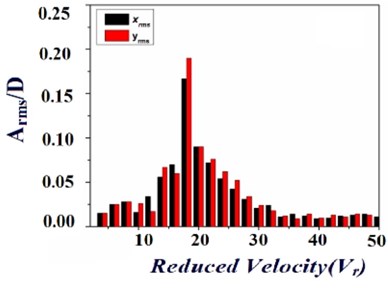
In the current study, it is intended to study the flow induced vibration excitation in two identical elastically mounted square cylinders in the cross flow direction. The emphases of the study are the effects of the transverse spacing ratio and the natural frequency of the test cylinder with respect to the vibration excitation in the cylinder. Regarding this, the motion, spectra and amplitude response of the cylinder were obtained along with measurement of cylinder vibration in cross flow () and stream wise () directions, which were briefly discussed in the following section. To identify the vibration excitation of an elastically mounted square cylinders at different spacing conditions, Fig. 4(a)-(e) reveals the amplitude response of the test cylinder at five different cases with respect to the transverse spacing ratio, respectively. From the Fig. 4(a)-(e) it is observed that, the vibration excitation of the test cylinder in stream wise direction and lateral direction were represented as two bars, which shows that each bars having similar pattern with respect to increase in the fluid flow velocity. The observed vibration excitation of the test cylinder at different configuration is gradually increases with the increases in the fluid flow velocity, after reaching a critical flow velocity the peak amplitude starts to gradually decreasing. Apart from that, less-amplitude vibrations could be endorsed for the turbulence, in view of that the monitored region in the wake of the upstream cylinders. Due to the presence of fluid elastic instability, the gradual increase in the vibration excitation of the test cylinder was occurred. Whereas the severe vibration excitation of the test cylinder at the critical fluid flow velocity were briefly discussed as follows, the fluid has enormous energy when the flow velocity is high enough to excite the test cylinder to vibrate in certain amplitude with respect to the natural frequency.
As a result of the fluid flow characteristics, the vibration excitation is amplified and consequently a severe vibration excitation is observed. Among all the cases observed, the vibration excitation of the test cylinder is about nearly compromised for the spacing ratio of 4.5, shown in the Fig. 4(e). The main reason behind the reduced vibration excitation for the above case is due to the less vortex shedding and also the flow field is properly distributed. Apart from this, the cylinders at other spacing ratio were observed to be producing high vibration excitation. Besides that similar power spectra were observed despite of the inlet fluid flow velocity once the velocity is highly sufficient. Whereas the observed velocity spectra certainly exhibits four different peaks, in which the highest peak were developed only at natural frequency (25 Hz), which indicates that the fluid flow oscillates with respect to the natural frequency of the cylinders. The vibration excitation frequency is certainly not related to the vortex shedding frequency with respect to fluid flow. Whereas due to the dissimilarity in the natural frequency and vortex shedding frequency, large vibration excitation in the test cylinder due to the instability in the induced vortices. Consequently the vibration excitation in the test cylinder is because of the fluid elastic instability, based on the behavior of the vibration excitation of the test cylinders shown in the Fig. 4; it is observed that the vibration amplitude increases gradually with respect to the increase in the fluid flow velocity. While the vibration excitation amplitude is generally a peak, or multiple peaks if vibrations occurs at sub as well as super harmonics of the vortex shedding frequency (Blevins [20]). Further the fluid flow and the test cylinder excites dominantly with respect to the natural frequency, approximately self-sufficient of the inlet fluid flow velocity, the resonance of the test cylinder through the coupling of the fluid is obvious for the case that all the cylinders having similar natural frequency. Consecutively before shaping the critical velocity with respect to the amplitude response, the velocity vs. amplitude curve should be analyzed to identify presence of hysteresis. Regarding this, the vibration excitation of the test cylinder in and direction is investigated with respect to fluid flow velocity increasing from zero to 40 m/s. There is no evident hysteresis was observed for all the cases in the experimental investigation array. The resonance among the test cylinder at different conditions is improved, which shows that cylinder vibrates at all conditions with respect to similar natural frequency. Whereas a significant vibration excitation of the test cylinder is observed for case I is shown in the Fig. 4(a), (b), it is mainly due to occurrence of vortex shedding behind the test cylinder with respect to the minimal spacing between the cylinders. Consecutively for the case V (Fig. 4(e)) it is observed that a considerable suppression in the vibration excitation of the test cylinder when comparing with the results observed from other cases/conditions. In summing up, while all the cylinders having same similar natural frequency the cylinders in the upstream conditions plays an important role in the suppression of vibration excitation in the test cylinder; furthermore support the instability by forming a space flow impinging in the test cylinder, or improve the vibration excitation in the test cylinder through an enhanced fluid coupling by employing more cylinders in the upstream. Whereas the cylinders in the downstream condition, having smaller involvement in the suppression of vibration excitation in the nearby arrangement.
Fig. 4Vibration excitation (xrms and yrms) of the elastically mounted square cylinder at different test condition
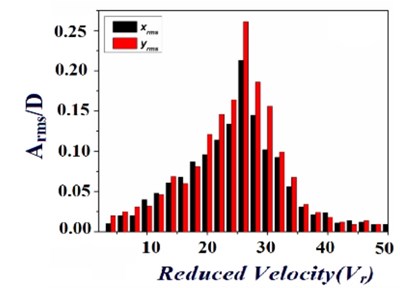
a) 0.5
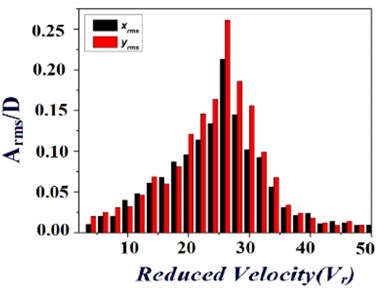
b) 1.5
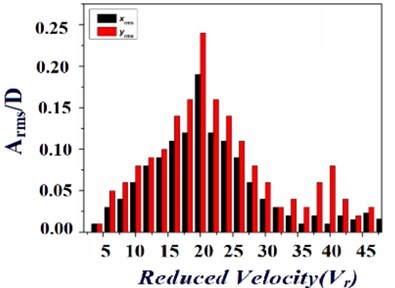
c) 2.5
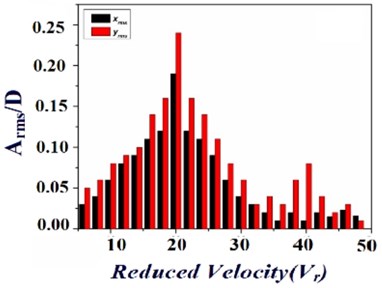
d) 3.5
e) 4.5
3.1. Behaviour of the elastically mounted square cylinders at different test conditions
The vibration characteristic of the test cylinder is further tacit by examining the cylinder motion in the fluid flow field. Fig. 5 reveals the motion of the test cylinder investigated at five different cases. Among the five cases investigated, the cylinder at minimal spacing ratios exhibiting a higher vibration excitation it is mainly due to the vortex shedding developed. Whereas the motion of the test cylinder for the case I, where the test cylinders arranged in the spacing ratio of 0.5 shows a spiral pattern shown in the Fig. 6 similarly the results observed for the case II, III and IV have less significant importance in the reduction of vibration excitation in the test cylinder, the flow pattern of the respective cases were shown in the Fig. 6 Further it is observed that a minimal vibration excitation in the flow pattern for the test cylinder at case V, which is mainly due to the presence test cylinders at optimal spacing conditions.
Fig. 5Motion of the test cylinder at different cases

a) Cace I, 0.5

b) Cace II, 1.5

c) Cace III, 2.5

d) Cace IV, 3.5

e) Cace V, 4.5
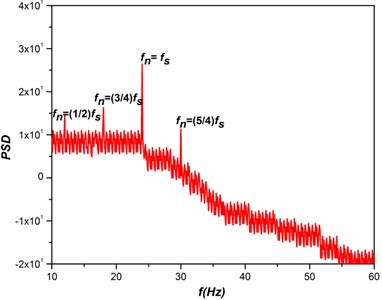
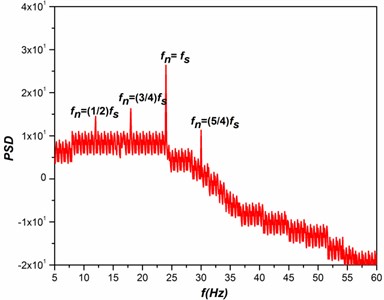
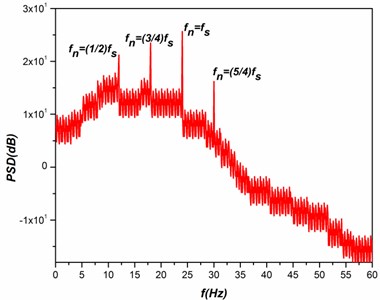
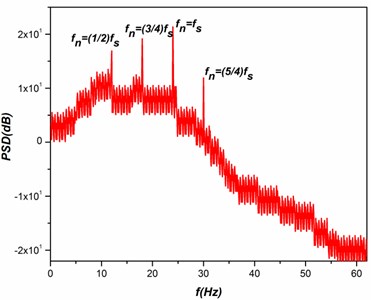
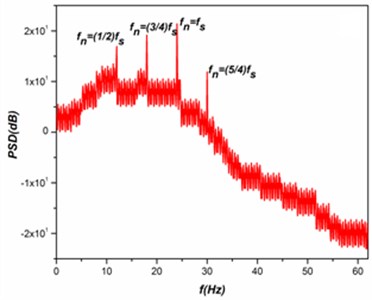
Fig. 6Spectral response with respect to test cylinder vibration
a)
b)
c)
d)
e)
3.2. Origination of turbulence and spectral response of the elastically mounted square cylinders
The important cause for the turbulence is due to the presence of distinctive frequencies by non-linear interactions of the fluids and structures, which can result in a smooth turbulent spectrum. A system of instability in the secondary fluid flow is due to the origination of turbulence as a result of the instability in the primary fluid flow to minimum level of disturbances. Considering the regions of the higher-amplitudes in the primary wave and the developement of secondary instability in the instantaneous velocity distributions have the articulation points all along in the normal and spanwise directions; such profiles were inviscidly unstable at higher frequencies. When an unsteady fluid flow past the test cylinders resulting in the formation of irregular vortices, which were further interacts with each other leads to the developement of vortex shedding. The shedding of vortices in and around the test cylinder causes a drastic changes in the aerodynamic coefficients (Drag and Lift) of the test cylinders. The drastic change in the aerodynamic coefficients due to the vortex shedding is the major cause for the induced vibration in the test cylinder. In the present study a Fast Fourier Transform (FFT) analysis is performed on the lift coefficient of the test cylinders to identify vibration excitation frequency. The spectral response with respect to test cylinder vibration frequency is shown in the Fig. 6, where it reveals that for all cases tested, the maximum excitation were occurred with respect to the natural frequency (25 Hz) of the test cylinder. Apart from that it is also observed that a slight excitation in the power spectrum with respect other nominal frequencies such as 12.5 Hz (=), 18.75 Hz (=), and 31.25 Hz (=). When comparing the observed power spectrum at different cases, the vibration excitation of the test cylinder is mostly depend upon two most important components such as and . Where represents the natural frequency and represents the frequency of the neighboring cylinder for different cases which were clearly shown in the Fig. 6. Further it is also observed that a higher spectral excitation is presence in the case of 0.5 with respect to the cylinder vibration, it is mainly because of the close presence of the cylinders. As a result of that the spectral peaks for different cases reveal that the vibration of any structures is mainly depends upon their natural frequency and the frequency of the adjacent structures. At 4.5, a smallest spectral excitation with respect to the cylinder vibration at its natural frequency, similarly a little excitement in the spectral peaks with respect to the frequencies of the adjacent cylinder. Whereas the higher cylinder frequency (31.25 Hz (=)) has no noteworthy effect in the vibration excitation due to the inflexibility of the test cylinders.
4. Conclusions
The flow induced vibration excitation of the elastically mounted square cylinder at different transverse spacing ratio is experimentally investigated. From the observed results of the amplitude response, reveals that the cylinders at 4.5 having a significant play in reducing the vibration excitation. Whereas the cylinders at minimal spacing conditions were also exhibiting a less significant effect in the vibration excitation, this is mainly due to creation vortices and the shedding of vortices. Apart from that, it also illustrates that the movement of the test cylinder response have a same frequency along with a phase shift for the flow in the region of critical velocity. The inconsistency of natural frequencies between the test cylinders is not an aspect to decide the critical velocity. However the vibration amplitude of the cylinder above the critical velocity depends on the natural frequency and the instability in the natural frequencies of the test cylinder. The vibration excitation observed at the higher cylinder frequency (30 Hz (=)) has no momentous importance due to the stiffness of the test cylinder.
Prominent inconsistence in the natural frequency reduces the vibration excitation in the test cylinder because of the lack of resonance among the adjacent. Apart from that, the power spectrum shows that the vibration excitation of the test cylinder due to the induced flow of fluid observed initially at its natural frequency in the region of the beginning of the fluid elastic instability. As the velocity of the fluid is increased, the vibration in the test cylinder is observed with respect to its frequency and the frequencies of the adjacent cylinders through the fluid flow grouping. When the test cylinder and the adjacent cylinders having related natural frequency (), which results in the tremendously ordered oscillatory motion of the test cylinder is observed. Which were evidently proved by the major spectra with spectral peaks in the harmonics of and . From the above results, it is clearly identified that the spacing between the two structures playing a vital role in the reduction of vibration excitation in the structures; it is applicable for the square shaped prismatic structures in the practical situation such as flow around the tube bundles of the heat exchangers, flow past the chimney stacks, offshore structures, etc; for all the applications mentioned above having a compact arrangement of different structures.
References
-
Shiels D., Leonard A., Roshko A. Flow-induced vibration of a circular cylinder at limiting structural parameters. Journal of Fluids and Structures, Vol. 15, 2001, p. 3-21.
-
Cheng L., Zhou Y. Surface perturbation technique for flow-induced vibration and noise control. Journal of Sound and Vibration, Vol. 310, 2008, p. 527-540.
-
Hyun-Boo Lee, Tae-Rin Lee, Yoon-Suk Chang Numerical simulation of flow-induced bidirectional oscillations. Journal of Fluids and Structures, Vol. 37, 2013, p. 220-231.
-
Pettigrew M. J., Taylor C. E., Fisher N. J., Yetisir M., Smith B. A. W. Flow-induced vibration: recent findings and open questions. Nuclear Engineering and Design, Vol. 185, 1998, p. 249-276.
-
Ajith Kumar R., Gowda B. H. L. Flow-induced vibration of a square cylinder without and with interference. Journal of Fluids and Structures, Vol. 22, 2006, p. 345-369.
-
Korkischko I., Meneghini J. R. Experimental investigation of flow-induced vibration on isolated and tandem circular cylinders fitted with strakes. Journal of Fluids and Structures, Vol. 26, 2010, p. 611-625.
-
Kang H. S., Song K. N., Kim H. K., Yoon K. H. Axial-flow-induced vibration for a rod supported by translational springs at both ends. Nuclear Engineering and Design, Vol. 220, 2003, p. 83-90.
-
Gelbe H., Jahr M., Schroder K. Flow-induced vibrations in heat exchanger tube bundles. Chemical Engineering and Processing, Vol. 34, 1995, p. 289-298.
-
Ostanek J. K., Thole K. A. Wake development in staggered short cylinder arrays within a channel. Experiments in Fluids, Vol. 53, 2012, p. 673-697.
-
Zhou Y. Vortical structures behind three side-by-side cylinders. Experiments in Fluids, Vol. 34, 2003, p. 68-76.
-
Biswas Saroj K., Ahmed N. U. Optimal control of flow-induced vibration of pipeline. Dynamics and Control, Vol. 11, 2001, p. 187-201.
-
Perotin L., Granger S. An inverse method for the identification of a distributed random excitation acting on a vibrating structure part 2: flow-induced vibration application. Mechanical Systems and Signal Processing, Vol. 13, Issue 1, 1999, p. 67-81.
-
Sang-Nyung Kim, Yeon-Sik Cho The analysis of flow-induced vibration and design improvement in KSNP steam generators of UCN #5, 6”. KSME International Journal, Vol. 18, Issue 1, 2004, p. 74-81.
-
Jubran B. A., Hamdan M. N., Shabaneh N. H. Wavelet and chaos analysis of flow induced vibration of a single cylinder in cross-flow. International Journal of Engineering Science, Vol. 36, 1998, p. 843-864.
-
Ajith Kumar R., Sugumaran V., Gowda B. H. L.,Sohn C. H. Decision tree: A very useful tool in analyzing flow-induced vibration data. Mechanical Systems and Signal Processing, Vol. 22, 2008, p. 202-216.
-
Wu W., Yuan J., Cheng L. Multi-high-frequency Perturbation effects on flow-induced vibration control. Journal of Sound and Vibration, Vol. 305, 2007, p. 226-242.
-
Baranyi L. Numerical simulation of flow around an orbiting cylinder at different ellipticity values. Journal of Fluids and Structures, Vol. 24, 2008, p. 883-906.
-
Kolar V., Lyn D. A., Rodi W. Ensemble-averaged measurements in the turbulent near wake of two side-by-side square cylinders. Journal of Fluid Mechanics, Vol. 346, 1997, p. 201-237.
-
Agrawal A., Djenidi L., Antonia R. A. Investigation of flow around of a pair of side-by-side square cylinders using the lattice Boltzmann method. Computers and Fluids, Vol. 35, 2006, p. 1093-1107.
-
Blevins R. D. Flow – Induced Vibration. Second ed., Van Nostrand Reinhold, New York, 1990.
About this article

Authors gratefully acknowledge the support of research grant (No. SB/FTP/ETA-389/2012) awarded by the Department of Science and Technology (DST), Government of India.
