Abstract
The car body’s noise transfer function reflects the acoustic characteristics between the car body structure and interior cavity, which has an important influence on the noise control in the driver’s cab. In this paper, the finite element models of the car body structure, car interior cavity and acoustic-structure coupling were built based on the car body acoustic-structure coupling of the car and the theory of noise transfer function, and car body’s noise transfer function from the excitation position to the driver’s ears was calculated. The mathematical model for optimization of the car interior structure noise was built with the root-mean-square value of the sound pressure level response at the interior reference point as the objective function, and the first-order torsional modal frequency and the overall car body mass as the constraint conditions. To reduce the optimization burdens, the design space of the variables was sampled by means of orthogonal experimental design during the optimization process, and the Radial Basis Function (RBF) models of the root-mean-square value of the sound pressure level response of the noise at the driver’s ears and first-order torsional modal frequency were built to replace the finite element models. Finally, the optimization scheme of the car body’s noise transfer function was acquired by means of Particle Swarm Optimization (PSO). The results show that the sound pressure peak within in the frequency band reduces by 2.35 dB after optimization. Meanwhile, the response curves of the noise at the driver’s ears before and after optimization were acquired by substituting the optimization scheme into the finite element model of acoustic-structure coupling. Compared with the predicted results of RBF model, the relative error of the optimized root-mean-square value of the sound pressure in the accurate model is only 0.18 %, which manifests the feasibility of the optimization scheme.
1. Introduction
With the car market becoming mature with each passing day, people have an increasing high requirement on the quality of cars. Noise, vibration and comfort which are increasingly emphasized by consumers have become the factors that consumers consider when they buy cars. Human body’s level of sensitivity to noise is related to noise frequency. Low-frequency noise, particularly in the range of 20 Hz-180 Hz has a remarkable adverse effect on human body. The structural noise transmission mainly concentrates in the middle and low frequency bands, while the conventional sound absorption and noise reducing measures in this frequency band often have little effects. Therefore, it’s necessary to effectively optimize car body’s Noise Transfer Function (NTF) which reflects the important noise transmission characteristics of the car structure, so as to reduce and improve the low-frequency structural noise caused by vibration to the greatest extent.
In the past, the noise performance was mainly controlled by experimental means in the early stage of car development [1-3]. Nowadays, it is mainly controlled on the basis of CAE analysis or verification of the two [4-7]. The car interior structure noise is the arithmetic product of the excitation and noise transfer function. Under certain excitation conditions, the car interior structure noise can be effectively reduced by reducing noise transfer function. Therefore, NTF becomes the indicator for CAE to carry out noise control. The car body’s noise transfer function reflects the acoustic characteristics between the car body and the interior cavity. Therefore, optimizing it can achieve the objective of controlling the automotive interior structure-borne noise. It is widely applied in vehicle analysis and design in terms of analysis on the noise source, transfer path, and target control etc [8-9].
In this paper, the finite element models of the car body structure, car interior cavity and acoustic-structure coupling were built based on the car body acoustic-structure coupling of the car and the theory of noise transfer function, and car body’s noise transfer function from the excitation position to the driver’s ears was calculated. The mathematical model for optimization of the car interior structure noise was built with the root-mean-square value of the sound pressure level response at the interior reference point as the objective function, and the first-order torsional modal frequency and the overall car body mass as the constraint conditions. To reduce the optimization burdens, the design space of the variables was sampled by means of orthogonal experimental design during the optimization process, and the Radial Basis Function (RBF) models of the root-mean-square value of the sound pressure level response of the noise at the driver’s ears and first-order torsional modal frequency were built to replace the finite element models. Finally, the optimization scheme of the car body’s noise transfer function was acquired by means of Particle Swarm Optimization (PSO). The method in this paper provides important guidance and reference for the optimization design of car NVH performances.
2. Calculations and analysis on noise transfer function
2.1. The verification of finite element model for BIW
The car body has a large and complex structure. Before starting the numerical simulation, it’s necessary to test out the experimental modal first. Through the comparison with the simulation modal, the reliability of the simulation model can be verified. After that, the follow-up studies can continue.
Before establishing the test bench, the plan to test the modal must be determined first, including three sub-plans shown below:
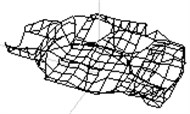
1) The suspension mode. A suspension system has been designed. Some rubber ropes which have greater flexibility were chose to hang the BIW to simulate its free state. The suspension points should be selected to minimize the negative impacts that this suspension system had on the test results. Therefore, the connection points of the front and rear suspension and the car body were chose as suspension points, shown in Fig. 1.
Fig. 1The suspension mode of BIW
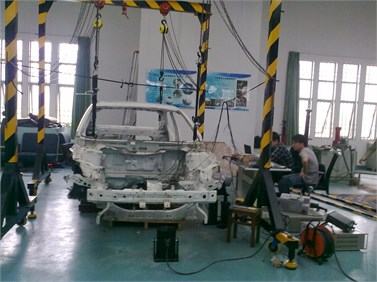
2) The incentive mode. There were several rules to follow when choosing the incentive point position: In order to ensure the reliability of test results, suspension points and the modal shape node should not be incentivized. The incentives should be given on points which have greater rigidity. In that case, the incentive point in this experiment was chose to be near the left front suspension; the incentive direction is vertical.
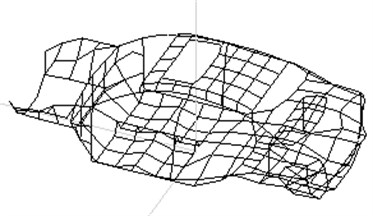
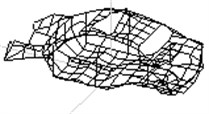
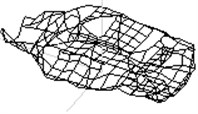
3) The test points. The test points should be arranged to reflect the whole contour of the car as good as possible. More test points should be arranged in the areas that were sensitive or request more attention. In this experiment, there were 262 test points altogether, shown in Fig. 2.
Fig. 2Geometric measuring point model of BIW
After ensuring the correction of all the test conditions, the frequency response function of this structure can be tested out. The top 6 rigid modal of BIW can be fitted out, based on that function.
During the solving process for the finite elements, the calculation precision will be improved with the increase of the fining degree of the meshes. However, when the mesh density reaches certain degree, the precision will increase slowly with the increase of the fining degree of the meshes, but the calculation time increases sharply. Therefore, selecting proper mesh fining degree is the key to ensuring the economical efficiency of the calculation. In addition, the system is often insensitive to some non-critical parts and structures. To reduce the scale of the model, the small-sized structures and non-critical parts (for instance, small holes, flange, openings, small lug boss, chamfering and additional parts) in the car body structure were properly simplified, and the concerned parts were retained without simplification or subject to little simplification.
Table 1Top 6 modal parameters of BIW
Order | Experiment results / Hz | Simulation results / Hz | Relative error | Mode description |
1 | 28.93 | 29.41 | 1.66 % | Whole car body one order reversing |
2 | 36.09 | 37.30 | 3.35 % | Whole car body one order bending |
3 | 47.53 | 49.45 | 4.04 % | Engine compartment, front fender |
4 | 54.91 | 56.34 | 2.6 % | The combination of bending and reversing |
5 | 62.14 | 63.58 | 2.32 % | Whole car body two order bending |
6 | 66.34 | 68.42 | 3.14 % | Whole car body two order reversing |
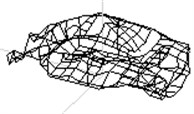
Fig. 3The finite element model of BIW
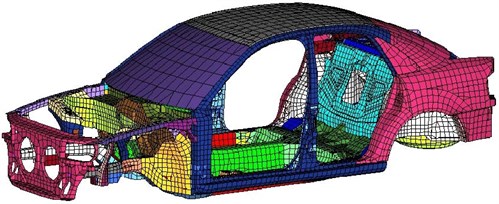
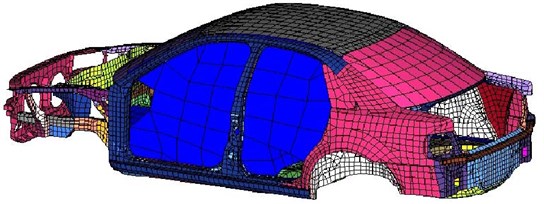
A type of car was taken as an example in this paper. A finite element model of the car body structure was built via finite element software Hypermesh, as shown in Fig. 3. During the assembly for car body structure, the welding of non-parallel solder side is mainly simulated by rbe2 elements. The solder side approximate to parallel is mainly simulated by shell gap. The entire model structure is mainly made of quadrilateral shell elements. The sum of the elements is 22472, and the sum of the nodes is 20303.
Through the comparison of the experimental modal and simulation results, a table of top 6 model parameters of BIW has been accomplished, shown in Table 1.
From the analysis of Table 1, it is easy to be seen that the relative error between the experiment results and simulation results are less than 5 %, which can meet the needs of engineering. The results also show that the finite element mesh model is reliable, and can be used in the follow-up acoustic calculations. The top 6 modal shape of BIW is shown in Fig. 4.
Fig. 4Top 6 modal shape of BIW
a) 28.93 Hz
b) 36.09 Hz
c) 47.53 Hz
d) 54.91 Hz
e) 62.14 Hz
f) 66.34 Hz
2.2. Building of the car body coupling model
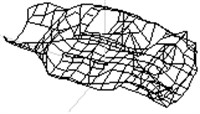
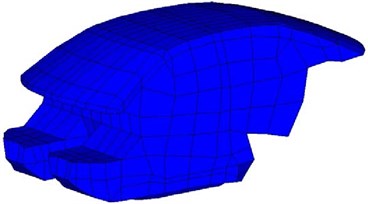
On the basis of building car body structure model, the finite element model of the acoustic cavity including the seat was built via software LMS Virtual.Lab, as shown in Fig. 5. The structures such as armrests and dashboard made a small contribution to be ignored. The external surface of the acoustic cavity was determined by the car body structure. The mesh elements are mainly hexahedral elements. Air density 1.21 kg/mm3, sound velocity 343 m/s.
Fig. 5Finite element model of the acoustic cavity
The external nodes of the acoustic cavity model and the contact nodes of the car body plates were coupled by means of the ACMODL in Hypermesh, and the finite element model of acoustic-structure coupling was built, as shown in Fig. 6.
Fig. 6Finite element model of acoustic-structure coupling
2.3. Calculation and analysis on noise transfer function
Car body’s noise transfer function refers to the interior sound pressure generated in the car from the unit force applied on the specific position of the car body. It shows the acoustic characteristics between the car body structure and the interior cavity, which has an important influence on the noise in driver’s cab caused by power assembly and road excitation [10]. The car body structure will cause the vibration of the car body wallboard and radiate noise to the space inside the car when excited, and the noise will be transferred to the reference point of the interior, and finally forms the car interior structure noise. Meanwhile, the interior sound field which is excited by the car body wallboard will restrict the plate to amplify or restrict the vibration of the car body plate, thus strengthening or reducing the noise caused by vibration. Unit harmonic excitation of certain frequency range was applied on specific position of the acoustic-structure coupling system of the car body, and the response of the car body system to the broadband frequency excitation could be obtained at the reference point of the interior sound pressure, i.e., car body’s noise transfer function from the excitation point to the reference point of the interior sound pressure, thus confirming the NVH performances such as noise level and resonance frequency etc. of finished automobiles. This provides reference for design optimization of interior noise. The vibration and sound pressure response value of the coupling system were solved by the dynamic equation of the acoustic-structure coupling system (1) under the condition of unit simple harmonic input, as shown in Eq. (2) and Eq. (3):
Fig. 7The curve of the sound pressure level response at the driver’s right ear
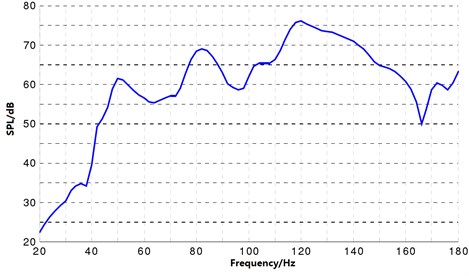
With the finite element model of acoustic-structure coupling in Fig. 3 as the research object, unit simple harmonic vertical excitation in the frequency range of 20 Hz-180 Hz and the step length of 2 Hz was applied at the left spring of the car body suspension. The sound pressure response at the driver’s ears is an important indicator for measuring the car interior structure noise. So the position of the driver’s right ear was selected as the reference point of the interior noise. It was solved by modal frequency response algorithm (SOL111) in software Nastran to obtain the sound pressure response at the driver’s right ear. It was converted into the sound pressure level response at the driver’s ear by the formula [11]:
where is the sound pressure value at the driver’s ears, is international reference sound pressure 20×10-6 Pa. The curve of the car body’s noise transfer function is as shown in Fig. 7.
According to Fig. 4, in the entire excitation frequency range, the maximum value of sound pressure level response is 75.9 dB, which appears at the excitation frequency of 120 Hz; the minimum value appears at starting frequency 20 Hz, when the sound pressure level response is 22.5 Hz. In the entire frequency range, sound pressure peaks appear at 50 Hz, 82 Hz and 120 Hz respectively. This indicates that the resonance between the excitation and the car body structure may occur under the excitations of these frequencies, which needs attention. In addition, the maximum value of the sound pressure level response of this type of car reaches 75.9 dB, which has a huge influence on the ride comfort. For this reason, the analysis optimization process in Section 3 should be improved.
3. Optimization of car body’s noise transfer function based on PSO and RBF model
3.1. Mathematical model for optimization of car body’s noise transfer function
Acoustic optimization is the progression and development of general structure optimization. It is not only related to the structure during design process, but also needs to consider the sound field as well as the coupling problem between the structure and the sound field. To investigate its optimization effect on the car body’s noise transfer function, in this paper, the root-mean-square value of the sound pressure level response at the interior reference point was the objective function, with the first-order torsional modal frequency and the overall car body mass as the constraint conditions. In view of the difficulty in dimensional change and the calculation complexity after determining the overall parameters of the car, the thickness of the main car body plate was deemed as the analysis and design parameters in this paper. As there are numerous parts in the car body structure, it is evident unpractical to set every part as the design variable. According to practical experience, 6 parameters which have influences on the car body’s noise transfer function were selected as the optimization design variables, including front floor passage (), front supporting plate (), dashboard (), rear windowsill (), ceiling (), outer body side ().
According to the selected design variables, objective function and constraint conditions, the mathematical model for the optimization design of the car body’s noise transfer function is expressed as:
In Eq. (4), indicates the root-mean-square value of the sound pressure level at the driver’s right ear within the excitation frequency range. The constraint conditions include the first-order torsional modal frequency of the car body structure (), the optimized overall car body mass not exceeding the original overall car body mass (). indicates the aforesaid design variables, subscripts and indicate the upper limit and lower limit change range of the constraint functions. Its value range is as shown in Table 2.
Table 2The initial values and value range of the design variables
Design variable | Initial value (mm) | Upper limit value (mm) | Lower limit value (mm) |
Front floor passage | 0.8 | 0.5 | 1.5 |
Rear windowsill | 0.6 | 0.5 | 1.5 |
Front supporting plate | 1.75 | 1.0 | 2.5 |
Ceiling | 0.8 | 0.5 | 1.5 |
Front division plate | 0.8 | 0.5 | 1.5 |
Outer body side | 1.0 | 0.5 | 1.5 |
3.2. Building of RBF model and precision test
During optimization, to reduce the optimization burdens, RBF approximation models of (the root-mean-square value of the sound pressure level response of the noise at the driver’s ears) and (the first-order torsional modal frequency) were built. RBF model is a kind of function with the Euclidean distance between the points to be measured and the sample points as the independent variables. See Reference [12-13] for the mathematical description of RBF model. To investigate whether the RBF model acquired can be applied to subsequent analysis and optimization, variance analysis was needed to carry out on the model to verify its fitting precision. Meanwhile, to reasonably evaluate the overall and local fitting performances of the built RBF approximation models of (the root-mean-square value of the sound pressure level response of the noise at the driver’s ears) and (the first-order torsional modal frequency), Multiple Correlation Coefficient and Relative Error were introduced as the evaluation indexes in this paper.
1) (Multiple Correlation Coefficient):
where is the residual squares sum of the sample points, is the regression squares sum of the sample points. indicates the real value of the th sample point. indicates the predicted value at the th sample point, is the number of sample points, the average response value of the sample points is . In the equation, Multiple Correlation Coefficient is between 0 and 1. The more approaches to 1, the higher the overall degree of approximation of the approximation model will be.
2) Relative Error, :
reflects the local fitting precision of the approximation model. The smaller its value is, the better the local fitting performance of the approximation model will be.
The curve of the relative errors of each test point was obtained by testing the relative errors of the fitting of RBF model at the design sample points, as shown in Fig. 8 and Fig. 9.
Fig. 8The curve of the relative errors of each test point in the RBF model of root-mean-square value of sound pressure response
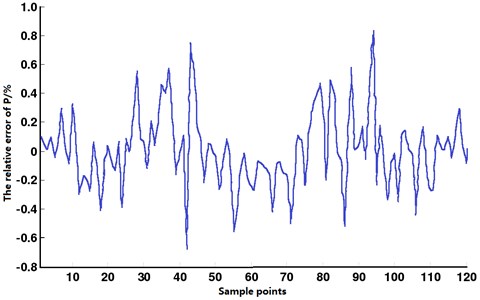
According to Fig. 8, the relative errors of each test point in the RBF model of (the root-mean-square value of sound pressure response at the driver’s ears) which are not larger than 1 %. According to Fig. 9, the relative errors of each test point in the RBF model of (the first-order torsional modal frequency) which are not larger than 0.9 %. According to Table 3, the Multiple Correlation Coefficients of the RBF models of (the root-mean-square value of the sound pressure level response at the driver’s ears) and (the first-order torsional modal frequency) are both larger than 0.96. This indicates that the RBF models of (the root-mean-square value of the sound pressure level response at the driver’s ears) and (the first-order torsional modal frequency) have high fitting precision. Therefore, the RBF models obtained are reliable and can be applied to subsequent analysis and optimization design.
Fig. 9The curve of the relative errors of each test point in the RBF model of the first-order inherent frequency
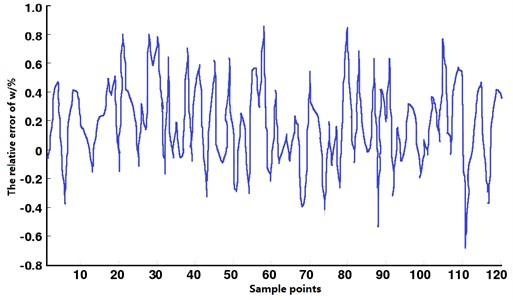
Table 3Multiple correlation coefficients of RBF models
Response values | |
, the root-mean-square value of the sound pressure level response at the driver’s ears | 0.962 |
, first-order torsional modal frequency | 0.964 |
3.3. Optimization solving for the car body’s noise transfer function based on PSO and RBF models
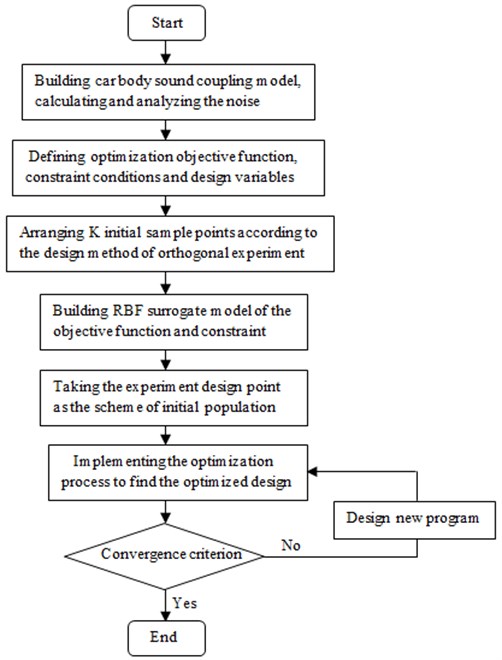
In this paper, the optimization design problem of car body’s noise transfer function was solved by means of Particle Swarm Optimization. Particle Swarm Optimization (PSO) is another new intelligence algorithm following Genetic Algorithms, Tabu Search algorithm, Simulated Annealing algorithm and Ant Colony Optimization algorithm. PSO solves optimization problem by simulating the birds’ and fishes’ coordinated mechanism of the individual and group in their foraging and migration. It solves optimization problem by coordination of the group optimal direction, individual direction and inertia direction [14]. By comprehensively considering the building process of RBF model, the optimization solving flow for the entire car body’s noise transfer function is as shown in Fig. 10.
3.4. Optimization results and discussion
To acquire the globally optimal solution, Matlab programming was adopted to set the PSO optimization parameters as: particle number is 40, maximum number of iterations is 120 times, acceleration factors and are 2, inertia weight is 0.9. The entire iteration process is as shown in Fig. 11. In view of the processing requirement on the thickness of the actual car body plates, the optimization calculation results were subject to rounding treatment. See Table 4 for the optimization results.
According to Table 4, the average value of the objective function of the optimization design results is 57.948 dB which reduce by 2.35 dB compared with the initial design value. However, the car body mass didn’t increase, and the first-order torsional modal frequency also meets the requirement of the constraint condition. The response curves of the noise at the driver’s ears before and after optimization were acquired by substituting the optimization result based on RBF model into the finite element model of acoustic-structure coupling, as shown in Fig. 12.
Fig. 10Optimization solving flow
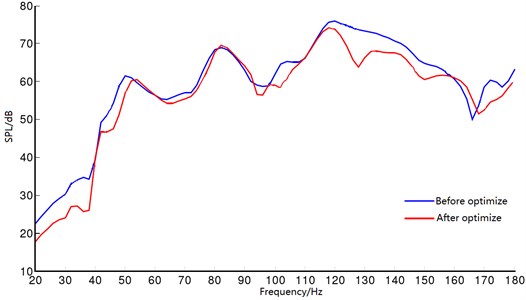
According to Fig. 12, compared with the predicted result of RBF model, the optimized root-mean-square value of the sound pressure in the accurate model is 58.052 dB, with the relative error of only 0.18 %, the sound pressure peak in the frequency range reduces to 74.556 dB from 75.987 dB, with a reduction of 1.431 dB, which indicates the feasibility of the optimization scheme.
Fig. 11Optimization iteration process
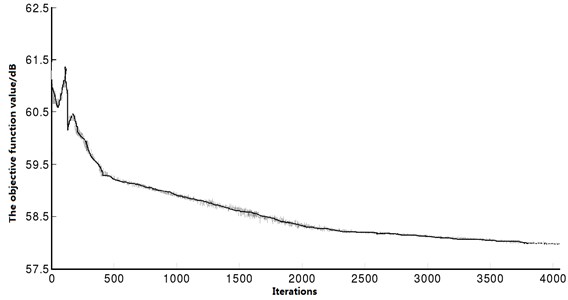
Table 4Optimization results
Design variables | Initial value | Optimized value | Rounded value |
Front floor passage (mm) | 0.8 | 1.316 | 1.3 |
Rear windowsill (mm) | 0.6 | 0.501 | 0.5 |
Front supporting plate (mm) | 1.75 | 2.499 | 2.5 |
Ceiling (mm) | 0.8 | 1.278 | 1.3 |
Front division plate (mm) | 0.8 | 0.5 | 0.5 |
Outer body side (mm) | 1.0 | 0.501 | 0.5 |
Mass (kg) | 364.00 | 363.34 | 363.46 |
The first-order modal frequency (Hz) | 33.615 | 34.827 | 34.757 |
Average value of the objective function (dB) | 60.298 | 57.939 | 57.948 |
Fig. 12Comparison of the curves of noise transfer functions before and after optimization
4. Conclusions
In this paper, the finite element models of the car body structure, car interior cavity and acoustic-structure coupling are built based on the car body acoustic-structure coupling of the car and the theory of noise transfer function, and car body’s noise transfer function from the excitation position to the driver’s ears is calculated. The mathematical model for optimization of the car interior structure noise is built with the root-mean-square value of the sound pressure level response at the interior reference point as the objective function, and the first-order torsional modal frequency and the overall car body mass as the constraint conditions. To reduce the optimization burdens, the design space of the variables is sampled by means of orthogonal experimental design during the optimization process, and the Radial Basis Function (RBF) models of the root-mean-square value of the sound pressure level response of the noise at the driver’s ears and the first-order torsional modal frequency are built to replace the finite element models. Finally, the optimization scheme of the car body’s noise transfer function is acquired by means of Particle Swarm Optimization (PSO). The results show that the sound pressure peak within in the frequency band reduces by 2.35 dB after optimization. Meanwhile, the response curves of the noise at the driver’s ears before and after optimization are acquired by substituting the optimization scheme into the finite element model of acoustic-structure coupling. Compared with the predicted results of RBF model, the relative error of the optimized root-mean-square value of the sound pressure in the accurate model is only 0.18 %, which indicates the feasibility of the optimization scheme.
References
-
Cunningham I. A., Shaw R. Signal-to-noise optimization of medical imaging systems. Journal of the Optical Society of America A, Vol. 16, Issue 3, 1999, p. 621-632.
-
Han X., Guo Y. J., Yu H. D., et al. Interior sound field refinement of a passenger car using modified panel acoustic contribution analysis. International Journal of Automotive Technology, Vol. 10, Issue 1, 2009, p. 79-85.
-
Han X., Guo Y. J., Zhao Y. E., et al. The application of power-based transfer path analysis to passenger car structure-borne noise. Proceedings of the Institution of Mechanical Engineers, Part D: Journal of Automobile Engineering, Vol. 222, Issue 11, 2008, p. 2011-2023.
-
Marburg S. Efficient optimization of a noise transfer function by modification of a shell structure geometry – Part I: theory. Structural and Multidisciplinary Optimization, Vol. 24, Issue 1, 2002, p. 51-59.
-
Marburg S., Hardtke H. J. Efficient optimization of a noise transfer function by modification of a shell structure geometry – Part II: application to a vehicle dashboard. Structural and Multidisciplinary Optimization, Vol. 24, Issue 1, 2002, p. 60-71.
-
Chin A. W., Huelga S. F., Plenio M. B. Coherence and decoherence in biological systems: principles of noise-assisted transport and the origin of long-lived coherences. Philosophical Transactions of the Royal Society A: Mathematical, Physical and Engineering Sciences, Vol. 370, Issue 1972, 2012, p. 3638-3657.
-
Majidzadeh V., Schmid A., Leblebici Y. Energy efficient low-noise neural recording amplifier with enhanced noise efficiency factor. IEEE Transactions on Biomedical Circuits and Systems, Vol. 5, Issue 3, 2011, p. 262-271.
-
Downes T. P., Welch D., Scott K. S., et al. Calculating the transfer function of noise removal by principal component analysis and application to AzTEC deep-field observations. Monthly Notices of the Royal Astronomical Society, Vol. 423, Issue 1, 2012, p. 529-542.
-
Elwali W., Li M., Lim T. C. Vehicle interior noise transfer function predictions applying semi-analytical, finite element and boundary element approaches. International Journal of Vehicle Noise and Vibration, Vol. 7, Issue 2, 2011, p. 91-108.
-
Lu Z. L., Hou F., Huang C. B. Extracting modulation transfer function of the visual system from contrast sensitivity function in external noise. Journal of Vision, Vol. 13, Issue 9, 2013, p. 1268-1268.
-
Hueber W., Sands B. E., Lewitzky S., et al. Secukinumab, a human anti-IL-17A monoclonal antibody, for moderate to severe Crohn’s disease: unexpected results of a randomised, double-blind placebo-controlled trial. Gut, Vol. 61, Issue 12, 2012, p. 1693-1700.
-
Huang C. M., Hsieh C. T., Wang Y. S. Evolution of radial basic function neural network for fast restoration of distribution systems with load variations. International Journal of Electrical Power and Energy Systems, Vol. 33, Issue 4, 2011, p. 961-968.
-
Beatson R. K., Levesley J., Mouat C. T. Better bases for radial basis function interpolation problems. Journal of Computational and Applied Mathematics, Vol. 236, Issue 4, 2011, p. 434-446.
-
da F. Silva P. H., Cruz R. M. S., D’Assuncao A. G. Blending PSO and ANN for optimal design of FSS filters with Koch island patch elements. IEEE Transactions on Magnetics, Vol. 46, Issue 8, 2010, p. 3010-3013.
About this article

