Abstract
Damages detection method of a long span beam was studied. The beam was designed to subject vibration in order to simulate service station of a real structure. The distributed dynamic strain on the beam was studied. Firstly, in order to reduce the dynamic data discriminate time, a new BOTDA method using amplitude transfer of BFS was applied. At the level of spatial resolution of 10 cm and the sampling interval of 5 cm of the BOTDA system, a sampling frequency for dynamic strain of about 13 Hz was achieved. Secondly, a cracks detection system based on distributed dynamic strain was provided. Most of the time, a real structure is undergoing dynamic load, therefore crack detection system of analyzing distributed dynamic strain was concerned. The work is unlike former research that was based on the distributed static strain analysis. Thirdly, a free vibration experiment was performed on a beam of 15 meters long in order to verify the dynamic crack detection system. In order to local the crack easily, the data from BOTDA were processed. Fourier Transform Analysis was adopted to transfer the distributed dynamic strains from time domain into frequency domain. Test results indicated that the distributed frequency amplitude analysis method provided a practical means to recognize the simulated cracks on the beam undergoing dynamic displacement.
1. Introduction
Because of lots of advantages, such as small diameter, immunity to electromagnetic interference, corrosion resistance etc., optical fiber sensors are gaining increased application in real-time health monitoring of structures in their total life cycles [1]. However, optical fiber sensor, which utilizes speckle pattern caused by interference among propagating modes, has a limited detection range to several hundred meters [2]. Recently developed sensor utilizing stimulated Brillouin scattering (SBS) has overcome this problem [3, 4]. The technique of SBS, referred to as Brillouin optical time-domain technique (BOTDA), is based on the detection of Brillouin scattering signal. A pumping pulse wave, which is launched into one end of the sensing fiber, nonlinearly interacts with a counter propagating CW probe wave [5]. An acoustic wave is excited. The acoustic wave, in turn, couples these two optical waves to each other [6, 7]. As the frequency difference between the pump and probe waves is very close to the amount of Brillouin frequency of optical fiber, high intensity Brillouin scattering signal is amplified [8]. The Brillouin frequency, , which is a fiber-dependent parameter, is of the order of 10-11 GHz for standard single mode fibers at room temperature[9]. For a given fiber, the exact value of the Brillouin Frequency Shift (BFS), , is sensitive to both the strain and temperature at the interaction position [10].
Owing to their unparalleled ability to continuously evaluate strain and/or temperature along an optical fiber, optical fiber sensors based on Brillouin scattering have been applied in distributed sensing for long-term structural health monitoring on structures [11], such as bridges [12], pressure vessel and aircraft [13]. Strain singularity happened at defects or cracks on structures. Therefore, the Brilloin-scattering-based defect monitoring system becomes a research concerning for years [14, 15].
However, because of requirement on precise optical frequency scanning scheme [16], the developed cracks detecting methods were based on monitoring of the distributed static strain on structures. In order to perform static experiments on a real structure, such as on a bridge, no transportation is allowed. Meanwhile, static forces are needed to be loaded in addition. These activities cost a lot of money, labors and times. Traffic jams may be arose during the tests. These costs are difficult to be estimated. Therefore, a real time crack monitoring method based on distributed dynamic strain sensor system is necessary.
To achieve the aim of dynamic real time monitor on structures, two difficulties should be overcome: (1) the dynamic data capture; (2) dynamic data analysis method.
Recently, a few studies, performing SBS-based optical fiber sensors, have been proposed for dynamic measurements [16-19]. Tsuji [16] proposed a method of applying two pump lights and two probe lights with an appropriate wavelength difference to evaluate the change in BFS without frequency scanning. The gain ratio of two probe lights, which is related to strain changes, was measured. Minardo etc. [17] tuned probe wave to a pulse, whose Brillouin frequency shift approximately equal to half the Brillouin gain spectrum (BGS) linewidth. Loayssa etc. [18]set up a dynamic BOTDA sensor system base on RF demodulation and Brillouin phase-shift. 1.66 kHz measurement rate was realized.
The former crack monitoring studies were based on the analysis of distributed static strain [19], whose value changes obviously at cracks. For dynamic instance, the distributed strains vary in a short time period. Therefore, it is hard to recognize crack rapidly. Moreover, measure noise would obscure the singularity of distributed strain on the structures.
Structures in service are usually undergoing dynamic load. In this paper, we suggested a simple crack monitor method based on analyzing distributed dynamic strain recorded by a commercial BOTDA instrument avoiding complex modification. Feasibility of the proposed monitoring approach was evaluated by experiments. The measurement rate could be about 13 Hz, which is fast enough for most large structures dynamic monitoring. The acquired dynamic strain distribution was algorithmically analyzed to locate the simulated cracks on a beam.
2. Methodology
The BOTDA sensor basically works on the principle of stimulated Brillouin scattering (SBS) effect [3].
A pumping pulse light is launched at one end of the sensing fiber and the continuous wave (CW) probe light is launched at the opposite end of the fiber so that it will propagate in the opposite direction (shown in Fig. 1.). The CW light is amplified through the Brillouin interaction with the pump pulse. The frequency of the CW light will be in resonance with the Stokes frequency.
Fig. 1Configuration of BOTDA
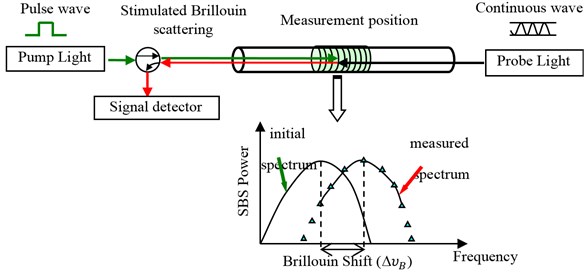
The receiver detects the scattered light intensity with scanning the upcoming probe light. The frequency peak shift relates the magnitude of strain/temperature, while location can be calculated from round-trip time as . Where is distance along the fiber from the light input end to the sampling point, is velocity of light in vacuum and is time interval between the pulsed incident light and the backscattered light at the detector.
The Brillouin frequency shifts linearly with strain or temperature. At the applied strain and the temperature variation , the Brillouin frequency, , can be written by [20, 21]:
where and are strain and temperature sensitive coefficients respectively. is the frequency of the fiber at the original conditions of and .
On isothermal conditions, the strain distribution along the entire optical fiber from the Brillouin frequency shifts could be expressed as by rewrote Eq. (1):
If a beam is subjected to dynamic loads, the strains of different positions on the beam, present as , will change with time. On isothermal conditions, the Brillouin frequency shifts with the dynamic strain barely. Therefore, the distributed dynamic strain can be captured by BOTDA:
Once there is a defect or crack on the beam, strain singularity appears because of stress concentration at the defect. The BOTDA spectrum can tell the position of defects based on the above equations.
In order to get enough sampling frequency, a method for fast and distributed Brillouin sensing was proposed to capture the dynamic strain. The method is based on the classical BOTDA technique, with the following modifications. Firstly, pump pulse was stepped before inserting into the optic fiber to acquire high resolution and high accuracy. Secondly, instead of using swept frequency, it uses a pump pulse and a probe wave at fixed optical frequencies individually, which is obtained from the first step. Amplitude-transfer mode, based on Brillouin variation at a fixed swept frequency, was adapted to scan the frequency shift.
Since free vibration disappears very fast in real structure, the distributed strain changes soon. The quick variation of strain would obstruct the singularity at the defect. In order to eliminate the disturbance, algorithm was studied to locate the defects in a structure subjected to dynamic strain.
The distributed dynamic strain in time domain could be transferred to frequency domain by Fourier Transform as shown in Eq. (4):
Substituting Eq. (3) into Eq. (4), the distributed Fourier spectrum, , can be expressed by the Brillouin frequency shift as:
where:
Eqs. (5)-(6) represent the Fourier spectrum of the dynamic strain in succession and discreteness, respectively. The spectrum of the dynamic data, , is expressed in complex. For a given point at the position , the second term of the right side of the expressions is constant. However, the first one is related to the frequency. As the first term arrives to maximum, the value of the whole expression becomes the greatest.
The strain distribution along the optical fiber can be recognized by BOTDA. Therefore, the mode of the variable is distributed on the tested optical fiber. Consequently, the mode, or called as amplitude, of the variable relates to position and frequency, as sketched in Fig. 2.
Fig. 2Sketch of distributed frequency spectrum
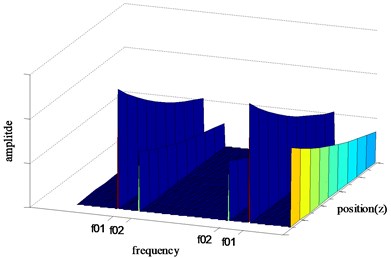
Obviously, the amplitude of is almost zero, except at for individual point along the optical fiber. The parameter is represented in Fig. 2 as and for different extreme points, which denote natural frequencies for a given structure.
As shown in Fig. 2, the saltation amplitude is significant. At the natural frequency, the value of amplitude peaks for each point along the optical fiber. Merely taken the maximum Fourier frequency spectrum into account, the amplitude distribution along the optical fiber is visible. The distributed amplitude along the monitoring optical fiber could be calculated by Eq. (7):
From Eq. (7), the maximum Fourier amplitude for separate points, which occurs at natural frequency, can be obtained. Therefore, the time-depend BOTDA signal can be translated to position-depend parameter. The parameter was denoted as distributed amplitude along the optical fiber. At a defect along the structure, the strain discontinues, so does the Fourier amplitude according Eqs. (5)-(6). Hereby, the defect on a structure could be recognized on the basis of the distributed amplitude.
3. Experimental program
An experimental program was carried on a 15-m-long steel beam in order to evaluate the methodology for dynamic defect detection by distributed BOTDA sensor. The beam was subject to free vibration to simulate one of the experienced dynamic situations.
3.1. Experimental setup
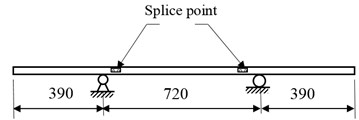
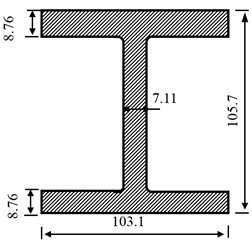
The beam, shown in Fig. 3, is constructed by splicing three steel segments at the lengths of 4.6, 5.8 and 4.6 m. Every two segments are bolted by a plate to simulate damage in the form of crack during the experiments.
Fig. 3Tested beam: a) sketch of the beam; b) cross section of the beam
a)
b)
A single mode optical fiber, Corning SMF-28, was stuck on the surface of the beam over the 15 m span at a given strain level (Fig. 4). A commercial BOTDA measuring system from Neubrex Company was applied to measure the dynamic strain of the optical fiber sensor during the vibration. The sampling interval and spatial resolution were set as 5 and 10 cm, respectively.
Fig. 4Displacement applied setup: a) measurement of displacement; b) appliance of displacement
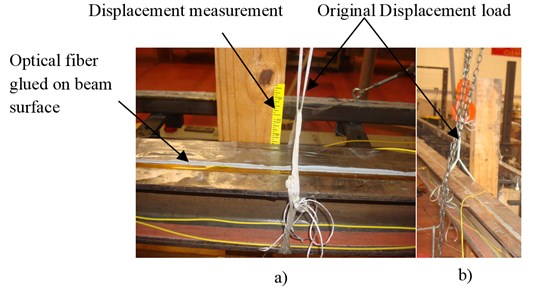
In order to simulate dynamic deformation of a structure, a free vibration test was designed and performed on the beam.
A hoist, as shown in Fig. 4(b), was used to pull up the beam from the middle with help of strings. As the displacement reached the set value, the beam was kept steady for a while. Afterwards, the beam was released suddenly as the pulling strings were cut. In this way, the beam would undergo free vibration. The preset upward displacement was 5/8 inch during the study.
A fiber Bragg grating (FBG) sensor at the original central frequency of 1585 nm was fixed on the upper surface of the beam. The FBG sensor would monitor the strain on the beam at the position of 6.2 meter during the vibration.
3.2. Vibrated strain monitoring results
The free vibrated strain of the optical fiber along the beam changed with time. Fig. 5 represents the strain changes. In order to eliminate the temperature influence, the first detected data was set as reference. Therefore, the calculated strains on the beam were minus.
In order to clearly study the strain distribution changes during the beam vibration, parts of the strains were chosen to be present as in Fig. 6. Only ten groups of distribute strain were presented.
It is obviously that the strains along the optical fiber on the beam changed with time. At each time, the strain distributed almost triangularly. The center of the fiber was subjected to the maximum strain. However, the value of the strain data oscillated during the vibration.
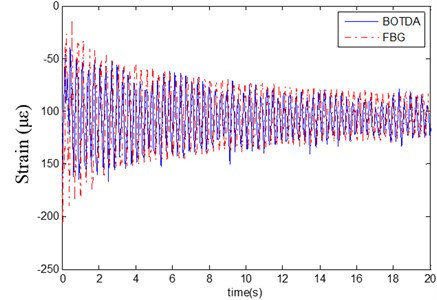
Only the strain at the position of 6.2 m during the vibration was present in Fig. 7, as compared with the strain captured by FBG sensor. Obviously, the strain data recorded by the FBG sensor and the BOTDA share the similar variations. The strain values were almost equal for both sensors. They increased to a maximum, followed by a drop. Afterward, it decayed as time went by during the freed vibration. However, the data by FBG sensor decayed smoother than the data by the BOTDA system. The reason could exist in the acquisition rate. For the FBG, the rate was 500 Hz. For the BOTDA, nevertheless, it was only about 13 Hz since the instrument collected 300 data in 22.9 seconds.
Fig. 5Strain distribution on the beam during the free vibration
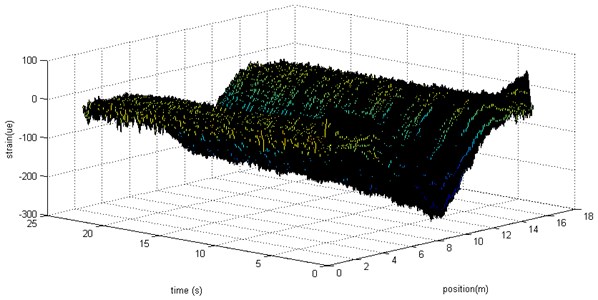
Fig. 6Selected time data for the strain distribution on the beam
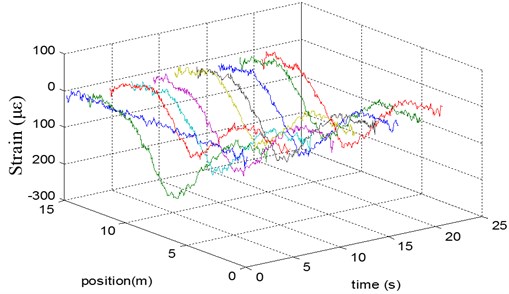
Fig. 7Strain in the middle of the beam
Figs. 5-7 present the time domain distributed strain during beam vibration. However, the strain singularity was hidden because of the oscillation. Therefore, it was hard to figure out the defects on the beam according to the strain distribution. The distributed strain data were algorithmically analyzed in order to locate the defects.
3.3. Cracks monitoring
The objective of the study was to locate the crack. Although the sensor system based on BOTDA could monitor the real time strain distributed on the structure, the cracks or defects is difficult to be detected easily because of the strain oscillation. Therefore, the time-domain data was transferred into frequency domain.
The results after Fourier transform were demonstrated in Fig. 8. The first natural frequency of the beam could be found experimental, which is about 3.3 Hz in Fig. 8(a). At the given interval and spatial resolution of BOTDA, the sampling frequency is about 13 Hz as in Fig. 8(a).
Fig. 8Frequency amplitude distribution on the tested beam: a) in 2-dimension; b) in 3-dimension
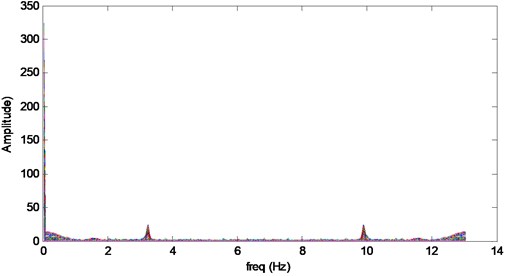
a)
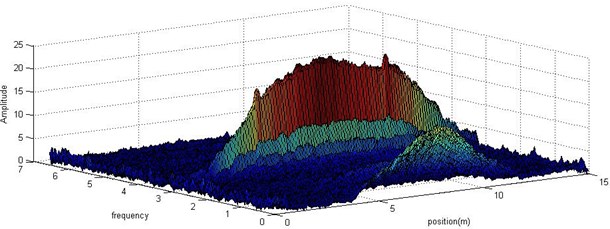
b)
The 2-D frequency domain diagram didn’t show any information along the optical fiber. In order to find distributed signal, the frequency amplitude on the beam was shown in Fig. 8(b). Because of symmetry, only half of the spectrum was present.
As shown in Fig. 8(b), except for the side lobes, the spectrum peaks at the natural frequency along the optical fiber. Observing the frequency amplitude distribution at the natural frequency of 3.3 Hz, the crack singularity on the beam is visible. For concision, only the distributed amplitude at 3.3 Hz was sketched in Fig. 9. In order to eliminate the noise, wavelet was applied to analyze the data. The result was shown in Fig. 9.
The frequency amplitude along the beam is approximately linearly distributed as in Figs. 8-9. In the middle part of the beam, the value of the amplitude is almost the biggest. Meanwhile, there are two other peaks at the positions where the man-made cracks are. The simulated cracks were 4.6 meter away from the free end of the beam. The recognized positions of the two cracks were listed in Table 1.
Therefore, the distributed frequency amplitude calculated from the BOTDA signal would localize the defect on a structure.
Fig. 9Maximum amplitude along the optical fiber
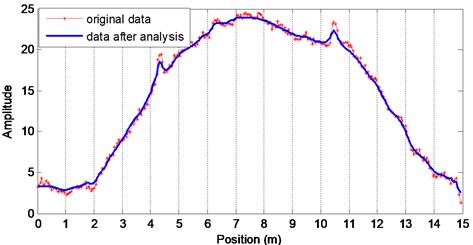
Table 1Location of the cracks
Theoretical ones (m) | Tested ones (m) | |
Left crack | Right crack | |
4.6 | 4.312 | 4.53 |
Error | 6.3 % | 1.5 % |
4. Conclusions
A real-time damage detection method based on dynamic strain distributions on a structure was explored in this study. The technique includes optical fiber sensor, dynamic strain recording system (for example BOTDA instrument), and a computer. For a structure in service, it is easy to be dynamic displaced. For example, motion of a vehicle on a bridge would lead to dynamic strain on the structure. Therefore, no extra procession is needed for the tested structure.
This study involved in experiments on a 15-m-long beam. The beam was intentionally fabricated with simulated cracks with motivation to detect defects. An algorithm based on Fourier transform was suggested to locate the cracks. Experimental results indicated that the frequency amplitude distribution along the beam would preliminarily detect the cracks. Wavelet transfer processing on the frequency domain amplitude was applied to locate the cracks more accurately.
References
-
Ma J., Asundi A. Structural health monitoring using a fiber optic polarimetric sensor and a fiber optic curvature sensor – static and dynamic test. Smart Materials and Structures, Vol. 10, 2001, p. 181-188.
-
Udd E. Sagnac interferometer based secure communication systems. Proceedings of the 11th International Conference on Optical Fiber Sensors, 1996, p. 594-597.
-
Pradhan Himansu Shekhar, Sahu P. K. 150 km long distributed temperature sensor using phase modulated probe wave and optimization technique. Optik-International Journal for Light and Electron Optics, Vol. 125, Issue 1, 2014, p. 441-445.
-
Dong Y., Chen L., Bao X. Extending the sensing range of Brillouin optical time-domain analysis combining frequency-division multiplexing and in-line EDFAs. Journal of Lightwave Technology, Vol. 30, Issue 8, 2012, p. 1161-1167.
-
Nickles M., Thevenaz L. Robert P. Simple distributed fiber sensor based on Brillouin gain spectrum analysis. Optics Letters, Vol. 21, Issue 10, 1996, p. 758-760.
-
Yariv A. Optoelectronics. 4th Edition. Saunders College Publishing, Orlando FL, 1991.
-
Sonneville C., Degioanni S.,Martinet C., et al. Pressure-independent Brillouin Fiber Optic Sensors for temperature measurements. Journal of Non-Crystalline Solids, Vol. 401, 2014, p. 36-39.
-
Horiguchi T., Tateda M. BOTDA-nondestructive measurement of single-mode optical fiber attenuation characteristics using Brillouin interaction: Theory. Journal of Lightwave Technology, Vol. 7, Issue 8, 1989, p. 1170-1176.
-
Peled Y., Motil A., Yaron L., Tur M. Slope-assisted fast distributed sensing in optical fibers with arbitrary Brillouin profile. Optics Express, Vol. 19, Issue 21, 2011, p. 19845-19854.
-
He J. P., Zhou Z., Ou J. P. Simultaneous measurement of strain and temperature using a hybrid local and distributed optical fiber sensing system. Measurement, Vol. 47, 2014, p. 698-706.
-
Bernini R., Minardo A., Zeni L. Accurate high-resolution fiber-optic distributed strain measurements for structural health monitoring. Sensors and Actuators A: Physical, Vol. 134, Issue 2, 2007, p. 389-395.
-
Bastianini F., Rizzo A., Galati N., Deza U., Nanni A. Discontinuous Brillouin strain monitoring of small concrete bridges: comparison between near-to-surface and “smart” FRP fiber installation techniques in smart structures and materials. Proceedings of SPIE, Vol. 5765, 2005, p. 612-623.
-
Nishio M., Mizutani T., Takeda N. Structural shape identification using distributed strain data from PPP-BOTDA. Proceedings of SPIE, Vol. 6530, 2007, p. 65301J.
-
Guo T., Li A. Q., Song Y. S., et al. Experimental study on strain and deformation monitoring of reinforced concrete structures using PPP-BOTDA. Science in China Series E: Technological Sciences, Vol. 52, Issue 10, 2009, p. 2859-2868.
-
Motamedi M. H., Feng X., Zhang X., Sun C., Ansari F. Quantitative investigation in distributed sensing of structural defects with Brillouin optical time domain reflectometry. Journal of Intelligent Material Systems and Structures, Vol. 24, Issue 10, 2012, p. 1187-1196.
-
Tsuji K., Noda H., Onodera N. Sweep-free Brillouin optical time domain analysis using two individual laser sources. Optical Review, Vol. 19, Issue 6, 2012, p. 381-387.
-
Bernini R., Minardo A., Zeni L. Dynamic strain measurement in optical fibers by stimulated Brillouin cattering. Optics Letters, Vol. 34, Issue 17, 2009, p. 2613-2615.
-
Urricelqui J., Zornoza A., Sagues M., Loayssa A. Dynamic BOTDA measurements based on Brillouin phase-shift and RF demodulation. Optics Express, Vol. 20, Issue 24, 2012, p. 26942-26949.
-
Feng X., Zhou J., Sun C., et al. Theoretical and experimental investigations into crack detection with BOTDR-distributed fiber optic sensors. Journal of Engineering Mechanics, Vol. 139, Issue 12, 2013, p. 1797-1807.
-
Galindez-Jamioy C. A., López-Higuera J. M. Brillouin distributed fiber sensors: an overview and applications. Journal of Sensors, Vol. 2012, 2012, p. 1-17.
-
Kurashima T., Horiguchi T., Tateda M. Distributed temperature sensing using stimulated Brillouin scattering in optical silica fibers. Optics Letters, Vol. 15, Issue 18, p. 1038-1040.
About this article

This work was supported by the Postdoctoral Science Foundation of Jiangsu Province (Grant No. 1302071B) and the U.S. Department of Commerce, National Institute of Standards and Technology, Technology Innovation Program.
