Abstract
To study the factors affecting the driving stability of tank trucks under dangerous working conditions, a full vehicle dynamics model and an equivalent test bench for liquid sloshing were designed. On the test bench, two dangerous working conditions were simulated to study liquid sloshing, i.e. braking and turning. The results show that the liquid sloshing force have a major impact on driving stability and the forces depended on the tank geometry, the fill level and the natural sloshing frequency of the liquid. The results of this study still provide a theoretical and experimental basis for studying further the factors that affect the driving stability of tank trucks.
1. Introduction
Rollover accidents of partially filled tank trucks are one of the most common types of accident. Most of the time, the tank truck load is a dangerous liquid, and a rollover accident will have serious consequences. Thus, resolving the roll stability problem of a partially filled tank truck is particularly important [1]. Tank trucks carry liquid goods. Due to the liquids’ flow characteristics, when braking, turning, or avoiding an emergency, the movement of the liquid sloshing in the tank affects the driving stability of these vehicles. Therefore, two kinds of working conditions, namely braking and turning, the second being more dangerous, are defined as dangerous conditions for tank truck driving [2].
Sloshing forces against the tank differs from the forces of solid goods. Sloshing forces are potentially dynamically coupled to the rolling of vehicles [3]. Study of the driving stability of tank trucks has progressed in line with the study of the dynamic shock behavior of liquids. In 1978, for the first time, Standerg and his colleagues studied the sloshing forces against a tank through experiments. They collected the values of sloshing forces and put them into a simplified vehicle dynamics model to estimate the roll stability of a tank truck [4-5]. In 1989, Ranganathan blazed a trail for the study of the driving stability of tank trucks. Through the Quasi-Static (QS) method, he developed a formula for the relationships between the sloshing forces, the shape of the tank, external impacts, and the vehicle roll angle. He inputted the values of sloshing forces into a static analysis model and obtained an approximate value of rollover limits [6]. Based on documentary research, Ken developed finite-difference methods and built a quasi-static, dynamic model for tank trucks [7]. Through to value simulation, Ranganathan and Rakheja studied the issue further [8]. However, their model was complicated by many vehicle performance parameters that are rarely seen or difficult to obtain. Based on the QS method, Kang and his colleagues designed a cross-section shape for the optimal tank [7]. Research has proven that, under the same conditions, the stability of the truck improves if one selects appropriate shape parameters for the tank based on what the cargo is and how it is loaded. More recently, Salem adopted an equivalent mechanical model to explain the sloshing of liquid inside a tank. By combining the mechanical model and the vehicle dynamic model, he built a vehicle dynamic model to study the stability of trucks [8-9].
At present, there are few works dealing with the stability issue resulting from the liquid sloshing force. Romero built a model and studied how rollover stability affected driving stability. The experiment was carried out under high fill level conditions only, regardless of the acceleration and braking of the tank trucks [3]. Therefore, the present study developed a new model and test bench to measure the sloshing forces and study the factors that affect driving stability of tank truck.
2. Dynamic model for tank trucks under dangerous working conditions
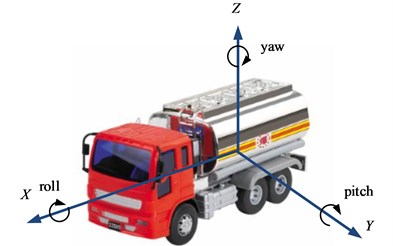
The coordinates of the tank are shown in Fig. 1. The axis represents the direction in which the truck is heading. Around the axis, the truck rolls and incurs lateral acceleration. If the lateral acceleration is too high, the truck will roll over. The axis represents the lateral side of the truck. Around the axis, the truck pitches and incurs transverse acceleration. The axis represents the vertical direction of the tank. Around the axis, the truck yaws and incurs yaw acceleration. If the yaw acceleration is too high, the truck will skid.
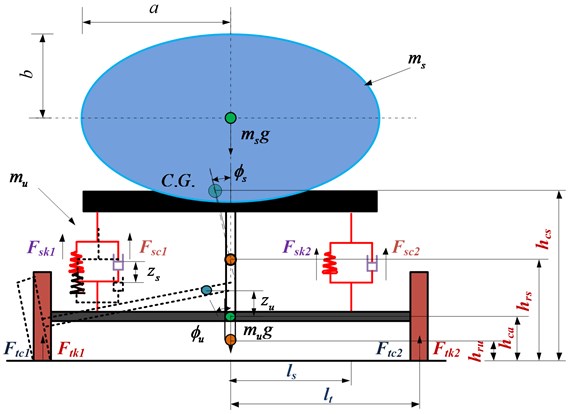
Based on a two-axis of tank truck, we build a simplified four-degrees-of-freedom model to study the potential impact on liquid goods on the driving stability of tank trucks. It is a half-vehicle model. The four degrees of freedom represent the forces and the equilibrium of movements. Fig. 2 is a force diagram of a rolled-over tank truck. When the truck turns steadily, represents the angle between the axis and the free surface of the liquid inside the tank; and represent the spring mass and the unspring mass; and represent the vertical displacement and the roll angle of the spring mass; and represent the vertical displacement and roll angle of the unspring mass; and represent the position of the suspension and tires.
Fig. 1The coordinates of the tank
Given the spring mass and unspring mass of the tank truck, the balancing equations of the force and moment are as below:
In Eq. (1), as represents the acceleration of the spring mass, the acceleration of the unspring mass, represents the roll-angle acceleration of the spring mass, and represents the roll-angle acceleration of the unspring mass. represents the suspension force imposed on the unspring mass, represents the movement of the spring mass around the axis, represents the movement of the unspring mass around the axis, and represents the overturning movement of the spring mass. The unknown values are shown in Eq. (2):
Fig. 2Roll plane model (cross-section)
In Eq. (2) for , the equations for calculating the variety of forces are as Eq. (3):
In Eq. (3) for , the equations for calculating the variety of forces are as Eq. (4):
where, and represent the inside and outside spring forces of the spring mass; and represent the inside and outside lateral damping forces of the spring mass; and represent the inside and outside spring forces of the unspring mass; and refer to the effects on the spring mass in the lateral damping force. is the suspension roll stiffness, the tires’ lateral stiffness, the suspension damping coefficient, and the tire damping coefficient.
Through the force and moment balancing equations of the spring mass and unspring mass, substituting Eqs. (2)-(4) into Eq. (1), the vehicle dynamics model for tank trucks is given by:
3. Liquid sloshing experiments on tank trucks under dangerous working conditions
To study the sloshing forces of the liquid against the tank, an equivalent test bench for liquid sloshing was built in a traffic safety lab, in Jilin University, China. The bench was used to test tanks with different cross-sections and to measure the sloshing forces under different sloshing frequencies and fill levels.
3.1. Designation of the equivalent test bench
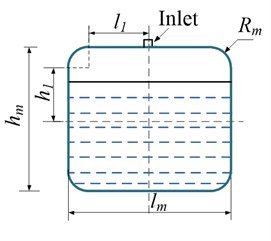
Three tanks commonly seen in the market were chosen for the tests. As shown in Fig. 3, their cross-sections are elliptical, circular and improved rectangular, respectively. To objectively show the liquid sloshing inside the tanks, the three tests followed the principle that the cross-sectional areas and volumes of the tanks should be same. Parameters were set by converting the sizes of the chosen tanks. The Jieshun tank truck manufactured by Foton was used. Its size is 4100 (length of the tank) × 1720 (major axis of the cross-section) × 1150 (minor axis of the cross-section). The parameters of the tank are shown in Table 1. In the Fig. 3, represents the long axis in the cross-section of the tank, the short axis, the radius of the circular cross-section, the width of the improved rectangular cross-section, the height of the improved rectangular cross-section, and the coordinates of the chamfer angle center of the rectangular tank, and the height from the liquid fill level to the ground level. The equation for the fill level in the tank is defined as . The test liquid is water. The tank is made of resin. The cross-sectional areas of the three tanks are in the range of 0.148-0.152 m2, with a length of 0.6 m. The test bench consists of a tank, a shaker, trails, a force sensor, sensor signal amplifier and load control instrument. Fig. 4(a) shows the test bench. On the bench, two tracks are fixed. A wagon is prepared. Because of the purpose to test the sloshing forces under two types of dangerous working conditions, a rotatable platform is installed in the carrying vehicle.
Table 1The parameters of the test tank
The shape of the tank | Tank size (m) | Cross-section area |
Ellipse elliptical | 0.26, 0.175 | 0.148 m2 |
Circular | 0.22 | 0.152 m2 |
Improved rectangular | 0.4, 0.35, 0.05, 0.15, 0.125 | 0.15 m2 |
When simulating turning conditions, due to the effect of the centrifugal force of the tank, the liquid in the tank may slosh, and because the body of the truck has a suspension system, the tank will roll around the roll axis. To simplify the test, we made the following assumptions: the tank truck exhibits uniform driving motion, regardless of the friction force on the ground; under the action of the oscillator, the liquid starts sloshing in the tank, which has an impact on the force on the tank’s wall. We built a test bench adjusted to the experimental situation.
As shown in the schematic view of the test bench is in Fig. 4. The test bench has two trails, and the rails are matched to the rail car, due to the two driving situations in which we want to examine changes in the sloshing force. Thus, we rotatable mount the rail car platform in order to meet the requirements of the different tests.
Fig. 3Three common cross-sections of tanks
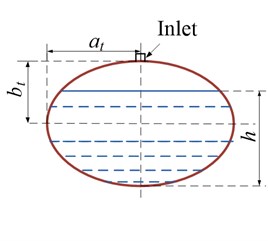
a) Elliptical cross-section
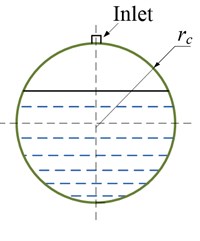
b) Circular cross-section
c) Improved rectangular cross-section
Fig. 4Equivalent test bench
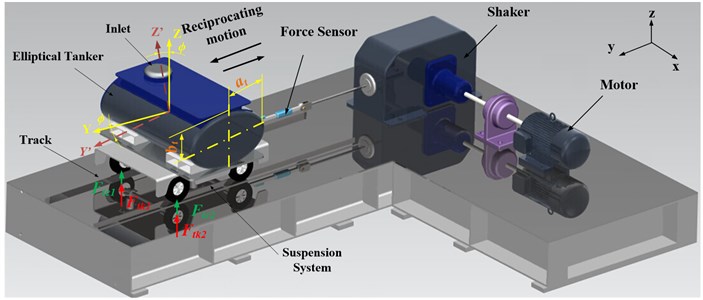
a) Three dimensional model of test bench
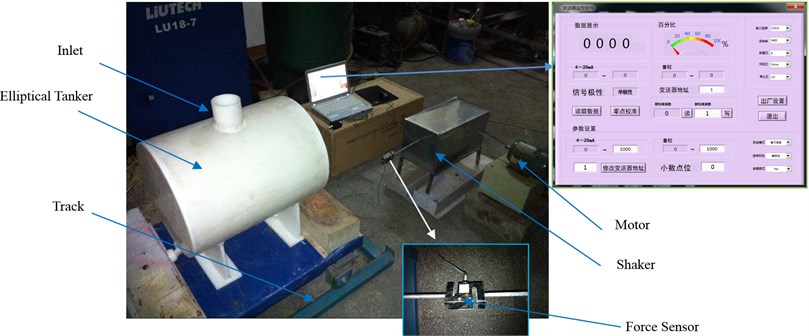
b) Test bench
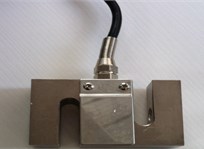
c) S-type pressure sensor

d) Sensor signal amplifier

e) Load control instrument

f) USB data conversion line
In this study, the experimental equipment includes carrying vehicle, tanks, force sensor, signal amplifier, the signal acquisition, measurement setup and shaker and motor. Carrying vehicle is used to simplify tank truck, due to the motor to provide power source, so only use carrying vehicle instead of a tank truck, with its carrying liquid tank, and connected to the force transducer. Shaker is used for reciprocate movement that is cam mechanism and motor is the power source for reciprocating movement of carrying vehicle (Fig. 4(a)). Tanks were used to load test liquid, according to the test plan production respectively elliptical, circular and improved rectangular; force transducer is used to measure the test of the pressure produced by liquid sloshing in the tank, this study chose S-type pressure sensors (Fig. 4(c)), according to the mass of tank under 100 % liquid fill level and the total mass of the car, choose the sensors that is biggest range of 50 kg. Signal amplifier is used to transfer signal after pressure sensor processing to display on the recorder, due to the principle of force sensor, this study selects the signal amplifier to enlarge the electrical signals from the force sensor, that is advantageous for the observation of the changes in fashion (Fig. 4(d)). Display recorder is used to record the large signal and, that is available to copy data from a disk, and input to the computer, easy to use in the future (Fig. 4(e)). USB data conversion line can be transferred the collected signal to the computer (Fig. 4(f)).
3.2. Experimental scheme of the equivalent test bench
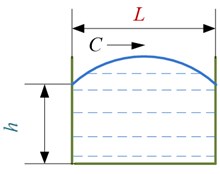
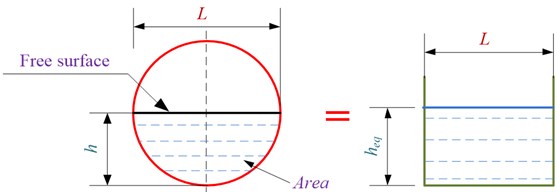
The resonant frequency of the tank should not usually be the same as the natural frequency of a liquid. To estimate the sloshing frequency, both experimental and theoretical methods can be used. The experimental method is based on the fill level and the tank geometry. The theoretical method is based on equations: by simplifying some physical quantities, an equation can be developed to calculate the velocity of a wave. For an ideal and incompressible fluid, the equation used to calculate the velocity of a free surface wave in the liquid under the rotational condition is . The equation concerns , the wavelength, , the depth of the tank, and , the gravitational acceleration. The velocity of the free surface wave in a liquid is independent of other features, such as the density of the liquid. Usually, the following equation is used to calculate the natural sloshing frequency in the rectangular tank [6]:
The fill level is 50 % to 100 %, and , the length of the free liquid surface:
The Fig. 5 below shows the parameters under the first-order liquid sloshing mode in the rectangular tank. For the first sloshing mode, represents the length of the free liquid surface, namely, . To calculate the natural sloshing frequency in a non-rectangular tank, we perform an equivalent replacement with , the equivalent liquid depth, as shown in Fig. 5(a), (b).
Fig. 5Equivalent fluid depth: a) quasi-static free surface under a steady lateral acceleration field; b) equivalent fluid depth for a non-rectangular container
a)
b)
Through the equations mentioned above, the parameters of liquids in different tanks can be calculated by Matlab 2012b (Table 2). For free surface for liquid simulation, based on the Eq. (4) to 5, under five kinds of liquid fill level ( 50 %, 60 %, 70 %, 80 % and 90 %) to numerical simulation, and made the following assumptions: elliptical tank, cross sectional size of 1.6 m, 1.28 m, liquid into tank of water, the density of 1000 kg/m3, under the first-order sloshing mode, no sticky liquid, the required software of Matlab 2012b. Based on the parameters obtained, experiments are carried out according to different sloshing frequencies and fill levels. The experimental groups are shown in Table 3. Simulation of the two dangerous working conditions is also performed (Table 3). To better understand the liquid sloshing, we chose five sloshing frequencies and five fill levels. The steps taken in the experiments using the test bench are as follows. Based on the tank geometry, three experience groups are formed. In each group, a frequency is set before we carry out the tests based on the five fill levels. The data are then collected and analyzed to determine the highest sloshing force. In this way, tests on five frequencies are carried out.
Table 2Parameters of the various shapes of tanks
Shape of tank | Fill level | Length of free surface (m) | Height of free surface (m) | Natural sloshing frequency (Hz) |
Ellipse | 50 % | 0.520 | 0.260 | 1.220 |
60 % | 0.510 | 0.312 | 1.234 | |
70 % | 0.477 | 0.364 | 1.209 | |
80 % | 0.416 | 0.416 | 1.137 | |
90 % | 0.312 | 0.468 | 0.987 | |
Circular | 50 % | 0.440 | 0.220 | 1.122 |
60 % | 0.431 | 0.264 | 1.135 | |
70 % | 0.403 | 0.308 | 1.112 | |
80 % | 0.352 | 0.352 | 1.046 | |
90 % | 0.264 | 0.396 | 0.907 | |
Improved rectangular | 50 % | 0.400 | 0.175 | 1.048 |
60 % | 0.400 | 0.210 | 1.077 | |
70 % | 0.400 | 0.245 | 1.094 | |
80 % | 0.400 | 0.280 | 1.103 | |
90 % | 0.400 | 0.315 | 1.109 |
3.3. Equivalent braking test
When the tank truck brakes, it has the friction force imposed on it from the ground, in the opposite direction to the one in which it is moving. Assuming that the tank truck exhibits uniform motion before braking, namely that the liquid in the tank is in a stationary state, under the effect of the brake reaction force, the liquid starts sloshing in the tank, which has an impact on the tank. According to this phenomenon of sloshing force, we built a braking test bench, and tested various braking situations. The elliptical test tank is shown in Fig. 4(a), where is the long axis of the elliptical cross-section, is the short axis of an elliptical cross-section, is the height of the center of the tank above the center of the wheel, is the height of the center of the tank above the test bench, is the height of the test bench, is the height of the free surface, is the speed, is the acceleration of the tank, and is the length of the test bench. Some of the values of the parameters are shown in Table 4.
Table 3Experimental groups
Parameters | |
Fill level (%) | 50, 60, 70, 80, 90 |
Sloshing frequency (Hz) | 1.0, 1.5, 1.75, 2.0, 2.25 |
Table 4Parameters of the test bench
Size (m) | |
0.56 | |
0.7 | |
0.8 | |
0.5-0.9 |
4. Numerical simulation
4.1. Simulation of numerical model
The parameters of the vehicle dynamics model are shown in Table 5. C. G. represents the center of gravity. We performed a numerical simulation with Matlab 2012b to compare the two groups of data, i.e. fill level 80 % and 90 %. The resulting data are shown in Fig. 6.
Table 5Specification of tanker used in the roll plane model
Parameters of tank trucks | |
, spring mass | 80 kg |
, unspring mass | 40 kg |
, cargo mass | 40 kg |
, C. G. height of spring mass | 150 cm |
, C. G. height of turning axis | 60 cm |
, roll center height of spring mass | 100 cm |
, roll center height of unspring mass | 40 cm |
, turning radius | 25 m |
Fig. 6Lateral acceleration of model and of the real truck under different fill level
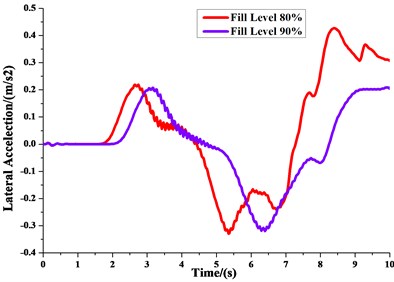
Fig. 7The sloshing force of liquid and solid when the truck is turning Test Data
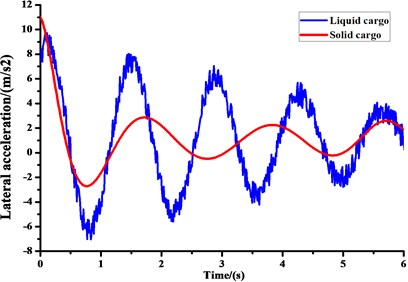
4.2. Analysis of sloshing force of liquid and solid goods
To research whether liquid sloshing has an impact on the driving stability of tank trucks, we used a liquid impact equivalent test bench to simulate both solid and liquid tanks under the same conditions. The liquid tanks were a circular cross-section, the fill level was 90 %, the mass 50 kg, and the sloshing frequency 1.25 Hz. The comparison of the sloshing force is shown in Fig. 7. The experiment results show that liquid sloshing in the tank has a large effect on the tank wall, and on the driving stability of the truck. Therefore, liquid sloshing in the tank is an important reason for the poorer driving stability of liquid goods tank truck compared to that of solid goods tank truck. It is important to further explore the factors that influence liquid sloshing.
5. Equivalent test data analysis
Fig. 8 shows the results of the turning experiment. It consisted of three kinds of tanks with fill levels of 80 % and 90 %, two kinds of driving conditions, namely braking and turning, and a sloshing frequency of 1.5 Hz. Through the filter processing, the sloshing force on the tank wall is shown with real change rule.
When the fill level is 80 %, Table 3 shows the three kinds of tank (elliptical, circular and improving rectangular). The length of the free surface was set to 0.398 m, 0.42 m and 0.4 m; the length of the free surface is basically the same in all cases, but that for the improved rectangular tank is smaller. The corresponding liquid natural sloshing frequencies are the same, and the free surface heights are 0.416 m, 0.352 m and 0.28 m respectively. The improving rectangular tank has the minimum level. Fig. 8(a) shows that the three tanks have roughly the same trend in sloshing force. The circular tank’s force is bigger. The curve of the corresponding changes is at the maximum value level. As is known from the turning process of tank truck, the roll stability of tank truck with circular cross-section is poorer. In contrast, the tank with an elliptical cross-section has lower sloshing force, while the maximum sloshing force of the improved rectangular tank is the smallest of the three. When comparing the sloshing period with the other two kinds of tank, the change curve is lower. Therefore, variations in the lateral C. G. displacement of the tank is minimal. Thus, for a high liquid fill level, a shorter length of free surface can reduce the sloshing force on the tank wall.
In Fig. 8(b), the fill level is 90 %. The maximum sloshing force of the circular tank has increased slightly compared with the other two tank. Compared with the previous figure, with the higher fill level, the sloshing period for the elliptical cross-section is smaller than that of the improved rectangular. At the beginning of the test, the difference between the two tanks is very small, but due to the continuous sloshing, the gap between their sloshing periods increases. As whole experiment process, the elliptical sloshing force is larger than that of the improved rectangular.
Based on the above analysis, the values for the three kinds of tank are presented (Table 6). The tests show that the shape and fill level of the tank, and the sloshing frequency, are the most important factors affecting the driving stability of a tank truck. Liquid sloshing has a great influence on the driving stability of a liquid tank vehicle. Thus, the three above factors have a significant impact on the driving stability of tank trucks. The design and manufacture of liquid tank cars should give full consideration to these factors.
Table 6Results for three kinds of tank
Fill level | Tank shape | Max (N) | Min (N) | Mean (N) |
80 % | Ellipse elliptical | 9.56 | –6.64 | 2.13 |
Circular | 11.86 | –8.98 | 2.54 | |
Improved rectangular | 8.64 | 4.59 | 1.97 | |
90 % | Elliptical | 8.64 | –6.23 | 1.76 |
Circular | 9.12 | –7.81 | 1.93 | |
Improved rectangular | 7.94 | –4.73 | 1.58 |
Fig. 8Change in sloshing force with fill level
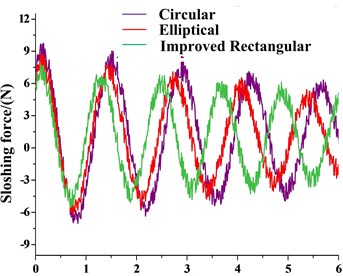
a) 80 % fill level
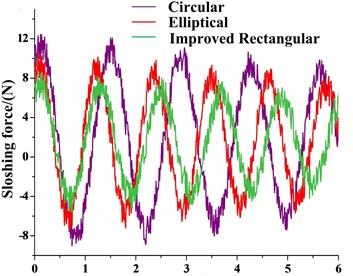
b) 90 % fill level
5.1. Analysis of sloshing force test data under braking
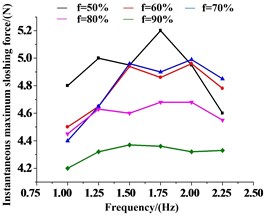
We tested braking for five different liquid fill levels, and three different tank cross-sections, collecting data on the instantaneous maximum sloshing force on the tank wall. Fig. 9(a-c) shows the change in the maximum impact curve for, respectively, the elliptical, circular and improved rectangular cross-sections of tanks, in different cases. Fig. 9(d) shows the eigenvalues of the instantaneous maximum sloshing force in the braking test.
When the fill level is 50 %, and the length of the free surface is 0.52 m, which is the biggest of the three tanks, the impact of the sloshing liquid is the biggest (Fig. 9(a)). Therefore, the instantaneous maximum sloshing force under a fill level of 50 % is the biggest of the five different natural sloshing frequency situations. Thus, an elliptical cross-section of tank truck with a medium liquid fill level has a very great effect on the vehicle’s driving stability. When the liquid fill level is 90 %, the instantaneous maximum force curve is smooth. When the liquid fill level is high, the length of the free surface and the displacement of the mass center are both smaller, so the sloshing force is less.
Fig. 9Instantaneous maximum sloshing forces of three kinds of tank under different sloshing frequencies, when tank truck is braking
a) Elliptical cross-section
b) Circular cross-section
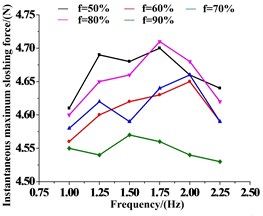
c) Improved rectangular cross-section
d) Eigenvalue statistics for the three tanks’ instantaneous maximum sloshing force at different liquid fill levels
When the fill level is 50 %, as the sloshing frequency rises, the maximum sloshing force also rises, but it then starts to decrease at 2.25 Hz, and the maximum sloshing force is at 1.5 Hz (Fig. 9(b)). The force under a fill level of 60 % is larger than that for 50 %.
When the fill level is 80 %, when the sloshing frequency is 1.75 Hz or 2 Hz, the instantaneous sloshing force of the tank is even bigger than when the liquid fill level 50 % (Fig. 9(c)). In contrast, when the fill level is 60 %, the instantaneous maximum sloshing force is lower generally under different sloshing frequencies.
Fig. 9(d) shows the test data for the three tanks under braking. The instantaneous maximum sloshing force on the front tank wall is biggest for the elliptical cross-section tank, under fill level 50 %, and a sloshing frequency of 2 Hz, when the force is 5.23 N. The lowest value, 4.2 N, is for the improved rectangular cross-section, fill level 90 %, and sloshing frequency 2 Hz. Thus, in the braking test, as the shape of the tank, the liquid fill level and the liquid’s natural sloshing frequency change, great changes occur to the liquid sloshing force and, in turn, to the driving stability of the tank truck.
5.2. Test data analysis of sloshing force for turning tank trucks
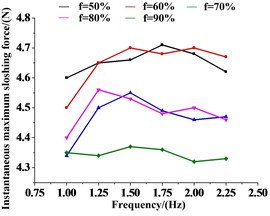
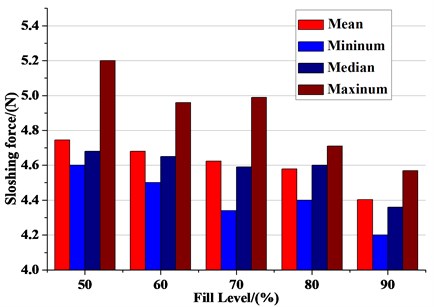
In the turning experiment, to test three different cross-sections of tanks, data on the instantaneous maximum sloshing force on the tank wall were acquired. The curve of the instantaneous maximum sloshing force is shown in Fig. 10(a-c) for the elliptical, circular and improved rectangular cross-sections under different circumstances. The eigenvalue statistics for the three tanks’ instantaneous maximum sloshing forces for different liquid fill levels are shown in Fig. 10(d).
Fig. 10Instantaneous maximum sloshing force on three kinds of tanks with different sloshing frequencies, when tank truck is turning
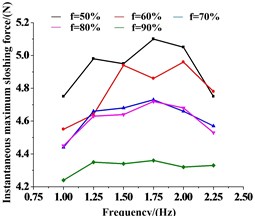
a) Elliptical cross-section
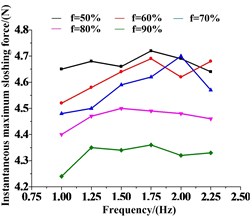
b) Circular cross-section
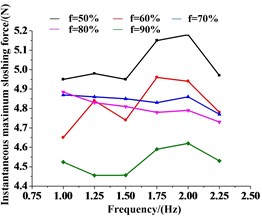
c) Improved rectangular cross-section
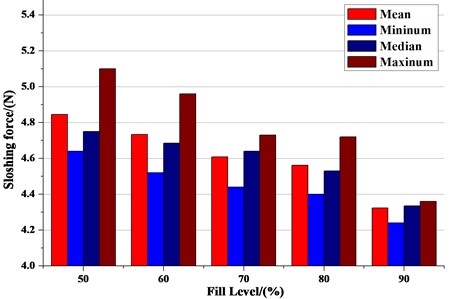
d) Eigenvalue statistics for the three tanks’ instantaneous maximum sloshing force at different liquid fill levels
When the fill level is at 50 %, the instantaneous maximum sloshing force under different sloshing frequencies is greater than for the other four liquid fill levels (Fig. 10(a)). Only under a frequency of 2.25 Hz is the force less than under a fill level of 60 %. The trends under liquid fill levels of 70 % and 80 % are very similar. When the fill level is 90 %, the change in the instantaneous maximum sloshing force for different sloshing frequencies is small. Due to the high liquid fill level, the length of the free surface and the mass center of the liquid sloshing displacement are smaller, and so the sloshing force is less. Under this condition, the driving stability of the tank truck is the best.
When the fill level is 50 %, the biggest impact can be seen under different sloshing frequencies (Fig. 10(b)). When the fill level is 70 % and the sloshing frequency is 2 Hz, the instantaneous maximum sloshing force is greater than under a liquid fill level of 50 %, at 4.74 N. When sloshing frequency is 1 Hz or 2.25 Hz under a liquid fill level of 80 %, the instantaneous maximum sloshing force is greater than under a liquid fill level of 60 %. When the liquid fill level is 90 %, changes in the maximum sloshing force are more stable, and it is worth noting that the instantaneous maximum sloshing force under a sloshing frequency of 1 Hz is less than when the liquid fill level is 70 % or 80 %.
When the fill level is 50 %, the curve changes greatly (Fig. 10(c)). When the sloshing frequency is 1 Hz or 1.75 Hz the force is slightly smaller than when the liquid fill level is 60 %. Unlike in the previous two cases, when the fill level is 90 %, the change amplitude of the curve is bigger.
In Fig. 10(d), for the elliptical cross-section, when the fill level is 50 %, and the sloshing frequency is 1.75 Hz, the instantaneous maximum sloshing force on the front wall of the tank is the greatest, 5.13 N. For the improved rectangular cross-section, under fill level 90 %, and when the sloshing frequency is 1.25 Hz, the instantaneous maximum sloshing force on the side wall is at a minimum, 4.24 N. Thus, it can be seen that, in the turning experiment, as the shape of the tank, the liquid fill level and the natural liquid sloshing frequency change, large changes in liquid sloshing will take place in the tank, affecting the driving stability of the tank truck.
From the above, as the shape and fill level of the tank, and the natural liquid sloshing frequency change, the length and the height of the free surface will change. Data on liquid sloshing forces were collected and analyzed using an equivalent test tank. It can be seen that, with different shapes of the tank and different liquid fill levels, the liquid sloshing force on the tank will also change. Therefore, when tank trucks turns drastically, the lateral liquid sloshing will cause rollover accidents. When truck is braking, the change in the liquidity impact will cause the braking displacement of the tank truck to increase, which could increase the risk of accidents.
6. Conclusions
The equivalent test bench for liquid sloshing in the tank was used to study the factors that influence the driving stability of the tank truck. A tank truck vehicle dynamics model was developed in this study. In addition, two dangerous working conditions (i.e. braking and turning) were tested for three common tank shapes (i.e. elliptical, circular and improved rectangular cross-section). Liquid sloshing has a great influence on the driving stability of tank trucks, and the instantaneous sloshing force of tanks under higher fill levels is smaller. Among of the three common tank shapes, the improved rectangular cross-section tank has better driving stability. In designing and manufacturing liquid tank trucks, the shape of the tank, the fill level of the liquid, and the natural sloshing frequency of the tank have to be consider, because they are important factors and affects the driving stability of tank trucks. Moreover, the manufacturers of liquid tank can use this method to simulate the movement of liquid in the tank with the required shape. A scaling test tank can be created to obtain the lateral smaller sloshing force of tank size due to reducing tank design research and design costs. Improved rectangular tank trucks have better drive stability than other cross-section tank trucks.
References
-
Acarman Tankut Rollover prevention for heavy trucks using frequency shaped sliding mode control. Vehicle System Dynamics, Vol. 44, 2006, p. 737-762.
-
Aliabadi S., Johnson A., Abedi J. Comparison of finite element and pendulum models for simulation of sloshing. Computer and Fluids, Vol. 32, 2003, p. 535-545.
-
Romero J. A., Ramírez O., Fortanell J. M., Martínez M., Lozano A. Analysis of lateral sloshing forces within road containers with high fill levels. Journal of Automobile Engineering, Vol. 220, Issue 3, 2006, p. 303-312.
-
Strandberg L. Lateral Stability of Road Tankers. National Road and Traffic Research Institute, Berkeley, 1978.
-
Hirt C. W., Nichols B. D. Volume of fluid (VOF) method for dynamics of free boundaries. Computational Physics, Vol. 39, 1981, p. 201-221.
-
Ranganathan R., Rakheja S., Sankar S. Kineto-static roll plane analysis of articulated tank vehicles with arbitrary tank geometry. International Journal of Vehicle Design, Vol. 10, Issue 1, 1989, p. 89-111.
-
Kang X., Rakheja S., Stiharu I. Optimal tank geometry to enhance static roll stability of partially filled tank vehicles. SAE Transactions, Vol. 108, Issue 2, 1999, p. 542-553
-
Ranganathan R., Rakheja S. Steady turning stability of partially filled tank vehicles with arbitrary tank geometry. Journal of dynamic systems, measurement and control, Vol. 111, 1989, p. 481-495.
-
Salem M. I. Rollover Stability of Partially Filled Heavy-Duty Elliptical Tankers Using Trammel Pendulums to Simulate Fluid Sloshing. West Virginia University, Morgantown, 2000.
-
Romero J. A., Lozano A., Ortiz W. Modeling of Liquid Cargo-Vehicle Interaction During Turning Manoeuvres. 12th IFToMM World Congress, Besançon, France, 2007.
-
Rumold W. Modeling and simulation of vehicles carrying liquid cargo. Multibody System Dynamics, Vol. 5, Issue 4, 2001, p. 351-374.
-
Modaressi-Tehrani K., Rakheja S., Sedaghati R. Analysis of the overturning moment caused by transient liquid slosh inside a partly filled moving tank. Proceedings of the Institution of Mechanical Engineers, Part D, Vol. 220, Issue 3, 2006, p. 289-301.
-
Shang C. Y., Zhao J. C. Studies on liquid sloshing in rigid containers using FLUENT code. Journal of Shanghai Jiaotong University, Vol. 42, Issue 6, 2008, p. 953-956.
-
Romero J., Hildebrand A. R., Martínez M., Ramírez O., Fortanell J. M. Natural sloshing frequencies of liquid cargo in road tankers. International Journal of Heavy Vehicle Systems, Vol. 12, 2005, p. 121-138.
-
Aliabadi S., Johnson A., Abedi J. Comparison of finite element and pendulum models for simulation of sloshing. Computers and Fluids, Vol. 32, 2003, p. 535-545.
-
Kolaei A., Rakheja S., Richard M. J. Range of applicability of the linear fluid slosh theory for predicting transient lateral slosh and roll stability of tank vehicles. Journal of Sound and Vibration, Vol. 333, Issue 1, 2014, p. 263-282.
-
Bouazara M., Toumi M., Richard M. J. Study of the directional stability of fully articulated tank-vehicle under random excitation. International Journal of Vehicle Systems Modeling and Testing, Vol. 9, Issue 2, 2014, p. 193-205.
-
Bottiglione F., Mantriota G. Field tests and validation of dynamical models of tank vehicles. International Journal of Heavy Vehicle Systems, Part I: Mathematical Model and Experimental Apparatus, Vol. 19, Issue 1, 2012, p. 1-22.
About this article

This study is supported by the National Science Foundation of China (Grant No. 51375200).
