Abstract
Identification of the location of damages in pipeline is important and still needs to be improved due to the problems such as limited number of sensors that can be placed in the pipeline, uncertainty of the working environment. In this paper, a new approach is presented, which shows an improved diagnosis performance. The new approach is based on combining an improved D-S evidence theory and an improved index which is based on three specific identification techniques known to the pipeline community. The improved D-S evidence theory is based on the idea of preserving similar evidences and using weighted average evidence to represent the conflict evidence. The paper also presents an experiment to verify the new approach by comparing the result of the new approach with the traditional D-S approach. The experimental result has shown that the new approach is promising. The new approach also renders the possibility to visualize the location of the damages in the pipeline, which facilitates the access to the damage for repair and any compensation measure.
1. Introduction
Performance deterioration of pipelines during the service life often results from the changes in load characteristics, environmental influences, random actions, corrosion and aging. A failure of the pipelines may result in major economic losses and even life casualties. Therefore, the ability to detect the damage of pipelines is becoming increasingly important. During the last three decades, the identification of damages in pipelines is mainly in two areas: (1) modeling and prediction of crack dynamics which leads to damages and (2) vibration-based damage identification [1-3]. Due to the problems such as limited capability in removing noises in signals, limited number of sensors that can be placed on site, variation in sensor distribution, and reliable excitation method, and the damage identification technique still needs to be improved, rendering their practice use [4, 5].
The improvement can certainly be made from a certain perspective. One perspective is the information fusion, which is the main concern of the present paper. Use of information fusion in the area of the damage identification is not new with several important developments in the literature [6-11]. One of the most powerful information fusion techniques may be the technique based on Dempster-Shafer (D-S) evidence theory. Guo [12] used the three main information fusion approaches (Bayesian fusion, D-S evidence theory and the fuzzy fusion method) to detect damage of the truss structure and numerical results indicated that D-S evidence theory is the most effective method among the three fusion methods. Li et al. [13] presented a weighted and selective information fusion technique for damage identification by combination of artificial neural network (ANN), D-S evidence theory-based information fusion and the Shannon entropy. Guo and Li [14] proposed a two-stage method to determine the location and extent of multiple structural damages by using the D-S evidence theory and a micro-search genetic algorithm (MSGA). Bao et al. [15] applied D-S evidence theory-based approach for the structural damage detection and obtained a better diagnosis result than the approach which is not based on the fusion of data.
However, the traditional D-S evidence theory often fails to deal with the conflict evidence in the damage identification problems. Deng [16] addressed this shortcoming with the D-S evidence theory by employing weighted average evidence as a means to resolve conflict evidences. The method has only shown a partial success in structural damage identification. Besides, few investigations were put on the damage identification of the pipeline structure.
This paper proposes an improved D-S evidence theory. This improved method is based on the two general ideas. The first idea is that a new index is proposed, which combines three specific damage identification methods. The second idea is that the weighted average evidence is used to replace the conflict evidence.
2. Theory
2.1. Damage identification methods
2.1.1. Mode shape curvature method
Reduction in the stiffness at some location for the damaged structure results in an increase of the local modal curvature. The mode shape curvatures (MSC) are usually computed numerically from the mode shapes by using central differences, given as:
where represents modal curvature, represents the mode number, represents the measurement location, and represents the modal displacement at th measurement point of the th mode, represents distance between two sucessive measurement points; for uneven spacing, represents distance between sucessive measurement points (1) to () and () to (1).
After the MSC for the damaged and the undamaged structure are calculated, the absolute difference between the two sets is utilised to locate damage. Change in mode shape curvature (CMSC) is obtained as:
where is the change in the th mode shape curvature, and are the MSC of the damaged and the undamaged structure of the th mode, respectively.
2.1.2. Modal flexibility curvature method
With mass-normalized mode shapes, the modal flexibility matrix can be obtained accurately by using only a few of the lower frequency modes, i.e:
where , and are the modal flexibility matrix, th frequency and corresponding mode shape of the undamaged structure, respectively, and , and are the modal flexibility matrix, th frequency and corresponding mode shape of the damaged structure, respectively, is the number of the measured modes.
Flexibility curvature matrix is calculated as:
where and represents the value in flexibility curvature matrix for the th row in the th column before and after its damage respectively, and represents the value in flexibility matrix for the th row in the th column before and after its damage respectively.
Flexibility curvature difference matirx is obtained as:
The maximum absolute values of each column in are used to define the modal flexibility curvature (MFC). In Eq. (8), the peak value appears nearby the location of structure damage, and increases with the incremental damage:
2.2. Traditional D-S evidence theory
The D-S evidence theory has been originally developed by Dempster in his work on upper and lower probabilities [17] and later on by Shafer [18]. Some key definitions of the theory, those used in the approach proposed in the paper, are summarized in the following.
Give the identification framework and the corresponding power set () is defined as the set of all the subsets of . The theory of evidence assigns a basic probability assignment function, named basic probability assignment (BPA) or , to any subset of :
In the framework of the D-S theory, the BPA can be interpreted as a generalization of the probability concept being as the probability not assigned to only one hypothesis but to a set of hypotheses without any information on how it is distributed among the elements of the set itself.
The Dempster’s rule provides a method for combining the basic probability assignment of different information sources . In particular, given and as two information sources, the fused BPA is given by:
where represents a measure of the degree of conflict between the two sources defined as:
3. Improved D-S evidence theory and structural damage identification evaluation index
3.1. Improved D-S evidence theory
To measure the similarity degree between different evidences, the distance function proposed by Jousselme was first introduced [19]. Suppose is a complete identification framework containing different propositions, and , are two BPAs on the identification framework , then the distance between and can be obtained as:
where , and is the inner product of the two vectors.
After the distance of different evidence is obtained, the similarity measure between different evidences could be obtained as:
This means that the smaller the distance between different evidences, the bigger the similarity between them, and after the similarity is obtained, the supporting degree could be obtained as:
The supporting degree reflects the supporting degree by other evidences. Then the reliability of evidence can be calculated as:
The reliability can be regarded as the weights of the evidences; the bigger the reliability, the higher the weights. A weighted average evidence is defined as:
Conflict detect factor is defined as:
where . , evidence is fully consistent with other evidence; , is seriously contradicted with other evidence.
The detection threshold is gained by repetitive tests and expert experience. The obtained evidences are divided into two categories, similar evidences and conflict evidences. For any evidence , if (), then the evidence is judged as similar evidence; if , then the evidence is judged as conflict evidence, is conflict evidence detection threshold.
Most of the obtained evidences are supposed to be reliable, but a small number of abnormal evidences can lead to incorrect conclusions. Conflict detection is utilized to identify similar evidences and conflict evidences. Similar evidences are reserved, while conflict evidences need to be targeted corrected. Weighted average evidences are used to replace conflict evidences. The corrected evidence is obtained as:
Then the traditional D-S evidence combination rule is used to fuse all the evidences after the conflict detection.
3.2. Structural damage identification evaluation index
The principles of detecting structural damage for most of identification methods are similar. Function relationship is established between the indicators and the structural corresponding node numbers and the indicators corresponding to the nodes of damaged elements present higher values with respect to the ones of undamaged elements. To compare the performance of different identification methods quantitatively, a new structural damage identification evaluation index is proposed. First, all the identification results should be normalized. Then the structural damage identification evaluation index is obtained as:
where and represents the value of indicators corresponding to damaged elements and undamaged elements, respectively. The higher structural damage identification evaluation index value, the better performance of identification method in locating the damage.
4. Experiment
4.1. Experiment set-up
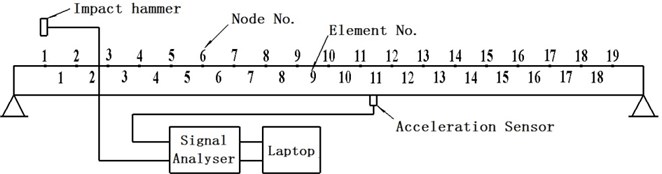
Vibration experiments were conducted on the simply supported carbon steel pipes as shown in Fig. 1. The details of the pipes are given in Table 1. An impact hammer with sensitivity of 0.225 mV/N is used to generate an excitation. One piezoelectric acceleration sensor with a nominal sensitivity of 100 mV/g is mounted on the pipe in the vertical direction to measure the dynamic responses. The data is acquired by an ECON MI-8008 signal analyzer and a laptop. 21 points are marked at the centerline of the pipe along the axial direction with a total of 20 elements. 19 nodes are selected as excitation points without the two nodes on the supporting ends. In order to minimize the effects of support and noise, the piezoelectric acceleration sensor is mounted near the mid-span of the pipe.
Table 1Geometry and material properties of pipe
Length | Outer diameter | Internal diameter | Poisson’s ratio | Mass density | Modulus of elasticity |
1 m | 76 mm | 66 mm | 0.3 | 7850 kg/m3 | 200 GPa |
Fig. 1Modal test model
4.2. Methods
Circumferential cracks were created on the surfaces of the pipes to simulate the damage. Four different damage cases with two different sizes of flaws are listed in Table 2. Standard experimental modal analysis procedures were applied to data obtained from the accelerometer during the vibration tests to identify the modal parameters of the pipes in its damaged and undamaged condition. Both the excitation and the response time histories are transformed into the frequency domain in the form of Frequency Response Functions (FRF). The FRF measurements are collected after 6 averages. Exponential window is applied to each average. Modal parameters (resonant frequencies, mode shapes, modal damping) can be determined by curve-fitting a Laplace domain representation of the equations of motion to the measured frequency domain data. A rational fraction polynomial, global, curve-fitting algorithm in a commercial modal analysis software package (ME’Scope) was used to fit the analytical models to the measured FRF data and to extract resonant frequencies, mode shapes and modal damping values. The primary modal parameters of the first three modes of these pipes are then used to determine the three indicators, i e., first-order changes in mode shape curvature, second-order changes in mode shape curvature and modal flexibility curvature. The basic probability values of the three indicators are obtained. The accuracy of the damage identification method is then evaluated through observations of the plots.
Table 2Dimension and location of the flaw in pipe
Damage case | Length (mm) | Width (mm) | Depth (mm) | Damage element |
G1 | 50 | 5 | 2 | 10 |
G2 | 50 | 5 | 2 | 10 |
G3 | 50 | 5 | 4 | 4, 15 |
G4 | 50 | 5 | 4 | 4, 15 |
5. Results and discussion
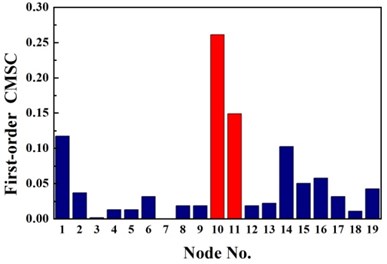
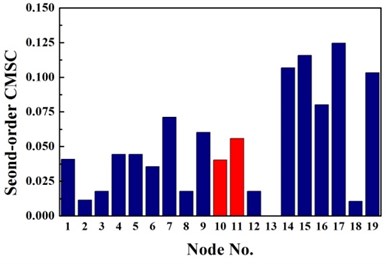
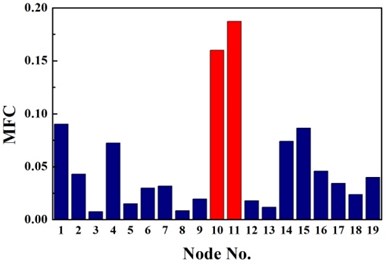
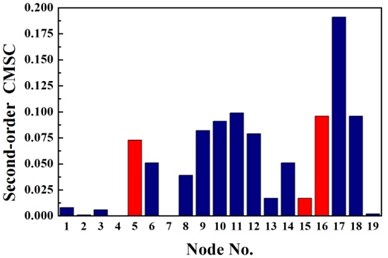
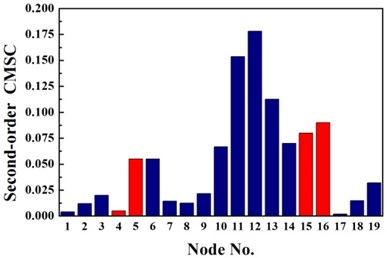
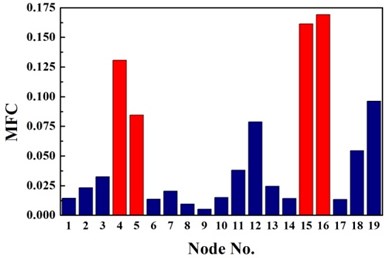
The same damage scenarios are analyzed by applying three approaches with the first three natural frequencies and associated mode shapes. The results are shown in Figs. 2-5. In all cases, element with higher BPA value is a more probable damage element. As it is shown in Figs. 2-5, for first-order CMSC method and MFC method, the BPA values of the damage elements are relatively higher than the ones of undamaged elements. It is also found that some undamaged elements are easily mistaken for damaged elements, which may lead to improper prediction of damage location. In addition, the second-order CMSC indicator can hardly detect the damage location correctly and has serious conflicts with other indicators.
Overall, stable and correct identification results are difficult to be obtained by any single damage identification method. This feature further demonstrates the need for D-S evidence theory which can integrate the information from different types of damage identification methods. Considering the limitations of the traditional D-S evidence theory, the traditional D-S evidence theory, Deng’s method and the proposed improved D-S evidence theory are adopted to compare their performances in locating the damage in the pipe as shown in Fig. 6. The damage identification recognition results of various methods are compared by structural damage identification evaluation index as shown in Table 3. Conflict evidence detection threshold are set to 0.5.
Table 3Comparison of different identification methods using evaluation index λ
Damage case | First-order CMSC | Second-order CMSC | MFC | Traditional method | Deng’s method | Proposed method |
G1 | 0.231 | 0.180 | 0.235 | 1.556 | 1.581 | 2.289 |
G2 | 0.696 | 0.107 | 0.532 | 1.564 | 1.734 | 3.672 |
G3 | 0.927 | 0.229 | 0.864 | 1.347 | 1.581 | 4.969 |
G4 | 1.503 | 0.522 | 1.203 | 3.650 | 3.291 | 6.748 |
Fig. 6 presents the identification results for traditional D-S evidence theory, Deng’s method and the proposed method based on improved D-S evidence theory. From Fig. 6(a), for single damage case G1, it is seen that there is a peak at 10th node of the fusion results of the proposed improved D-S evidence theory. Though the exact damage location are not confirmed between adjacent elements of the 9th and 10th element, a much better estimation is still obtained than traditional D-S evidence theory and Deng’s method. According to Table 3, the value of evaluation index of the proposed method are apparently higher than the value of any single damage identification method, traditional D-S theory and Deng’s method, namely the proposed method performs much better in locating damage. For single damage case G2, it can be observed from Fig. 6(b) that the damage location are precisely detected by the proposed method and the values corresponding to the damaged elements are higher than that of traditional D-S theory and Deng’s method. Similarly, the proposed method provides more accurate and reliable damage identification in locating damage according to Table 3.
Fig. 2Identification results of case G1
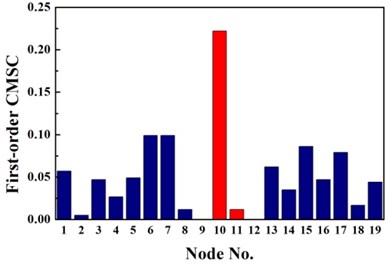
a) First-order CMSC
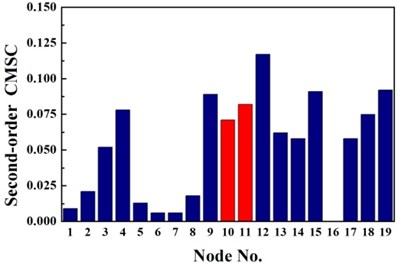
b) Second-order CMSC
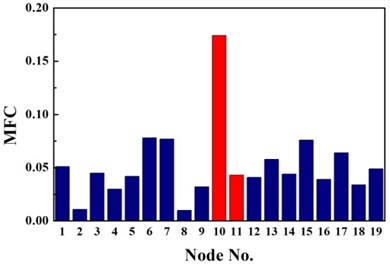
c) MFC
Fig. 3Identification results of case G2
a) First-order CMSC
b) Second-order CMSC
c) MFC
For double damage case G3, it can be observed from Fig. 6(c) that the damage locations are precisely detected by the proposed method but 19th element is mistaken for damaged element. More accurate identification result is obtained than traditional D-S theory and Deng’s method .The proposed method definitely reduce the number of the suspected damaged elements of 4th, 9th, 15th, 10th, 16th, 17th and 19th element. According to Table 3, the value of evaluation index of the proposed method is more than three times higher that of traditional D-S theory and Deng’s method. For double damage case G4, Fig. 6(d) presents that the proposed method clearly indicate the damage location and the mistake of partially missing the damaged element of 4th element is avoided. The superiority of the proposed method could also be verified according to Table 3.
Fig. 4Identification results of case G3
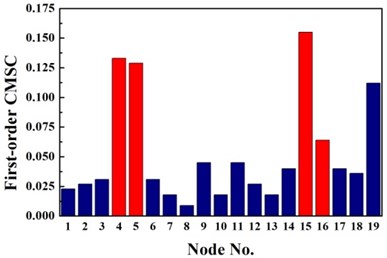
a) First-order CMSC
b) Second-order CMSC

c) MFC
Fig. 5Identification results of case G4
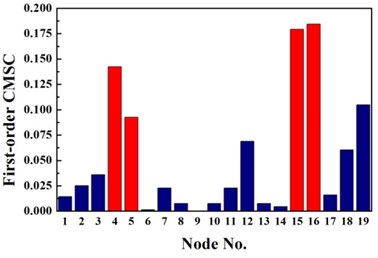
a) First-order CMSC
b) Second-order CMSC
c) MFC
6. Conclusions and future work
An improved D-S evidence theory is proposed for pipeline damage identification. Taking into account of the results of experimental investigation on pipes, the following conclusions can be drawn:
1. A new damage identification evaluation index is developed to compare the performance of different identification methods quantitatively. It is demonstrated that the evaluation index can visually indicate the effectiveness of the different identification methods.
2. Damage identification methods based on evidence theory provides more accurate damage assessment than single damage identification method. Experimental results illustrate the ability of the proposed approach in improving the performances of damage identification results both in the case of single damage scenarios and in the case of double damage scenarios.
3. Compared with the traditional D-S evidence theory and Deng’s method, the proposed one shows a better performance in damage identification, and it emphasizes the values of damage indicators corresponding to the damage members and, at the same time, leads to a significant reduction of the value of the indicators of the undamaged members.
Future work is considered to develop an improved approach to get the consensus evidence on the weighted average method by employing the probability distribution concept in Liu et al. [20].
Fig. 6Damage identification results based on different methods
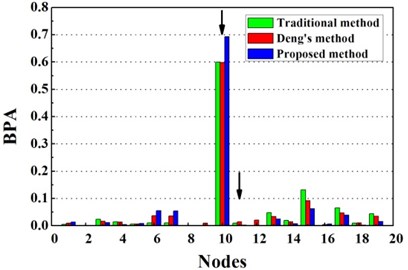
a) Evidence theory fusion results of case G1
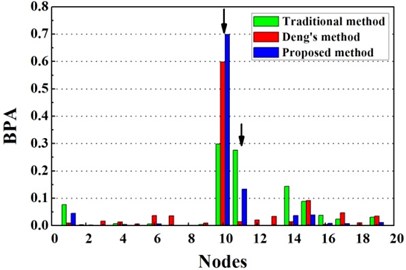
b) Evidence theory fusion results of case G2
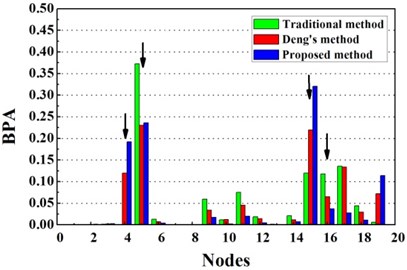
c) Evidence theory fusion results of case G3
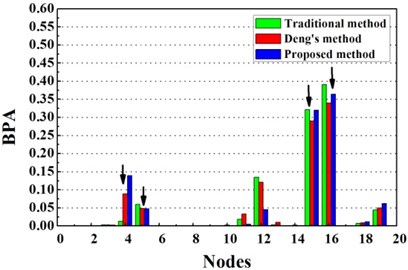
d) Evidence theory fusion results of case G4
References
-
Sohn H., Farrar C., Hunter N., Worden K. A Review of Structural Health Monitoring Literature: 1996–2001. Los Alamos National Laboratory Report, Los Angeles, 2003.
-
Carden E. P., Fanning P. Vibration based condition monitoring: a review. Structural Health Monitoring, Vol. 3, Issue 4, 2004, p. 355-377.
-
Fan Wei, Qiao Pi-Zhong Vibration-based damage identification methods: a review and comparative study. Structural Health Monitoring, Vol. 10, Issue 1, 2011, p. 83-111.
-
Farrar Charles R., Jauregui David A. Comparative study of damage identification algorithms applied to a bridge: I. Experiment. Smart Materials and Structures, Vol. 7, 1998, p. 704-719.
-
Grosso Andrea del, Lanata Francesca A long-term static monitoring experiment on R.C. beams: damage identification under environmental effect. Structure and Infrastructure Engineering, Vol. 10, Issue 7, 2014, p. 911-920.
-
Wu Wei-Wei, Bao Li-Na Target identification based on neural network and D-S evidence theory. Proceedings of the International Conference on Industrial Control and Electronics Engineering, 2012, p. 1485-1487.
-
Li Bo, Pang Fu-Wen An approach of vessel collision risk assessment based on the D-S evidence theory. Ocean Engineering, Vol. 74, Issue 2, 2013, p. 16-21.
-
Wu Zhao-Fu, Gao Fei Image classification based on Dempster-Shafer evidence theory and neural network. Proceedings of 2nd WRI Global Congress on Intelligent Systems, Vol. 2, 2010, p. 296-298.
-
Luo He, Yang Shan-Lin, Hu Xiao-Jian, Hu Xiao-Xuan Agent oriented intelligent fault diagnosis system using evidence theory. Expert Systems with Applications, Vol. 39, Issue 3, 2012, p. 2524-2531.
-
Basir Otman, YuanXiao-Hong Engine fault diagnosis based on multi-sensor information fusion using Dempster-Shafer evidence theory. Information Fusion, Vol. 8, Issue 4, 2007, p. 379-386.
-
Jiang Shao-Fei, Fu Chun, Zhang Chun-Ming A hybrid data-fusion system using modal data and probabilistic neural network for damage detection. Advances in Engineering Software, Vol. 42, Issue 6, 2011, p. 368-374.
-
Guo H. Y. Structural damage detection using information fusion technique. Mechanical Systems and Signal Processing, Vol. 20, Issue 5, 2006, p. 1173-1188.
-
Li Hui, Bao Yue-Quan, Ou Jin-Ping Structural damage identification based on integration of information fusion and Shannon entropy. Mechanical Systems and Signal Processing, Vol. 22, Issue 6, 2008, p. 1427 1440.
-
Guo H. Y., Li Z. L. A two-stage method to identify structural damage sites and extents by using evidence theory and micro-search genetic algorithm. Mechanical Systems and Signal Processing, Vol. 23, Issue 3, 2009, p. 769-782.
-
Bao Yuequan, Li Hui, An Yonghui, Ou Jinping Dempster-Shafer evidence theory approach to structural damage detection. Structural Health Monitoring, Vol. 11, Issue 1, 2011, p. 13 26.
-
Deng Yong, Shi Wenkang, Zhu Zhenfu Efficient combination approach of conflict evidence. Journal of Infrared, Millimeter and Terahertz Waves, Vol. 23, Issue 1, 2011, p. 27-32.
-
Dempster A. Upper and lower probabilities induced by multi-valued mapping. Annals of Mathematical Statistics AMS-38, 1967, p. 325-339.
-
Shafer G. A Mathematical Theory of Evidence. Princeton University Press, Princeton, NJ, 1976.
-
Jousselme A., Grenier D., Bosse E. A new distance between two bodies of evidences. Journal of Information Fusion, Vol. 2, Issue 2, 2001, p. 91-101.
-
Liu X., Ghorpade A., Tu Y. L., Zhang W. J. A novel approach to aggregation of probability distribution. Information Sciences, Vol. 188, Issue 16, 2012, p. 269-275.
About this article

This research was supported by the National Natural Science Foundation of China (Grant No. 51175178).
