Abstract
Computer-aided diagnosis system of leukemic cells is vital tool, which can assist domain experts in the diagnosis and evaluation procedure. Accurate blast cells segmentation is the initial stage in building a successful computer-aided diagnosis system. Blast cells segmentation is still an open research topic due to several problems such as variation of blats cells in terms of color, shape and texture, touching and overlapping of cells, inconsistent image quality, etc. Although numerous blast cells segmentation methods have been developed, only few studies attempted to address these problems simultaneously. This paper presents a new image segmentation method to extract acute leukemia blast cells in peripheral blood. The first aim is to segment the leukemic cells by mean of color transformation and mathematical morphology. The method also introduces an approach to split overlapping cells using the marker-controlled watershed algorithm based on a new marker selection scheme. Furthermore, the paper presents a powerful approach to separate the nucleus region and the cytoplasm region based on the seeded region growing algorithm powered by histogram equalization and arithmetic addition to handle the issue of non-homogenous nuclear chromatin pattern. The robustness of the proposed method is tested on two datasets comprise of 1024 peripheral blood images acquired from two different medical centers. The quantitative evaluation reveals that the proposed method obtain a better segmentation performance compared with its counterparts and achieves remarkable segmentation results of approximately 96 % in blast cell extraction and 94 % in nucleus/cytoplasm separation.
1. Introduction
Leukemia is a group of heterogeneous blood-related cancers, with difference in its aetiology, pathogenesis, prognosis and response to treatment [1]. Acute leukemia can be classified into two major types, Acute Lymphoblastic Leukemia (ALL) and Acute Myelogenous Leukemia (AML). Peripheral blood (PB) morphological examination is the most economical procedure for initial screening of acute leukemia [2]. The downside of this procedure includes labor intensive laboratory routines. In addition, it is subject to human error, inter-observer variation and requires highly trained experts [3, 4]. Computer-aided acute leukemia diagnosis system based on image processing techniques avoids human error factors and offer a standard and reproducible clinical laboratory procedure [5]. The initial step of such system is blood cell segmentation, in which each cell of interest is separated from the surrounding components. It is imperative for any blast cell segmentation algorithm to preserve blast cells characteristics in order to obtain correct features, and eventually establish a correct diagnosis.
The segmentation stage is challenging and difficult due to the following reasons: (1) Variegation of color, illumination and staining quality in PB images as well as the diversity found in the shape, texture and color of the blast cells and its internal components. (2) Individual cell localization and extraction into a sub-image. (3) Adjacency and overlapping of cells.
Several attempts have been made to segment blast cells in PB images. When blast cells are solitarily scattered over the background and do not overlapped with any red blood cell (RBCs) or white blood cell (WBCs), straightforward methods such as thresholding [6-9], edge detection [3, 10], and unsupervised clustering [4] are usually sufficient for extracting the blast cells. In case if any noisy fragments are found in the results, it is possible to clean these results by applying morphological operations [11] or tracking the segmented cell boundaries using active contour model [10]. These methods assumed that the blood images have a uniform background with high contrast cell boundaries. These methods mainly focused on the segmentation of solitarily scattered blast cells. However, in many situations blast cells clump together forming cell clusters. These clusters should be decomposed individually for accurate feature extraction.
On the other hand, several other methods attempted to separate overlapped blast cells. Many of these methods used the watershed segmentation based on distance transform [12-18] where the regional minima of the distance map image were used as markers for subsequent segmentation using the watershed algorithm. The main drawback of this method is the over-segmentation due to the presence of many regional minima [19]. As an attempt to overcome the over-segmentation problem, marker-controlled watershed based on -minima transform was used in [20]. The -minima transform is an effective tool to suppress regional minima with depth lower than a predefine threshold constant . Although the -minima transform reduce the effects of over-segmentation on the final watershed segmentation results, estimating the optimal -value is considerably difficult and often require a tedious trial-and-error process [21].
Concavity analysis was also used for the same purpose [22]. This approach assumes that the overlapped cells can be split by one line joining two specific cut points where the boundary curvature abruptly changes. This technique is hampered by the overlapping degree between cells and it requires highly accurate process in order to determine the concave points [23].
Most of the methods presented in the literature were implemented on one type of blast cells, ALL [3, 10, 11, 18, 20] or AML [11-17]. While these blast cell segmentation methods were able to recognize one type of blast cells up to certain extent; these methods are yet to be tested with a dataset that includes both acute leukemia types. The reason behind using one type of blast cell could be the lack and privacy of medical data which is an intrinsic problem in research involving medical data. Moreover, most of the previously proposed segmentation algorithms were not tested quantitatively against ground truth images segmented manually by a domain expert as the lack of a ground truth dataset which require a domain expert to be involved is another intrinsic problem in research involving medical data [24].
Although most of the segmentation methods focused on extracting blast cells, there exist several algorithms for segmenting the blast cell’s nucleus region. Threshold-based segmentation using grayscale image was used in [4] to separate the nucleus region from the cytoplasm region. The method in [18] found that the threshold-based segmentation implemented on a combination of the green component image of the RGB color and the component image of the CIELab color space can produce a better result than just using the threshold on a grayscale image. Other segmentation algorithm such as edge detection [10] and pixels clustering [4] were also used for the same purpose.
In this paper, our main purpose is to develop a new algorithm based on image processing techniques to segment acute leukemia blast cells in PB smear images. The proposed algorithm consists of three main steps: image cleaning, splitting touching cells, and nucleus/cytoplasm separation. At first, the image cleaning step is performed to remove the unwanted blood components such as RBC and plasma background, while highlighting the blast cells and making it more prominent. This step is carried out using color contract enhancement and color transformation. Marker-controlled watershed combined with a new marker selection scheme to identify blast cells location was used to separate touching blast cells. The proposed marker selection scheme incorporates domain specific knowledge into the definition of the marker locations in order to avoid cells over-segmentation. The nucleus/cytoplasm separation process is accomplished using seeded region growing algorithm powered by histogram equalization and arithmetic addition. In most cases, nuclear chromatin structure is non-homogenous. Therefore, histogram equalization and arithmetic addition are used to correct the nuclear pixels homogeneity. Unlike standard segmentation techniques such as image thresholding and edge detection which neglect all of the spatial information in the image, the seeded region growing performs the nucleus/cytoplasm separation with respect to the spatial relationships of neighboring pixels in the nuclear region.
2. Methodology
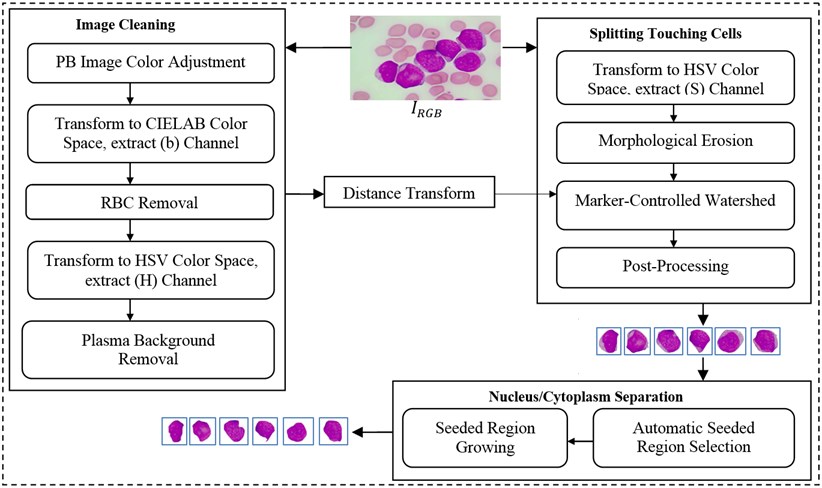
In this study, we developed a novel method to segment acute leukemia blast cells and their internal components (nucleus and cytoplasm) in PB microscopic images. The proposed method consists of three stages: (1) image cleaning, (2) splitting touching cells, and (3) nucleus/cytoplasm separation. The flowchart of our segmentation method is given in Fig. 1. The details of each stage are explained in the following subsections.
Fig. 1Flowchart of the proposed segmentation method
2.1. Image cleaning
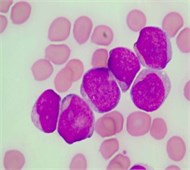
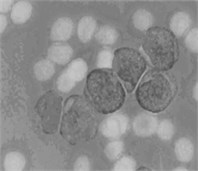
During the initial experiment, it has been observed that simply converting the input color PB image (Fig. 2(a)) into a grayscale produces unsatisfactory segmentation results. This is because the contrast between the blast cell pixels and other blood component pixels in the grayscale is typically not adequate to cluster the blast cell pixels precisely.
The color PB image contains huge amount of information about each blood component and their specific characteristics. In order to prominently highlight the color difference between all the blood components, the color input image () was adjusted using color contrast adjustment. The input image was decomposed into red, green and blue represented as , and respectively. Each color component has minimum and maximum intensity level as and , respectively, where (0). The transformation in Eq. (1) was used to adjust each individual color component to full gray level range [0,..., 255]:
where denoted any input color channel image, and corresponded to the output. Afterward, the three adjusted color channels were merged together to form the new color image as shown in Fig. 2(b). The image was then transformed to the CIELab color space. By analyzing the CIELab color components, it has been observed that the color component which represents the variation from (blueness) to (yellowness) makes the RBCs appear more vivid as compared to the nucleus and the cytoplasm of the blast cell. This is because the yellow color is present in the RBCs, while it is almost absent in the blast cells. Due to immaturity characteristics of the blast cell, a pixel-to-pixel discontinuity appears in the nuclear region of the component image. This could be due to the non-homogeneous nuclear chromatic pattern. The pixel discontinuities in the component image were enhanced with median filter (Fig. 2(c)). Afterward, the image was processed with Otsu threshold to obtain the RBCs mask as shown in Fig. 2(d). Using the RBCs binary mask, All the RBCs was removed from the original image (Fig. 2(e)). To this end, only the blast cells and the plasma background were retained in the PB image. The identification of the plasma background pixels was made possible by transforming the image to the HSV color model. It has been found that the H component of the HSV color model is significantly adequate to distinguish between the blast cell pixels and the plasma pixels as foreground and background, respectively (Fig. 2(f)).
Based on this color feature, the plasma pixels were easily removed from the using Otsu threshold. The resultant image was further improved with morphological holes filling and morphological opening in order to close any holes caused by the threshold process and to smooth the blast cells contour. The blast cells binary mask is shown in Fig. 2(g).
Fig. 2PB image cleaning: a) original image, b) adjust color image, c) b component, d) RBCs mask, e) image after removing the RBCs, f) H Component, g) the blast cells binary mask
a)
b)
c)
d)
e)
f)

g)
2.2. Splitting touching cells
For the segmentation of touching cells, we proposed to use the marker-controlled watershed based on a new marker selection scheme. Marker-controlled watershed transform relies on two key steps: extracting markers and modifying the gradient image.
Markers identification is an essential step in a successful implementation of a marker-controlled watershed algorithm. In the context of blast cells segmentation, markers represent the blast cell locations, from which flooding starts. Conventional watershed algorithm is widely used for separating touching cells. It directly uses region minima of a distance map image as markers [25]. Although this method can separate touching cells; its main drawback is being prone to over-segmentation/under-segmentation since identifying markers more than the actual number of cells leads to over-segmentation while defining single marker for clumped cell yields under-segmentation. The marker-controlled watershed algorithm uses predefined markers instead of the distance map region minima. In this work, a new marker selection scheme to locate exactly a single cell marker for each blast cell is developed.
In PB smear, the nuclei are usually appearing in purple color. As shown in Fig. 3(a), the component of the HSV color model expose the purple color of the nuclei as the highest saturated regions. Using this powerful feature, the blast cells location was efficiently identified. The component image was transformed into binary image and further processed with morphological erosion in order to eliminate any other saturated components such as platelets which are also stained with purple color however; they are much smaller in terms of size than the nuclei. The resulted markers in Fig. 3(b) describe the exact number and location of the blast cell where each identified markers represent a one-to-one mapping with the blast cells. These markers were used as a set of regional minima (Fig. 3(c)) from which the watershed will simulate the rising waters.
The marker-controlled watershed depends not only on the markers but also on the marking function which represents the topographic surface flooded by water. A good marking function should synthesize physical characteristics of the objects to segment and have different markers and catchment basins characterizing the desired objects. The inverse inner distance map was chosen as the marking function. The binary mask presented in Fig. 2(g) was transformed into a distance map by inner distance transformation, which computes the minimum Euclidean distance from every foreground (blast cell region) pixel to a background pixel. Let be a binary image and let and denotes the sets of foreground and background pixels, respectively. The distance function associates each pixel with its distance to the nearest zero-valued pixel is define as:
where is the Euclidean distance between and . It should be noted that the distance map was only used to define the marking function. The regional minima of the inverse inner distance map were not used as markers, instead, the markers generated based on the priori color information obtained from color component were used.
To impose the selected markers demonstrated in Fig. 3(b) on the distance map image, the marker imposition technique based on morphological reconstruction operation was performed. This process suppresses all the regional minima which are not marked by the marker selection scheme. In our work, the marker image was automatically selected in such a way that each marker is representing a particular blast cell. Minima imposition with such markers guarantees that the watershed line will not segment a single cell into many regions. The marker image was defined as in Eq. (3) for each pixel :
The minima imposition was performed by computing the pointwise minimum between the distance map image and the marker image as . This procedure enforces the connected region masked by to be the regional minima of . Then, a morphological reconstruction by erosion of from the marker image defined as in Eq. (4) was implemented to recover all image information contained in except those region masked by :
Fig. 3(c) illustrates the imposed markers on the distance map image (The markers in Fig. 3(c) are highlighted with green color for illustration purposes), while Fig. 3(d) demonstrates the blast cells after applying the marker-controlled watershed algorithm.
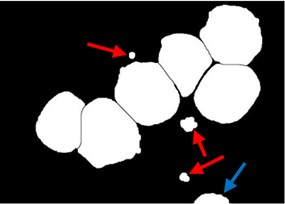
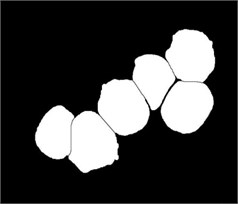
A post-processing step was dedicated to rule out any clutters retained such as the false positive particles presented in Fig. 3(d) (indicated with red arrow). These particles could be retained due to the high density color at the RBCs border. It is also necessary to remove all blast cells connected to the image border such as the small part of a blast cell presented in Fig. 3(d) (indicated with blue arrow) as these cells introduce some bias and could give wrong feature measurement. As illustrated in Fig. 3(e), all these particles were eliminated using the morphological reconstruction by dilation based on the blast cells markers image . This process retains only the blast cells which are represented by the markers. At this point, the blast cell sub-images were produced automatically by cropping each cell using the minimum bounding box.
Fig. 3Marker-Controlled Watershed segmentation steps: a) S component, b) identified markers, c) distance map image after minima imposition, d) segmented blast cells, e) segmented blast cells after removing noisy fragments, f) segmented blast cells boundaries highlighted with red color superimposed on the original PB image
a)
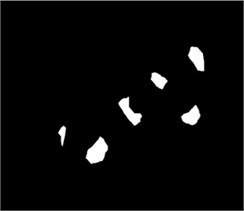
b)
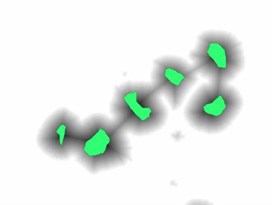
c)
d)
e)
f)
2.3. Nucleus/cytoplasm separation
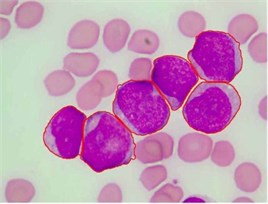
Blast cells are characterized by immature nuclear chromatin pattern [26]. It has been observed that nucleus shape and chromatin structure varies from one blast cell subtype to another. Fig. 4(a) shows a blast cell sub-image with non-homogenous nuclear chromatin and blur nuclear-cytoplasmic margin in some areas. Finding a consistent segmentation method to handle the non-homogeneity of the blast cell nucleus region has always been a complex task.
The proposed nucleus/cytoplasm separation algorithm delineates nucleus boundaries using a priori color information obtained from the saturation color component and combined with the seeded region growing (SRG) segmentation algorithm proposed by Adams and Bischof in [27].
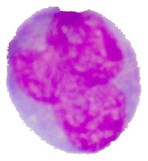
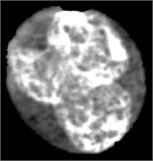
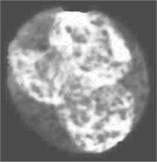
In this work, the seeded region was selected automatically. As mentioned earlier, the saturation component of the HSV color space makes the nuclear region appears as the brightest region in the image. Hence, the input sub-image was converted into HSV color space in order to extract the saturation component. The non-homogeneity in the nuclear region is prominently appears in the saturation image shown in Fig. 4(b). In order to reduce the non-homogeneity in the nuclear region pixels, the saturation image was processed with histogram equalization (Fig. 4(c)). Later, both the saturation image in Fig. 4(b) and the enhanced one in Fig. 4(c) were arithmetically added together. The seeded region was generated automatically by converting the image in Fig. 4(d) into a binary image (Fig. 4(e)) and then shrunk the resulted region using morphological erosion. The two images shown in Fig. 4(d) and (f) were used as an input to the SRG algorithm. The SRG works iteratively starting at the seeded region R and continue to assign neighboring pixels that satisfy a predefined similarity criterion. The similarity criterion was chosen to be the difference between the mean intensity of the grown region and the intensity of the unlabeled neighboring pixels. Then the grown region is given by the following algorithm (Table 1).
The PT is generally referred to as the maximum intensity distance satisfying all the blast cell sub-images to reliably separate the nuclear region from the cytoplasm region. Using a trial and error procedure for inspecting the segmentation performance of all the blast cell sub-images for all possible PT levels in between 0 to 255, the optimum PT value satisfying all the blast cell sub-images was determined to be PT = 51. The final result of the grown nuclear region is shown in Fig. 4(g) where the outline of the grown nuclear region is highlighted with blue color.
Table 1SRG algorithm
1: | Input: , |
2: | Output: Grown region |
3: | |
4: | Repeat |
5: | For each neighboring pixel of |
6: | if is unassigned and Predefined Threshold (PT) |
7: | |
8: | Update |
9: | end |
10: | end |
11: | Until no more pixels are added to |
12: | Grown region = |
Fig. 4Nucleus/Cytoplasm separation steps: a) original sub-image, b) saturation band, c) saturation band after histogram equalization, d) resulted image after arithmetic addition of b) and c), e) binary version of image presented in d), f) seeded region, g) segmented nucleus boundaries superimposed on the original sub-image
a)
b)
c)
d)
e)

f)
g)
3. Experimental results
3.1. Dataset
In this work, two datasets of PB images were used. The main dataset (Dataset-A) was obtained from the University of Malaya Medical Center (UMMC) located in Kuala Lumpur, Malaysia. The PB slides were stained with May-Grünwald-Giemsa (MGG) staining and the PB digital images were captured by a charged coupled device camera (Olympus UC30) mounted on a light microscope (Olympus CX31) using high magnification power of 100x with oil immersion. The images contain 2080×1544 pixels. This dataset consists of 991 PB images containing 1303 blast cells, 325 ALL (L1-L2-L3) and 978 AML (M1-M2-M3-M4-M5-M7). All the images were verified and classified by a hematologist. The number of captured images was solely dependent on the availability of the PB smears provided by UMMC. Due to the lack of sufficient data, two sub-types of AML (M0 and M6) were not included.
For the purpose of validating the robustness of the proposed segmentation approach, a second dataset of PB images (Dataset-B) was obtained from a public image repository (ALL-IDB) [28]. The images in this dataset were collected by the experts at the M. Tettamanti Research Centre for childhood leukemia and hematological diseases, Monza, Italy. It contains only one type of blast cells (ALL) in 33 images out of 108 and the total number of labeled blast cells is 267. This dataset was used for the purpose of cell segmentation and classification in many researches [3, 18].
A gold standard dataset was obtained by manually segment each blast cell and its internal part (nucleus/cytoplasm). This process was carried out under a direct supervision of a hematologist for all the images in Dataset-A and Dataset-B. The segmentation evaluation was performed by comparing the accuracy of the proposed segmentation approach against the manually segmented gold standard images.
3.2. Segmentation evaluation
In order to evaluate the segmentation results quantitatively, two image segmentation evaluation protocols: the Relative Ultimate Measurement Accuracy for Area () and the Misclassification Error () were employed. These two protocols are widely used in the evaluation of various segmentation algorithms and they were highly acknowledged as reliable segmentation evaluation protocols [29]. The protocol measures the relative percentage of area discrepancy and it is defined as:
where represents the area size of the gold standard region and is the area size of the region extracted using the computer-based segmented image. measure the percentage of background pixels wrongly assigned to foreground and conversly, the number of foreground pixels wrongly assigned to the background. It is defined as:
where is the background of the gold standard image, is the background of the segmented image, is the foreground of the gold standard image, is the foreground of the segmented image, while the domenator represents the number of pixels in the gold standard image. The quantitative evaluation of both protocols is inversely proportional to the segmentation quality, the smaller the value the better the result. Hence, a value of 0 will result if both the manual and the segmented cell are completely identical, and a value of 100 will result if the segmented region is not detected. The evaluation results of the segmented blast cell regions and nuclear regions compared to the gold standard data are given in Table 2.
4. Discussion and final remarks
The performance test was conducted on two different datasets of PB images. Dataset-A consisted of two acute leukemia types (ALL and AML) with total number of 991 high-resolution PB images (1303 blast cells) collected from the UMMC, Kuala Lumpur, Malaysia. The blast cells in this dataset were further categorized according to their subtypes by a hematologist. Dataset-B [28] contained only one type of blast cells (ALL), 33 images out of 108 contained blast cells and the total number of labeled blast cells was 267.
Table 2Evaluation of the proposed segmentation approach
Blast cells types | Blast region | Nucleus region | |||
ALL(L1-L2) | (Dataset-A) | 3.50±4.31 | 3.35±3.47 | 3.02±3.82 | 3.20±3.60 |
ALL (L3) | 3.19±2.31 | 2.96±1.55 | 8.80±9.51 | 4.70±3.85 | |
Overall (ALL) | 3.35±0.22 | 3.16±0.27 | 5.91±4.08 | 3.95±1.05 | |
AML(M1) | 4.43±3.38 | 5.30±2.70 | 3.74±2.24 | 4.85±2.72 | |
AML(M2) | 4.12±2.53 | 3.59±2.58 | 3.00±2.81 | 3.82±2.50 | |
AML(M3) | 6.54±3.97 | 3.98±1.89 | 4.22±4.93 | 3.55±2.91 | |
AML(M4) | 1.31±1.15 | 1.93±0.92 | 2.54±4.67 | 1.99±2.06 | |
AML(M5) | 3.73±2.59 | 2.71±2.08 | 2.78±3.80 | 2.76±2.57 | |
AML(M7) | 8.33±8.30 | 4.93±4.22 | 5.68±7.57 | 4.93±4.78 | |
Overall (AML) | 4.74±2.42 | 3.74±1.28 | 3.66±1.17 | 3.65±1.15 | |
ALL | (Dataset-B) | 3.46±2.03 | 4.14±1.54 | 7.19±4.46 | 5.28±1.59 |
Overall (Dataset-A and Dataset-B) | 3.97±0.98 | 3.76±0.52 | 5.59±1.78 | 4.29±0.86 | |
The main objective of using two datasets was to test the robustness of the proposed method using images acquired under different acquisition factors that could affect the quality of the images such as, camera and microscope in use, staining quality and, illumination. The segmentation result of images in Dataset-A was detailed to the subtype’s level.
In fact, evaluating a segmentation algorithm with images collected from different sources while obtaining highly accurate results indicate that, the performance of the segmentation algorithm is robust and reliable in the real-world application scenario.
The proposed segmentation method was able to extract 1567 out of 1570 complete blast cells with their respective nuclei from 1024 PB images at average error rate of 3.97 %, 3.76 % using and , respectively. Whereas, the average error rate for segmenting the nuclear region was 5.59 % and 4.29 % in and, respectively.
As shown in Table 2, the proposed approach was able to extracted the blast cell’s region of the three ALL subtypes (L1-L2-L3), at low average error rate in and of 3.35 %, and 3.16 %, respectively. In ALL, the region that is adjacent to the surrounding blood components (RBCs and plasma background) is mostly the nucleus, and the nucleus color of ALL blast cells are significantly different from these adjoining blood components. However, the average segmentation error rate of ALL (L1-L2-L3) nuclear regions in and were as high as 5.91 %, and 3.95 %, respectively. This was mainly caused by the deep-blue color cytoplasm of the (L3) subtype which is analogous to the color of the nucleus in many of the L3 samples.
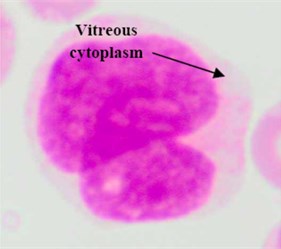
Regarding the AML blast cells extraction, there are a few discussable points that can be inferred from Table 2. The overall average segmentation error rate of the AML blast cell’s region in , and was 4.74 %, and 3.74 % respectively. Generally, the error rate of the AML blast cell’s region segmentation was higher than that of the ALL class. The main reason was considerably related to the segmentation of the two AML subtypes: M3 and M7 where the error rate in for both subtypes were as high as 6.54 % and 8.33, respectively (Table 2). As shown in Fig. 5(a) the RBCs color is analogous to the M3 cytoplasm color. This is because the M3 cytoplasm region is usually stained as bright pink or red color [30]. In some other cases the M3 cytoplasm had a vitreous color as illustrated in Fig. 5(b). These two situations led to low gradient color along the cell edges. Therefore, the segmentation error rate of these AML subtypes was higher than the others.
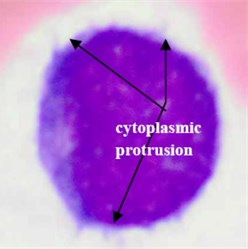
Concerning AML (M7), this subtype shows protrusion or budding (“blebs”) at the edge of the cytoplasm [30] as shown in Fig. 5(c). This cytoplasmic protrusion has not been detected properly. This is mainly caused by the smoothing process carried out using the median filter applied on the component image as well as applying the morphological opening operation on the binary version of the hue component image for the purpose of smoothing the blast cells contour and removing pixels that caused two objects to be touched by a thin connection. However, these two smoothing operations tremendously contributed to the segmentation of the other blast cell subtypes.
Fig. 5Blast region segmentation difficulties in AML: a) erythrocytes color is analogues to M3 cytoplasm color, b) M3 blast with vitreous cytoplasm, c) M7 with protrusion cytoplasm
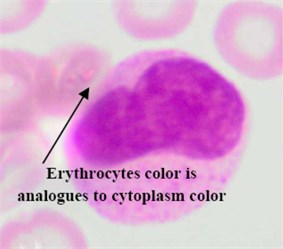
a)
b)
c)
On the other hand, the proposed method segmented the nuclear region of AML blast cells with higher accuracy compared to ALL. All the AML subtypes had considerably distinguishable intensity contrasts between the nucleus and the cytoplasm, which can be easily, detected using the SRG algorithm. However, the M7 nuclear region showed lower segmentation accuracy than other AML subtypes. A possible explanation for this might be that the M7 subtype is a Lymphoblast-like [31] and some of the M7 blast cells have a dark cytoplasm region such as that in the ALL (L3), which make the separation between the nucleus and cytoplasm of this subtype difficult and error prone. Nevertheless, the overall average error rate of the AML nuclear region in , and was only 3.66 %, and 3.65 %, respectively. These results are quite promising.
Table 2 also reports the segmentation evaluation of the blast cells in Dataset-B. The segmentation error rate of the ALL blast cell’s region in Dataset-B is quite comparable to that of Dataset-A. However, the segmentation error rate for the ALL nuclear region in Dataset-B was higher than that of both types of blast cells in Dataset-A. This was mainly due to the low microscope magnification power used to acquire Dataset-B images, where the cellular details were not adequately distinguishable. In fact, Low magnification power increases the field of view; at the same time, it makes the blood cells look smaller causing a decrease in the cellular details [32]. This finding confirms the association between high magnification power used to capture the blood images and the image segmentation accuracy.
The overall average segmentation error rate of the proposed approach applied on 1024 PB images acquired from two different sources, was rather encouraging as the proposed method was able to localize approximately all the blast cells. The overall average segmentation accuracy (100-extrcation error rate) of all the localized blast cells from both datasets in for the blast cells and the nuclear region was as high as 96 % and 94 %, respectively. The obtained results corroborated that proposed method can efficiently segment blast cells regardless of the PB image variation in term of color, illumination, staining quality as well as shape, texture, color of the blast cells.
The proposed segmentation method addresses three main problems in blast cells segmentation. These problems are (1) diversity in color, illumination, staining variation, (2) the localization and sub-imaging, (3) the segregation of touching cells. To our knowledge, most of the blast segmentation methodologies in the literature [4, 5, 10, 11, 17, 22] did not address these three problems simultaneously. Many researchers implemented their segmentation method directly on manually cropped sub-image contains single blast cell [5, 10, 22]. Other researchers proposed a solution to localize and extract each blast cell from high-cell population blood images [4, 11]. However, splitting touching cells was not considered. Only a few methods have reported both problems (1 and 2) such as the work in [17]. Nevertheless, this method [17] was not able to segment complete blast cells, resulting in missing cytoplasm region in some cases.
Table 3Performance comparison between the proposed method and the benchmark
Image No. | Manually localized cells | Number of localized cells | Accuracy (%) | ||
[18] | Proposed method | [18] | Proposed method | ||
Image001 | 9 | 5 | 9 | 55 | 100 |
Image002 | 10 | 10 | 10 | 100 | 100 |
Image003 | 12 | 11 | 12 | 91 | 100 |
Image004 | 7 | 4 | 7 | 57 | 100 |
Image005 | 24 | 19 | 23 | 79 | 95 |
Image006 | 18 | 18 | 18 | 100 | 100 |
Image007 | 7 | 7 | 7 | 100 | 100 |
Image008 | 17 | 16 | 17 | 94 | 100 |
Image009 | 7 | 7 | 7 | 100 | 100 |
Image010 | 12 | 12 | 12 | 100 | 100 |
Image011 | 15 | 12 | 15 | 80 | 100 |
Image012 | 12 | 12 | 12 | 100 | 100 |
Image013 | 10 | 7 | 10 | 70 | 100 |
Image014 | 5 | 3 | 5 | 60 | 100 |
Image015 | 17 | 17 | 17 | 100 | 100 |
Image016 | 16 | 16 | 16 | 100 | 100 |
Image017 | 3 | 3 | 3 | 100 | 100 |
Image018 | 8 | 8 | 8 | 100 | 100 |
Image019 | 12 | 12 | 19 | 100 | 100 |
Image020 | 2 | 2 | 2 | 100 | 100 |
Image021 | 3 | 3 | 3 | 100 | 100 |
Image022 | 5 | 5 | 5 | 100 | 100 |
Image023 | 6 | 6 | 6 | 100 | 100 |
Image024 | 4 | 4 | 4 | 100 | 100 |
Image025 | 3 | 3 | 3 | 100 | 100 |
Image026 | 5 | 5 | 5 | 100 | 100 |
Image027 | 3 | 3 | 3 | 100 | 100 |
Image028 | 2 | 2 | 2 | 100 | 100 |
Image029 | 4 | 4 | 4 | 100 | 100 |
Image030 | 3 | 3 | 3 | 100 | 100 |
Image031 | 2 | 2 | 2 | 100 | 100 |
Image032 | 2 | 2 | 2 | 100 | 100 |
Image033 | 2 | 2 | 2 | 100 | 100 |
Total no. of localized cells | 267 | 245 | 266 | ||
Overall accuracy | 92 % | 99.8 % | |||
5. Comparison
In order to show the robustness of our results, the proposed method was compared with two state-of-the-art blast cell segmentation methods proposed by Putzu and Ruberto [18] and Scotti [3]. The localization and segregation of touching blast cells were only compared with the work in [18] as the method in [3] did not address the overlapping cells issue. However, the performance of the proposed nucleus/cytoplasm separation algorithm was compared with both. Both methods in [3, 18] used the same dataset (Dataset-B) reported in [28].
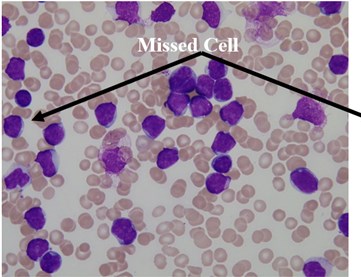
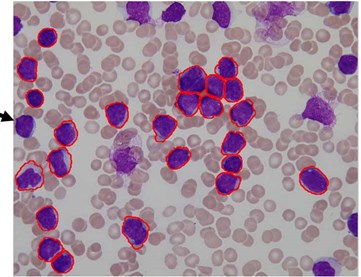
We used this dataset for the purpose of testing the robustness and reliability of our method. Besides, the method proposed in [18] provided a scheme for localization and sub-imaging, splitting the touching blast cells as well as nucleus and cytoplasm separation. These reasons make the work in [18] a good benchmark to be compared with. The method in [18] was tested using the first 33 PB images in Dataset-B which contained 267 labeled cells and the result was reported based on the ability to localize and count the number of blast cells. Some of these images have a high-cell population with many clumped cells such as Image005 (Fig. 6) which contained 24 ALL blast cells. Using our proposed method, we performed the same process as in [18] on these 33 PB images. The performance comparison between the proposed method and the benchmark is reported in Table 3.
The proposed method was able to locate 266 out of 267 labeled cells, resulting in an accuracy rate of 99.8 % whereas the benchmark was only able to locale 245 cells with an accuracy rate of 92 %.
The total number of the missing cells in our approach was only one cell from Image005 as shown in Fig. 6. The blast cell in Image005 was missed because it was very close to the image border as it was removed during the clear border operation.
Fig. 6Segmentation result of Image005: a) original image, b) segmented image using the proposed method
a)
b)
The proposed nucleus/cytoplasm separation algorithm was compared with the methods presented in [18] and [3]. Both of these methods were implemented based on image thresholding using the Otsu threshold [33].
A visual comparison between the results obtained using the proposed method and the methods in [3, 18] are demonstrated in Table 4.
It can be seen that the results obtained using the threshold-based segmentation requires some post-processing work in order to delete noisy regions and to fill holes. In some other cases, the threshold-based segmentation was not able to detect the nuclear region such as the blast cell displayed in row 2. This might be due to the fact that the cytoplasm region is as dark as the nuclear region. Unlike healthy WBCs, the blast cells are characterized with an immature nuclear chromatin pattern [26]. The nucleus of healthy WBCs can be easily segmented using the threshold-based segmentation [34] because the nucleus of healthy WBC is dense and homogenous [35]. However, this immaturity characteristic yields a nucleus with a non-uniform and non-homogeneous texture and color. Consequently, some of the nuclear pixels will be above the selected threshold and others will be below it, resulting in inconsistent results. The performance of the threshold-based segmentation drastically deteriorates for images with blurred object boundaries since it neglects the spatial relationship between pixels [36]. Other methods such as the clustering-based approach [4] and edge detection [10] confronted similar difficulties as these approaches also neglected the spatial information.
The marker-controlled watershed algorithm using the proposed marker selection scheme was compared with the conventional watershed algorithm used in [12-17] to segregate blast cells. In this work, there were 228 identified touching cells with different overlapping scenarios. We compared the conventional watershed transform based on the distance transform with a marker-controlled watershed, as we proposed to use the nuclear region as a marker instead of the distance map regional minima. This approach can tremendously reduce the over-segmentation (under-segmentation). As shown in Table 5, we found that the marker-controlled watershed based on the proposed marker selection scheme outperformed the watershed based on the distance transform and produced only 2 under-segmented cells out of 228, whilst, the watershed based on the distance transform produced 9 over-segmented and 6-undersegmented cells.
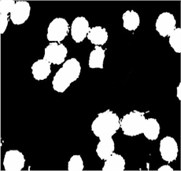
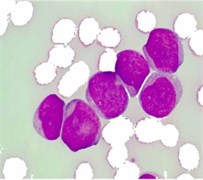
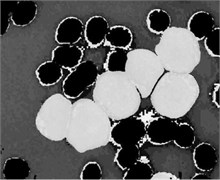
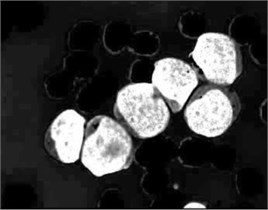
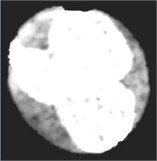
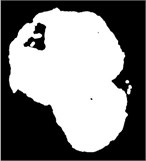
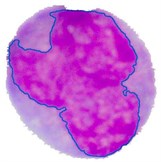
Table 4Comparison of nucleus segmentation results
Original blast cell | Proposed method | [18] | [3] | |
1 |  |  |  |  |
2 |  |  |  |  |
3 |  |  |  |  |
4 |  |  |  |  |
5 |  |  |  |  |
Table 5Comparison between marker-controlled watershed using the proposed marker selection scheme and the conventional watershed algorithm
Experiment name | Watershed based on distance transform | Marker-controlled watershed |
Number of manually counted cells | 228 | |
Correct | 213 (93.4 %) | 226 (99.1 %) |
Missed | 15 (6.6 %) | 2 (0.9 %) |
Over segmented | 9 (3.94 %) | 0 (0.0 %) |
Under segmented | 6 (2.63 %) | 2 (0.9 %) |
The main contribution of the proposed marker selection scheme is in the definition of the blast cell markers using domain-specific knowledge which is represented by using the saturation color channel. Our experiment demonstrates that the proposed scheme is effective in locating precise blast cells markers compared to the conventional watershed algorithm. The proposed scheme differs from its counterpart in two main aspects. First, it defines the markers based on the nucleus color property, whereas the conventional algorithm defines markers based on intensity, gradient, and distance map image without considering the image specific properties. Second, in most of the cases, the regional minima of the distance map identify more markers than the real number of cells, resulting in over-segmentation, and hence; some form of post-processing such as merging process is required [19] to combine falsely segmented regions whilst the proposed scheme produces result with no over-segmented regions.
The novelty of the proposed method is twofold. First, we proposed a comprehensive color channel analysis procedure, which showed that (1) the enhancement of the original RGB image using color contrast stretching makes the blood components (RBC, nucleus, cytoplasm, plasma) highly different from each other in terms of color (2) The channel of the CIELab color space effectively highlights almost all the RBCs in the PB image which can then be easily removed using optimal threshold. (3) The HSV color space was found to be very efficient in highlighting the plasma background through the H color channel, while the Saturation channel was found to be the optimal color channel to highlight the initial seed points of the blast cell nucleus. The determined color channels were the main building block for the blast cells segmentation since it provided a remarkable added value to the final segmentation result. Second, the accuracy of blast cell nucleus segmentation is remarkably important for acute leukemia blast cells classification. However, due to the non-homogeneous nature of the blast cell nucleus chromatic pattern, it has been concluded that segmentation techniques that do not consider the pixels spatial relationship such as image thresholding, edge detection and clustering-based approach could not produce satisfactory results. For that reason, in this work, the SRG was used to separate the nucleus region from the cytoplasm region.
6. Conclusions
Acute leukemia is a group of heterogeneous deadly diseases that affects all ages, and its accurate diagnosis is remarkably important for the reduction of its morbidity and mortality. Microscopic morphological examination of PB is time-consuming and error prone while computer-based acute leukemia diagnosis requires a highly accurate segmentation method. In this paper, a segmentation method for acute leukemia blast cells is presented. Initially, blast cells sub-images are extracted using color transformation along with mathematical morphology and marker controlled watershed. Later, the nucleus region and the cytoplasm are separated using the SRG algorithm. The experiment results show that the proposed method successfully segments nine different subtypes of acute leukemia blast cells and achieves notable segmentation results of approximately 96 % while taking the PB image segmentation difficulties such as color variation, complex nature of the blast cells morphological structure, staining quality, and acquisition settings into account. It also shows that the marker-controlled watershed based on the proposed marker selection scheme is very effective in segregating touching and overlapping cells and outperforms the conventional watershed algorithm. Additionally, the concept of combining histogram equalization and arithmetic addition based on the saturation color component to homogenize the nuclear chromatin pattern with the SRG algorithm significantly contributed to the nucleus/cytoplasm separation process resulting in segmentation accuracy of approximately 94 %. The results are promising and worth to be further investigated in a complete computer-based acute leukemia diagnosis system.
References
-
Bain B. J. Leukemia Diagnosis. John Wiley and Sons, 2010.
-
Angulo J., Klossa J., Flandrin G. Ontology-based lymphocyte population description using mathematical morphology on color blood images. Cellular and Molecular Biology, Vol. 52, Issue 6, 2006, p. 3-16.
-
Scotti F. Automatic morphological analysis for acute leukemia identification in peripheral blood microscope images. International Conference on Computational Intelligence for Measurement Systems and Applications, 2005, p. 96-101.
-
Mohapatra S., Patra D., Satpathy S. An ensemble classifier system for early diagnosis of acute lymphoblastic leukemia in blood microscopic images. Neural Computing and Applications, Vol. 24, Issues 7-8, 2014, p. 1887-1904.
-
Escalante H. J., Montes-y-Gómez M., González J. A., Gómez-Gil P., Altamirano L., Reyes C. A., Reta C., Rosales A. Acute leukemia classification by ensemble particle swarm model selection. Artificial Intelligence in Medicine, Vol. 55, Issue 3, 2012, p. 163-175.
-
Aimi Salihah A. N., Mustafa N., Fazli N. Application of thresholding technique in determining ratio of blood cells for leukemia detection. Proceedings of the International Conference on Man-Machine Systems, Batu Ferringhi, Penang, Malaysia, 2009.
-
Aimi Salihah A., Mashor M., Harun N. H., Rosline H. Color image enhancement techniques for acute leukemia blood cell morphological features. IEEE International Conference on Systems Man and Cybernetics, 2010, p. 3677-3682.
-
Harun N. H., Mashor M. Y., Mokhtar N. R., Aimi Salihah A. N., Hassan R., Raof R. A. A., Osman M. K. Comparison of acute leukemia image segmentation using HSI and RGB color space. 10th International Conference on Information Sciences Signal Processing and their Applications, 2010, p. 749-752.
-
Halim N. H. A., Mashor M. Y., Hassan R. Automatic blasts counting for acute leukemia based on blood samples. International Journal of Research and Reviews in Computer Science, Vol. 2, Issue 4, 2011, p. 971-976.
-
Sadeghian F., Seman Z., Ramli A. R., Kahar B. H. A., Saripan M.-I. A framework for white blood cell segmentation in microscopic blood images using digital image processing. Biological Procedures Online, Vol. 11, Issue 1, 2009, p. 196-206.
-
Madhloom H., Kareem S., Ariffin H. An image processing application for the localization and segmentation of lymphoblast cell using peripheral blood images. Journal of Medical Systems, Vol. 36, Issue 4, 2012, p. 2149-2158.
-
Osowski S., Markiewicz T., Marianska B., Moszczyński L. Feature generation for the cell image recognistion of myelogenous leukemia. IEEE International Conference EUSIPCO, Vienna, Austria, 2004.
-
Markiewicz T., Osowski S., Marianska B., Moszczyński L. Automatic recognition of the blood cells of myelogenous leukemia using SVM. International Joint Conference on Neural Networks, 2005, p. 2496-2501.
-
Markiewicz T., Osowski S. Data mining techniques for feature selection in blood cell recognition. Symposium on Artificial Neural Networks, Bruges, Belgium, 2006.
-
Siroic R., Osowski S., Markiewicz T., Siwek K. Support vector machine and genetic algorithm for efficient blood cell recognition. IEEE Instrumentation and Measurement Technology Conference Proceedings, Warsaw, 2007, p. 1-6.
-
Osowski S., Robert Siroi C., Markiewicz T., Siwek K. Application of support vector machine and genetic algorithm for improved blood cell recognition. IEEE Transactions on Instrumentation and Measurement, Vol. 58, Issue 7, 2009, p. 2159-2168.
-
Nee L. H., Mashor M. Y., Hassan R. White blood cell segmentation for acute leukemia bone marrow images. Journal of Medical Imaging and Health Informatics, Vol. 2, Issue 3, 2012, p. 278-284.
-
Putzu L., Caocci G., Di Ruberto C. Leucocyte classification for leukemia detection using image processing techniques. Artificial Intelligence in Medicine, Vol. 62, Issue 3, 2014, p. 179-191.
-
Logeswaran R., Haw T. W., Sarker S. Z. Liver isolation in abdominal MRI. Journal of Medical Systems, Vol. 32, Issue 4, 2008, p. 259-268.
-
Arslan S., Ozyurek E., Gunduz‐Demir C. A color and shape based algorithm for segmentation of white blood cells in peripheral blood and bone marrow images. Cytometry Part A, Vol. 85, Issue 6, 2014, p. 480-490.
-
Gillibert L., Jeulin D. 3D reconstruction and analysis of the fragmented grains in a composite material. Image Analysis and Stereology, Vol. 32, Issue 2, 2013, p. 107-115.
-
Reta C., Altamirano L., Gonzalez J. A., Diaz R., Guichard S. J. Segmentation of bone marrow cell images for morphological classification of acute leukemia. 23rd International Florida Artificial Intelligence Research Society Conference, Florida, USA, 2010.
-
Díaz G, Manzanera A. Automatic analysis of microscopic images in hematological cytology applications. Biomedical Image Analysis and Machine Learning Technologies: Applications and Techniques: Applications and Techniques, Vol. 167, 2009.
-
Babalola K. O., Patenaude B., Aljabar P., Schnabel J., Kennedy D., Crum W., Smith S., Cootes T. F., Jenkinson M., Rueckert D. Comparison and evaluation of segmentation techniques for subcortical structures in brain MRI. Medical Image Computing and Computer-Assisted Intervention, Springer Berlin Heidelberg, 2008, p. 409-416.
-
Vincent L., Soille P. Watersheds in digital spaces: an efficient algorithm based on immersion simulations. IEEE Transactions on Pattern Analysis and Machine Intelligence, Vol. 13, Issue 6, 1991, p. 583-598.
-
Rubin R., Strayer D. S., Rubin E., McDonald J. M. Rubin’s pathology: clinicopathologic foundations of medicine. Lippincott Williams and Wilkins, 2008.
-
Adams R., Bischof L. Seeded region growing. IEEE Transactions on Pattern Analysis and Machine Intelligence, Vol. 16, Issue 6, 1994, p. 641-647.
-
Labati R. D., Piuri V., Scotti F. All-IDB: the acute lymphoblastic leukemia image database for image processing. 18th IEEE International Conference on Image Processing, 2011, p. 2045-2048.
-
Zhang H., Fritts J. E., Goldman S. A. Image segmentation evaluation: a survey of unsupervised methods. Computer Vision and Image Understanding, Vol. 110, Issue 2, 2008, p. 260-280.
-
Abdul-Hamid G. Classification of acute leukemia. Acute Leukemia – The Scientist’s Perspective and Challenge Rijeka, InTech, Open Access Publisher, 2011.
-
National Cancer Institute. Classification of Adult Acute Myeloid Leukemia.
-
http://www.cancer.gov/cancertopics/pdq/treatment/adultAML/healthprofessional/page2, 2014.
-
Adds J., Larkcom E. Tools, Techniques and Assessment in Biology: A Course Guide for Students and Teachers. Nelson Thornes, 1999.
-
Otsu N. A threshold selection method from gray-level histograms. IEEE Transactions on Systems, Man, and Cybernetics, Vol. 9, Issue 1, 1979, p. 62-66.
-
Madhloom H. T., Kareem Sa, Ariffin H., Zaidan A. A., Alanazi H. O., Zaidan B. B. An automated white blood cell nucleus localization and segmentation using image arithmetic and automatic threshold. Journal of Applied Sciences, Vol. 10, Issue 11, 2010, p. 959-966.
-
Pal G. K., Pal P. Textbook of Practical Physiology, Second Edition. Orient Blackswan, 2006.
-
Wang Z., Song Q., Soh Yc, Sim K. An adaptive spatial information-theoretic fuzzy clustering algorithm for image segmentation. Computer Vision and Image Understanding, Vol. 117, Issue 10, 2013, p. 1412-1420.
About this article

