Abstract
The rotor experiment rig of aero-engine was used to simulate rubbing faults in different rotational speeds, rubbing intensities, rubbing positions and casing thickness. The casing acceleration signal was collected and subjected to the analysis by auto-correlation function frequency spectrum. The result indicates that the auto-correlation function frequency spectrum shows significant characteristic frequency in rubbing frequency (product between blade number and rotating frequency) and its integer multiple. The location of each characteristic frequency is characterized by band-frequency characteristic with rotating frequency as interval. The characteristic is not affected by sensor installed position, rotational speed, rubbing position and casing thickness.
1. Introduction
Rubbing is a kind of common and strongly nonlinear fault in the aero-engine, which can cause tremendous economic loss and casualties [1]. Now, a great many of scholars at home and abroad have made a wide and deep research on rubbing faults and obtained favorable effect. For example, Li Yungong [2] et al., proposed extracting method of rubbing rotor based on measured impulse response. CHEN Xiangmin [3] et al., provided a method for rub-impact diagnosis which was verified to be effective. They combined resonance based sparse signal decomposed with reassigned wavelet scalogram according to the component structure difference of resonance based sparse signal decomposed method. Zhu Ming [4] et al., introduced the generalized S-transformation (GST) into the rub-impact fault diagnosis of rotor system, according to unique characteristic of the GST in dealing with non-stationary signal. The experiment results show that the proposed method can effectively discern the severity of rub-impact. Zeng Ming [5] et al., introduced normalized complex teager energy operator demodulation with rotor rub-impact fault diagnosis and used simulated signal experiments and early rub-impact fault signal verified the excellence and effectiveness of proposed method. Hongliang Yao [6] et al., proposed a detection strategy for rubbing locations in rotor based on the super-harmonic response, and simulations and experiments were carried out to verify the proposed method was effective. Wang Q. [7] et al., decompose AE signal to different frequency-band and combine cross-correlation function via implementing rubbing faults location. Chu F. [8] et al., judge the rubbing location based on a multi-disk rotor system through dynamic stiffness. Han Q. K. [9] et al., combined nonlinear output frequency response function and hybrid model of rotor system to identify rubbing position. A rule extraction method based on the functional point of view is studied [10] by Chen Go et al., and the Iris dataset was adopted to verify the rule extraction method. Finally, rotor-stator rubbing fault data was obtained from an aero-engine rotor experimental rig, and the method was verified correct and rational by the obtained data. Chen Go [11] also introduced one-class support vector machine and the primary component analysis method to recognize rubbing fault. In considering that it was difficult to obtain fault samples, but non-rubbing normal samples were rich in practice, meanwhile, fault signal spectral characteristics were redundant. Ma Hui [12] et al., combining with contact and impact dynamic theories, summarized the development about rub-impact between the rotating blade and casing.
The rubbing fault characteristic of real aero-engine is difficult to obtain due to the limited number of stops, inconvenience of disassembly, and suddenness of rubbing fault. It is important to search for rubbing fault characteristic and discriminate rubbing fault in early stage, which has great economic and important theory value to locate the cause, improve design, avoid tremendous accident and improve work-safety of aero-engine. The aero-engine fault diagnosis is often studied according to casing vibration signal due to the inconvenience of disassembly and structural limit. Aero-engine works under adverse circumstances, and the casing vibration signal is the comprehensive reflection of many parts. The signal distortion, energy attenuation and noise effect, lead to weak casing vibration signal and complexity. Satisfactory result is difficult to be obtained probably, if only using spectrum to analyze casing vibration signal. Autocorrelation function of signal can reserve the periodic component and eliminate noise at the same time, and has wide applications in actual engineering. Accelerate sensor has wide application in aero-engineer state monitor, because it is small, light, installed conveniently character and more sensitive to high frequency. Based on above analysis, the rubbing characteristic analysis method based on casing acceleration signal is proposed. Firstly, the casing acceleration signal of the aero-engine rotor experiment rig is collected. Secondly, autocorrelation function and its frequency spectrum of acceleration signal are obtained. Finally, rubbing characteristic is extracted based on auto-correlation function frequency spectrum.
2. Rubbing experiment
In this paper, all experiment data sources from the aero-engine rotor experiment rig, designed by the Shenyang Aero-engine Design Institute. The experiment rig core-engine is simplified to 0-2-0 support structure, and the compressor is simplified to single disk structure. In single-point rubbing, rubbing position is in turbine casing and different extents of single rubbing experiments can be embodied by adjusting rubbing screw against rubbing ring. The rubbing intensity can be divided into three types: low, medium and serious. Due to the limited space, the rubbing position was selected randomly in turbine casing. A thick wall turbine casing with the average thickness of 7 mm was processed in order to compare casing thickness influence on rubbing characteristic, and the average thickness of thin wall turbine casing is 4 mm. No matter the turbine casting is a thin wall casting or thick, the installation positions of acceleration sensors always include vertical upper, vertical lower, horizontal left and horizontal right. The rubbing positions are as follows: (1) vertical upper, vertical lower, horizontal left and horizontal right when the turbine casing is thin wall. (2) Upper right, lower right, upper left and lower left when the turbine casing is thick wall. The single-position rubbing experiments and sensors installed position diagrams are show in Figs. 1-4.
Fig. 1Thin turbine casing single rubbing experiment: 1-rub spark, 2-tighten bolt rub
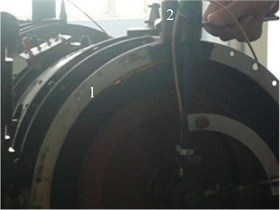
Fig. 2Thick turbine casing single-point rubbing experiment
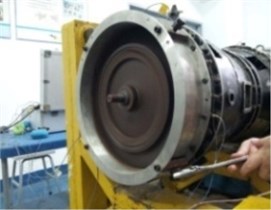
Fig. 1 and Fig. 3 is respectively the single-point rubbing experimental diagram and sensors installed position diagrams of thin-wall casing. Fig. 2 and Fig. 4 is respectively the single-point rubbing experimental diagram and sensors installed position diagrams of thick-wall casing. All the rubbing experiments involved in the paper are basic on the acceleration signal collected by the acceleration sensors Model 4508 provided by Demark Brüel & Kjær. The sampling frequency is 10 KHz, and the number of sampling points is 8192. The basic information of rubbing experiment is shown in Table 1.
Fig. 3Thin turbine casing single rub measuring point and rub point
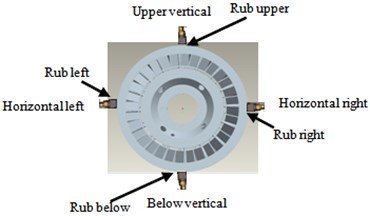
Fig. 4Thickness turbine casing single-point rub measuring and rub point
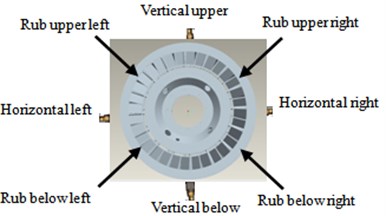
Table 1Rubbing experiment basic information
Experiment date | Experiment times | Rotating speed | Casing thickness | Rubbing intensities |
May 23th, 2014 | 4 | 1500 r/min | 4 mm | Moderate |
July 27th, 2014 | 2 | 1700 r/min | 4 mm | Serious |
November 09th, 2014 | 2 | 1000 r/min | 4 mm | Low |
June 25th, 2014 | 2 | 1000 r/min | 7 mm | Moderate |
3. Aero-engine rubbing characteristic analysis
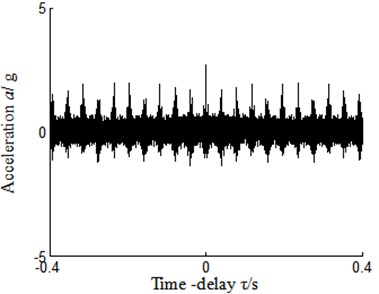
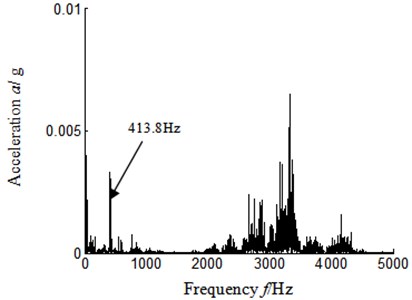
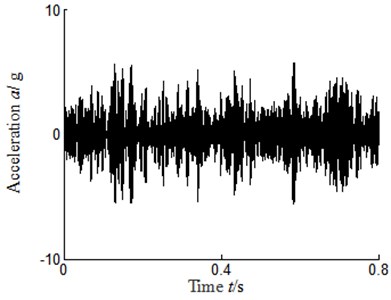
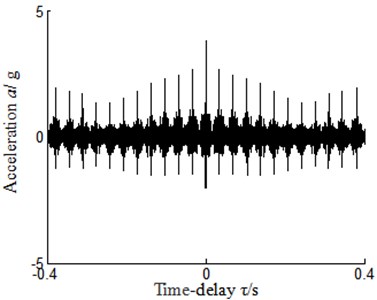
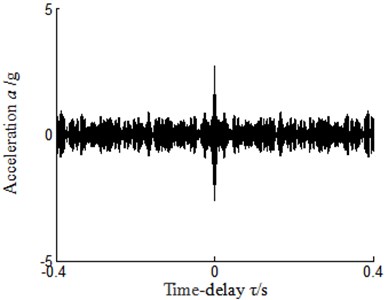
Because the aero-engine works under adverse circumstance such as the noise influence inside and outside, and signal attenuation and distortion, the obtained casing vibration signal is weak and complex. Generally, it is necessary to denoise processing in order to reduce noise effect. The auto-correlation function of signal can reserve the periodic component when eliminating noise and has wide application in rotating machine fault diagnosis. The frequency spectrum has certain difference between aero-engine normal running and rubbing fault occurrence. Based on above analysis, the casing vibration acceleration data of aero-engine rotor experiment rig is collected between normal running and single position rubbing to get the autocorrelation function and from the frequency spectrum analysis of which the character and rules of the acceleration signal will be extracted when rubbing happens. Taking the thin wall casing as example (the result is completely the same with thick-wall casing) and randomly selecting the experimental data of May 23th, 2014, the rubbing intensities are moderate and the position of turbine casing as the impacting point of single-point rubbing is horizontal right. The rotational speed is 1538 r/min and the corresponding calculated rotational speed frequency is 25.6 Hz when the experiment is running normal, while it is respectively 1528 r/min and 25.5 Hz when it is single-point rubbing. The signal collected from installed vertical upper sensor of turbine casing is analyzed between experiment rig normal running and single-point rubbing. The result is shown in Figs. 5-8. Fig. 5 and Fig. 6 respectively show time-domain and frequency-domain signal collected by the sensor installed above casing. Fig. 7, Fig. 8 respectively shows auto-correlation function and auto-correlation function frequency of signal. Figs. 5(a)-8(a), experiment rig normal running, and Figs. 5(b)-8(b) occur single-point rubbing of experiment rig. All the 1T-5T are respectively representing 1-5 integer multiple rubbing frequency (product between blade numbers and rotating frequency) involved in the paper.
From Figs. 5-8, we can draw conclusions as follows:
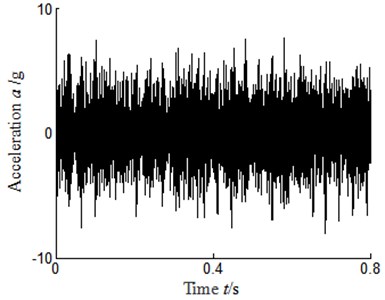
Form Fig. 5(a), Fig. 5(b), we cannot find significant difference and cannot discriminate running state of experiment rig in the time-domain signal between normal running and occurrence single-point rubbing. Comparison of Fig. 6(a) and Fig. 6(b) indicates that frequency spectrum has significant difference in some frequency positions, but noise makes great influence. There is an outstanding difference between Fig. 7(a) and Fig. 7(b). Fig. 7(b) has obvious periodic impact component compared with Fig. 7(a), we can draw a conclusion that the experiment rig is already running in rubbing state in Fig. 7(b). There is more outstanding difference between Fig. 8(a) and 8(b).
Fig. 5Time domain single-sensor installed turbine casing vertical upper
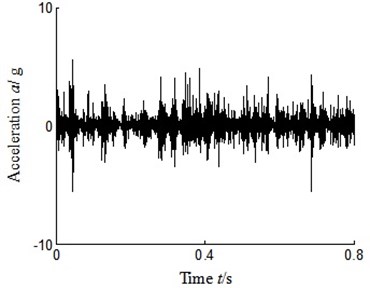
a) Normal running
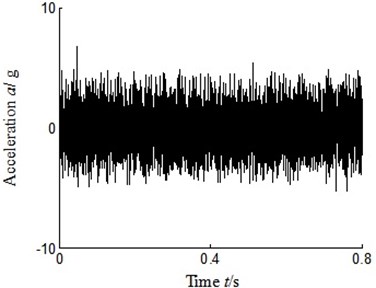
b) Single-point rubbing horizontal right
Fig. 6Frequency domain signal-sensor installed turbine casing vertical upper
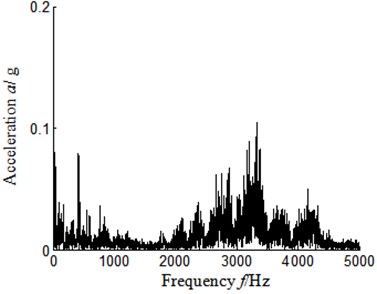
a) Normal running
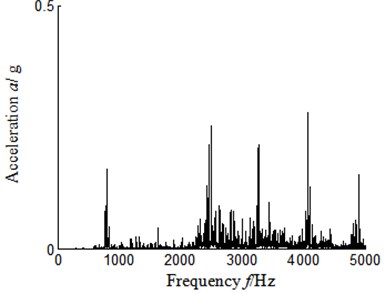
b) Single-point rubbing horizontal right
Fig. 7Autocorrelation function-sensor installed turbine casing vertical upper

a) Normal running
b) Single-point rubbing horizontal right
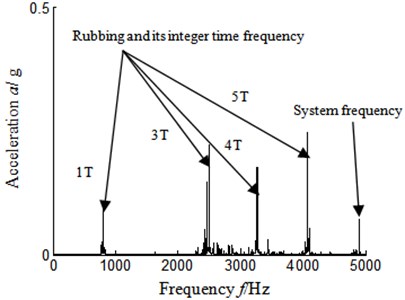
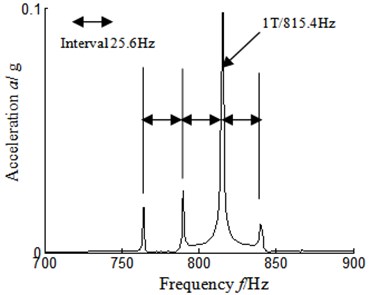
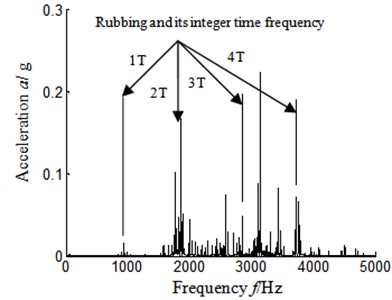
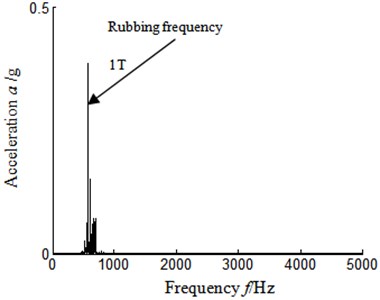
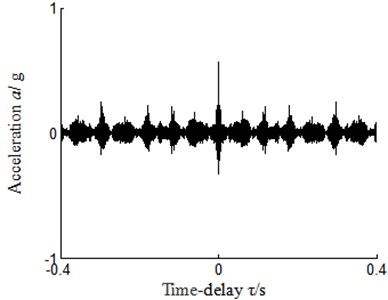
There is no obvious characteristic frequency in Fig. 8(a), when experiment rig is in normal running. But, when experiment rig runs in single-point rubbing state, in certain frequency and its integer multiple frequency positions of auto-correlation function frequency spectrum has very obvious impact characteristic frequency. From the further analysis of the certain frequency, it can be known this frequency is 815.4 Hz which is consistent with the rubbing frequency (product between blade numbers and rotating frequency) 815 Hz. From the analysis of reasons, the rotor-disk-blade structure is used in the experiment rig of aero-engine, the blade order takes turns to impact rubbing-point when single-point rubbing occurs and the effect cycles one time when the rotor rotates one period. So the vibration caused by rubbing is similar to gear vibration. The rubbing frequency is corresponding to meshing frequency of gear.
Fig. 8Autocorrelation function frequency spectrum-sensor installed turbine casing vertical upper
a) Normal running
b) Single-point rubbing horizontal right
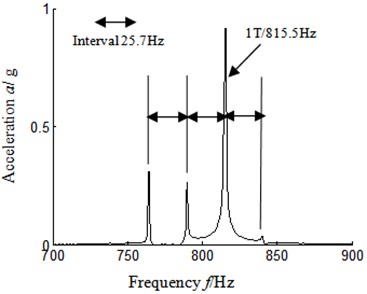
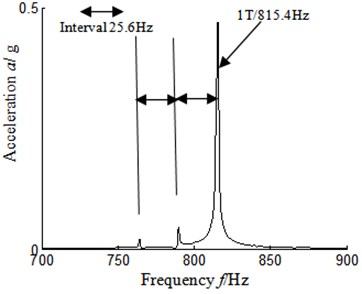
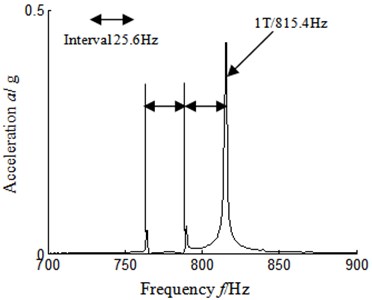
Fig. 9Autocorrelation function frequency spectrum local amplification 1
a) Normal running
b) Single-point rubbing horizontal right
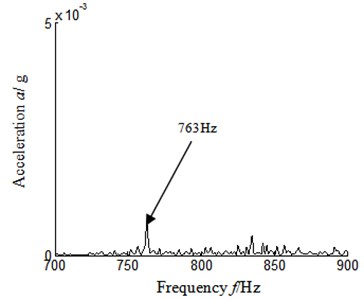
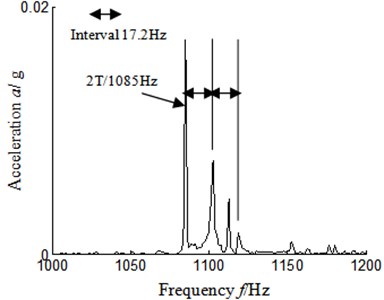
Precise analysis on rubbing frequency and its multiples frequency is shown in Figs. 9-12.
Figs. 9-12 respectively is auto-correlation function spectrum frequency local amplification in rubbing frequency and its integer multiple position when experiment run in normal and single-point rubbing state. Figs. 9(a)-12(a) experiment rig of aero-engine run in normal state, while Figs. 9(b)-12(b) experiment rig of aero-engine run in single-point rubbing state.
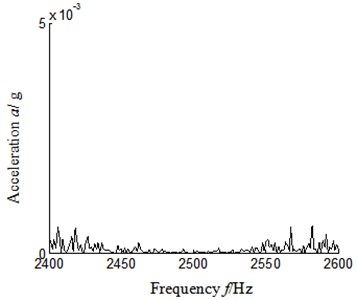
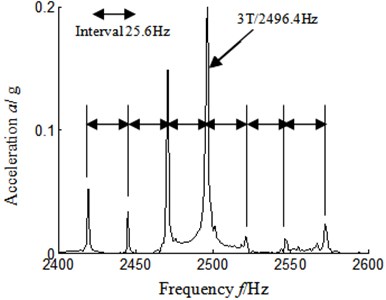
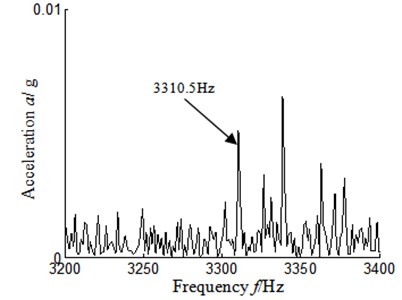
From the analysis of Figs. 9(a)-12(a), it can be found that there is no obvious characteristic frequency on rubbing frequency and its integer multiple frequency position when experiment rig runs normally. From the analysis of Figs. 9(b)-12(b), there is outstanding characteristic frequency in rubbing frequency and its integer multiple frequency position, and rotating frequency interval band-frequency characteristic has in these frequency position when experiment rig has rubbing fault. The cause of this kind of phenomena is that vibration caused by rubbing is similar to gear vibration, and the size of which is modulated by rotating frequency amplitude and therefore there is significant amplitude modulation phenomenon. Namely, there is band-frequency characteristic in rubbing frequency and its integer multiple frequency position, and band-frequency width is rotating frequency.
Fig. 10Autocorrelation function frequency spectrum local amplification 2
a) Normal running
b) Single-point rubbing horizontal right
Fig. 11Autocorrelation function frequency spectrum local amplification 3
a) Normal running
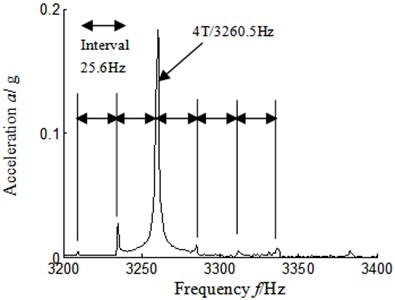
b) Single-point rubbing horizontal right
Fig. 12Autocorrelation function frequency spectrum local amplification 4
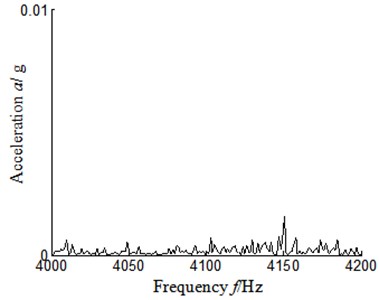
a) Normal running
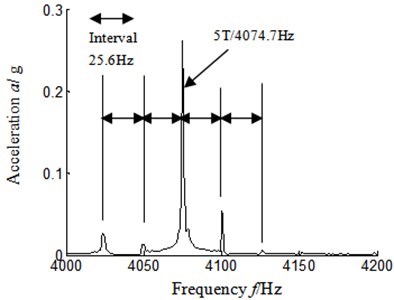
b) Single-point rubbing horizontal right
4. Sensor installed position effect on rubbing characteristics extract
In order to compare the influence of installation position of sensor on rubbing characteristics extracted, we selected the experimental data collected in the same time with Section 2 for analysis, and conducted rubbing characteristic analysis on the signal collected by the acceleration sensors installed on turbine casing other 3-positions. The rotating speed is still 1528 r/min and the corresponding rotating frequency and rubbing frequency separately is 25.5 Hz and 815 Hz. Due to the limited length of the article, we only analyzed auto-correlation function frequency spectrum in rubbing frequency position’s characteristic (according to Section 2, the characteristic of integer multiple rubbing frequency positions is similar to that of rubbing frequency).
4.1. Sensors installed turbine casing horizontal right
Figs. 13-16 shows the time-domain and frequency-domain graph collected by the sensors installed in turbine casing horizontal right when single-point rubbing position is turbine casing horizontal right. Fig. 13 shows the time-domain signal, and Fig. 14 is the auto-correlation function of Fig. 13. Fig. 15 and Fig. 16 are separately autocorrelation function frequency spectrum and frequency spectrum local amplification in rubbing frequency position.
Fig. 13Time domain signal
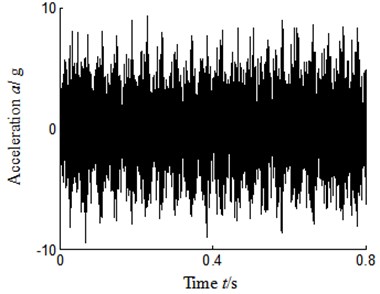
Fig. 14Autocorrelation function
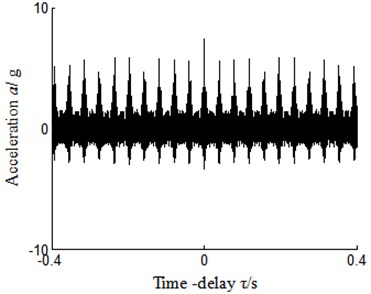
Fig. 15Autocorrelation function frequency spectrum
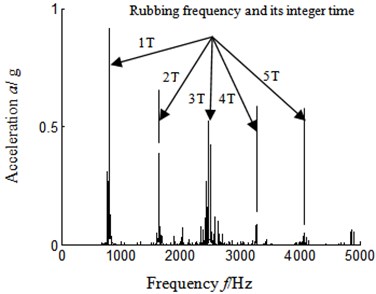
Fig. 16Autocorrelation function frequency spectrum local amplification
From Figs. 13-16 we draw the following conclusions:
From autocorrelation function of signal Fig. 14, we can judge that the rubbing fault of the experiment rig has already happened. It is consistent with Fig. 7(b). The outstanding characteristic frequency is observed in rubbing frequency and its integer multiple frequency position of auto-correlation function frequency spectrum from Fig. 15, it is consistent with Fig. 8(b). The rotating frequency interval band-frequency is found in rubbing frequency position from auto-correlation function frequency spectrum local amplification Fig. 16, it is also consistent with Figs. 9(b)-12(b).
4.2. Sensors installed turbine casing vertical below
Figs. 17-20 shows the time-domain and frequency-domain graph from sensors installed turbine casing vertical below when single-point rubbing position is turbine casing horizontal right. Fig. 17 shows the time-domain signal, and Fig. 18 is the auto-correlation function of Fig. 17. Fig. 19 is auto-correlation function frequency spectrum, and Fig. 20 is the local amplification of the auto-correlation function frequency spectrum in rubbing frequency position.
Fig. 17Time domain signal
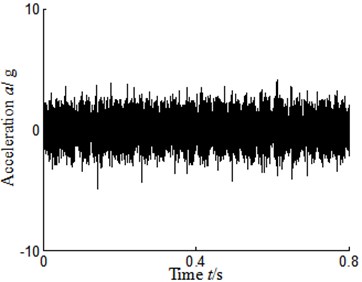
Fig. 18Autocorrelation function
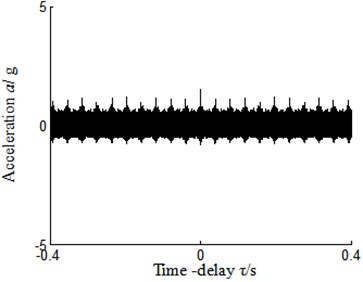
Fig. 19Autocorrelation function frequency spectrum
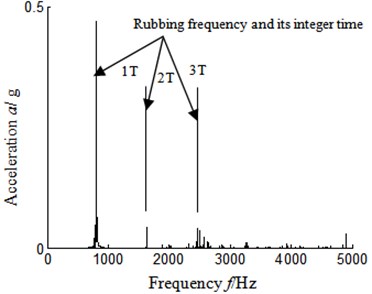
Fig. 20Autocorrelation function frequency spectrum local amplification
From Figs. 19-20 we can draw the following conclusions:
The prominent characteristic frequency is observed in rubbing frequency position of auto-correlation function frequency spectrum Fig. 19, it is consistent with Fig. 8(b) and Fig. 15. The rotating frequency interval band-frequency is found in rubbing frequency position from auto-correlation function frequency spectrum local amplification Fig. 20. It is also consistent with Fig. 9(b)-12(b) and Fig. 16.
4.3. Sensors installed turbine casing horizontal left
Figs. 21-24 shows time-domain and frequency-domain graph collected by sensors installed turbine casing horizontal left when single-point rubbing position is turbine casing horizontal right. Fig. 21 shows the time-domain signal, and Fig. 22 is the auto-correlation function of Fig. 21. Fig. 23 and Fig. 24 are separately auto-correlation function frequency spectrum, and local amplification of auto-correlation function frequency spectrum in rubbing frequency position.
The significant characteristic frequency is observed in auto-correlation function frequency spectrum rubbing frequency position from Fig. 23, which consistent with Fig. 8(b), Fig. 15 and Fig. 19. The rotating frequency interval band-frequency is found in rubbing frequency position from auto-correlation function frequency spectrum local amplification Fig. 24. It is also consistent with Figs. 9(b)-12(b), Fig. 16 and Fig. 20.
From Figs. 13-24 we come to the following conclusions:
On the three different positions, auto-correlation function frequency spectrums have the same characteristics with the sensor installed on different positions when the rubbing position is the same. Therefore, the installation position of sensors has no effect on rubbing characteristic extraction. Significant characteristic frequency in rubbing frequency or its integer multiple frequency positions occurs where the character of band-frequency interval is found.
Fig. 21Time domain signal
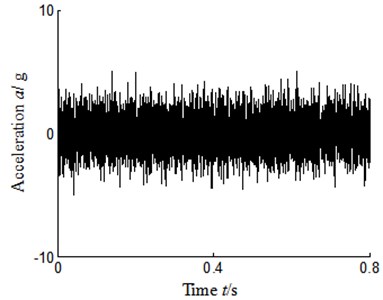
Fig. 22Autocorrelation function
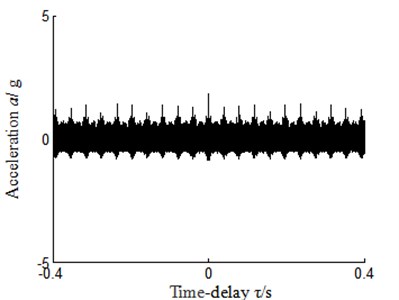
Fig. 23Autocorrelation function frequency spectrum
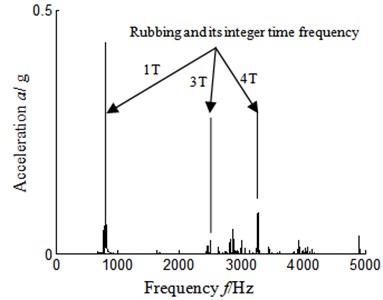
Fig. 24Autocorrelation function frequency spectrum local amplification
5. Rotating speed and rubbing intensity effect on rubbing characteristics extraction
In order to compare the influence of rotating speed and rubbing intensity on rubbing characteristics extraction, we randomly selected the experimental data including the serious rubbing intensities of July 27th, 2014 and the low rubbing intensities of November 9th, 2014.The rubbing position and sensor installed position separately lies in turbine casing horizontal right and turbine casing vertical upper in two different states. In serious and light rubbing two states, the rotating speed is separately 1744 r/min and 1062 r/min and the corresponding rotating frequency is separately 29.1 Hz and 18.0 Hz, and the corresponding rubbing frequency is separately 930.1 Hz and 566.1 Hz. The results are shown in Figs. 25-28. Figs. 25(a)-28(a) represent serious rubbing state, and Figs. 25(b)-28(b) represent low rubbing state.
The outstanding characteristic frequency is found in auto-correlation function frequency spectrum Fig. 27(a), and the rotating frequency interval band-frequency is observed in rubbing frequency position from auto-correlation function frequency spectrum local amplification Fig. 28(a). This characteristic is consistent with Section 2, Section 3, experiment rig rotating speed 1528 r/min, and the same with the rubbing character in moderate rubbing state. Compared with moderate-rubbing, in serious rubbing state the high frequency component of auto-correlation function frequency spectrum is more than that.
Fig. 25Time domain signal
a) Serious rubbing and rotate speed 1744 r/min
b) Low rubbing and rotate speed 1081 r/min
Fig. 26Autocorrelation function
a) Serious rubbing and rotate speed 1744 r/min
b) Low rubbing and rotate speed 1081 r/min
Fig. 27Autocorrelation function frequency spectrum
a) Serious rubbing and rotate speed 1744 r/min
b) Low rubbing and rotate speed 1081 r/min
Relatively single frequency characteristic is found in auto-correlation function frequency spectrum Fig. 27(b), that is, only exist rubbing frequency, but not exist integer multiple rubbing frequency, when experiment rig run in low rubbing state. From auto-correlation function frequency spectrum local amplification Fig. 28(b), we can find the double rotating frequency interval band-frequency.
Namely, rotating speed has no effect on rubbing characteristic extraction, but the rubbing intensity has some effect on extracted rubbing characteristic: auto-correlation function frequency spectrum of acceleration signal is relatively single when the experiment rig runs in low rubbing state, and the outstanding characteristic frequency only exists in rubbing frequency position. While in moderate rubbing and serious rubbing states, the rubbing characteristic is more abundant, it can be found in rubbing frequency or its integer multiple frequency position.
Fig. 28Autocorrelation function frequency spectrum local amplification
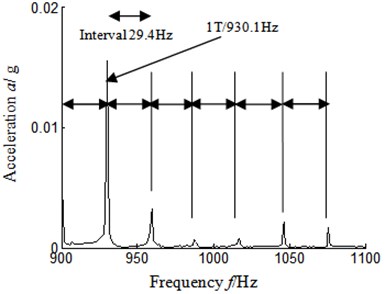
a) Serious rubbing and rotate speed 1744 r/min
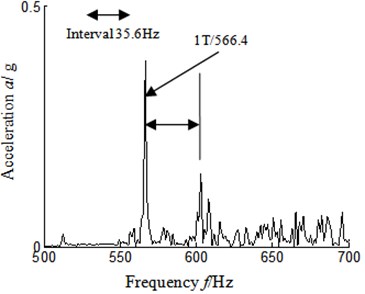
b) Low rubbing and rotate speed 1081 r/min
Fig. 29Time domain signal
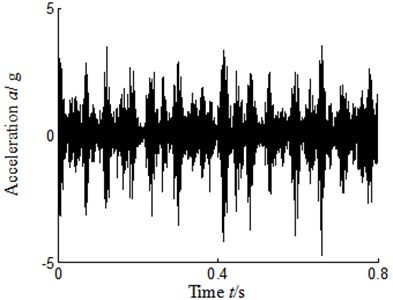
Fig. 30Autocorrelation function
6. Casing thickness and rubbing position effect on rubbing characteristic extract
In order to compare the influence of casing thickness and rubbing position on rubbing characteristic extraction, we processed the thick turbine casing with the thickness of 7 mm while the thickness of the original thin turbine casting is 4 mm and also replaced the single-point rubbing position from vertical upper, vertical lower, horizontal left and horizontal right to the position of right upper, right lower, left upper and left lower. As limited by the length of paper, randomly take the experimental data of June 25th, 2014 and left upper of casing for single-point rubbing as example to analyze the signal collected by the acceleration sensors vertical upper of turbine casing. The rubbing intensity is moderate and rotating speed is 1017.2 r/min. The corresponding rotating frequency and rubbing frequency is separately 17.0 Hz and 542.5 Hz. Result is shown in Figs. 29-32. Fig. 29 indicates the time domain signal collected by sensor above; Fig. 30 is auto-correlation function corresponding to Fig. 29; Fig. 31 and Fig. 32 is separately frequency spectrum and its local amplification corresponding to Fig. 30.
From Figs. 31-32 we can found:
The significant characteristic frequency is found in auto-correlation function frequency spectrum from Fig. 31, and the rotating frequency interval band-frequency is observed in double rubbing frequency position from auto-correlation function frequency spectrum local amplification Fig. 32, when casing thickness is thick-wall and rubbing position is upper left. This characteristic is consistent with thin-wall turbine moderate rubbing and serious rubbing. That is, the casing thickness and rubbing position has no effect on rubbing characteristic extraction.
Fig. 31Autocorrelation function frequency spectrum
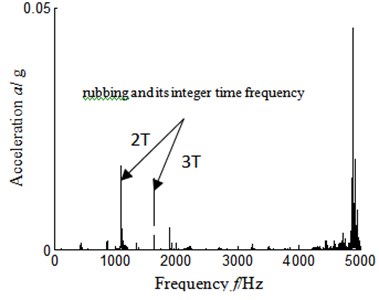
Fig. 32Autocorrelation function frequency spectrum local amplification
7. Conclusions
From the perspective of practical engineering application, rubbing characteristic is analyzed by aero-engine vibration acceleration signal of aero-engine in this paper. The method can judge whether the aero-engine has rubbing or not by simple frequency spectrum of auto-correlation function of acceleration signal. The method also has the following characteristics:
The rotor-disk-blade structure is used in the experiment rig of aero-engine and blade order impacts rubbing point in single-point rubbing state. The role cycles one time when the rotor rotates one period. So the vibration caused by rubbing is similar to gear vibration. The rubbing frequency is corresponding to meshing frequency of gear. The vibration size is modulated by rotating frequency amplitude. Namely, there exist band-frequency characteristic in rubbing frequency and its integer multiple frequency position, and band-frequency width is rotating frequency.
1) Sensor installed position, rotating speed, casing thickness and rubbing position have no effect on rubbing characteristic extraction. Installed on four different position sensors, three different rotating speeds, two different casing thickness and eight different rubbing positions, has similar rubbing characteristic.
2) Rubbing intensity has some effects on rubbing characteristic extraction: the acceleration signal auto-correlation function frequency spectrum is relatively single when experiment rig runs in low rubbing state, and the outstanding characteristic frequency occurs only in rubbing frequency position. While in moderate rubbing and serious rubbing, the rubbing characteristic is more abundant which can be found in rubbing frequency or its integer multiple frequency position, and has rotating frequency interval band-frequency characteristic. Compared with moderate rubbing, high frequency characteristic is more abundant in serious rubbing state.
The method should require further study in terms of the following aspects:
1) Rubbing types.
The single-point rubbing experiment was simulated and researched, and the rubbing characteristic was analyzed, but the partial rubbing and the whole period rubbing was not yet considered.
2) Required to determine the efficiency of extracting casing characteristics.
The proposed method was inspected just by simulated rubbing fault data of the rotor experiment rig of aero-engine. As the real aero-engine structure is far more complex than rotor experiment rig and there are a lot more external noises and vibrations in real flight, actual project inspection is required to determine the efficiency of extracting casing characteristics.
References
-
Tian Yong-Wei, Yang Jian-Gang Analysis on coupled vibration of rotating machinery in case of rotor to stator rub. Journal of Mechanical Engineering, Vol. 46, Issue 7, 2010, p. 102-107.
-
Li Yun-Gong, Zhang Hua-Biao Signature extracting method of the fault of rubbing rotor based on measured impulse response. Chinese Journal of Mechanical Engineering, Vol. 43, Issue 4, 2007, p. 224-228.
-
Chen Xiang-Min, Yu De-Jie, Li Rong Rub-impact diagnosis of rotors with resonance-based sparse signal decomponent and reassigned wavelet scalogram. Journal of Vibration and Shock, Vol. 32, Issue 13, 2013, p. 27-33.
-
Zhu Ming, Li Zhinong, He Xuping, et al. Application of generalized S-Transformation in rotor rub-impact fault diagnosis. Journal of Huaqiao University (Natural Science), Vol. 35, Issue 2, 2014, p. 127-131.
-
Zeng Ming, Yang Yu, Zheng Jinde, et al. Normalized complex teager energy operator demodulation method and its application to rotor rub-impact fault diagnosis. Journal of Mechanical Engineering, Vol. 50, Issue 5, 2014, p. 65-73.
-
Yao Hongliang, Han Qingkai, Li Lingxun, et al. Detection of rubbing location in rotor system by super-harmonic responses. Journal of Mechanical Science and Technology, Vol. 26, Issue 8, 2012, p. 2341-2437.
-
Wang Q., Chu F. Experimental determination of the rubbing location by means of acoustic emission and wavelet transform. Journal of Sound and Vibration, Vol. 248, Issue 1, 2001, p. 91-103.
-
Chu F., Lu W. Determination of the rubbing location in a multi-disk rotor system by means of dynamic stiffness identification. Journal of Sound and Vibration, Vol. 248, Issue 2, 2001, p. 235-246.
-
Han Q. K., Yu T., Li H., et al. Hybrid model based identification of local rubbing fault in rotor systems. Key Engineering Materids, Vol. 293-294, 2005, p. 355-364.
-
Chen Go, Li Chenggang, Wang Deyou Rotor-stator rubbing fault diagnosis knowledge acquisition using rule extraction from neural networks. Acta Aeronautica et Astronautica Sinica, Vol. 29, Issue 5, 2008, p. 1319-1325.
-
Chen Go Rotor-stator rubbing fault testing technique based on one-class support vector machine and primary component analysis. Journal of Vibration and Shock, Vol. 31, Issue 22, 2012, p. 29-38.
-
Ma Hui, Yang Jian, Song Rong-Ze, et al. Review and prospect on the research of rub-impact experiment of rotor systems. Journal of Vibration and Shock, Vol. 33, Issue 6, 2014, p. 1-12.
About this article

