Abstract
Engineering structures are subjected to various types of environmental exposure conditions and other loadings during their entire service life. There is a possibility of degradation of their strength and damage in the critical locations. Monitoring their health as well as assessment of the damage and safety evaluation of structures is gaining high importance. In view of locating and quantifying the damage in structures, a two stage methodology is proposed in this paper. Appropriate finite element models of beams are developed. Initially, the modal strain energy based damage indices are evaluated. The normalized mode shapes as well as normalized curvature mode shapes are used for computation of damage indices. Later, the severity of damage is predicted by using Artificial Neural Networks. The performance of modal strain energy based indices is evaluated for various damage cases with different locations and severities. The performance of the proposed method is assessed for cantilever, simply supported and fixed support conditions.
1. Introduction
Structural health monitoring is gaining high importance along with damage assessment and safety evaluation. To assess the safety conditions of structures, Nondestructive evaluation (NDE) is observed as one of the proven efficient tools. These techniques provide valuable information about the health condition of a structure at given locations. Usually damage assessment is carried out in four stages. Those are detection, location, quantification and prognosis [1]. Vibration based damage identification techniques are global formulations, those make it able to assess the health condition of the entire structure in one go. The basis of these methods is alteration in dynamic characteristics of the structure due to the local damages. The change is identified in terms of updated eigen parameters such as natural frequency, damping values and corresponding mode shapes. Over the last two decades, significant development has been observed in these methods, in particular modal methods for structural damage detection. This development can be reviewed in the literature [2-4].
Various damage indices as presented in the literature are based on different vibration parameters such as frequencies, mode shapes, damping values, mode shape derivatives, flexibility values, and strain energy values [5-9]. Among these, the strain energy based damage indices have high stability in detecting and localizing the damage, as presented by Alvandi and Cremona [10].
Stubbs et al. [7, 8] developed the damage index based on modal strain energy change and applied it to localize the damage in a steel bridge. Further, Cornwell et al. [11] extended this method to plate structure. Park et al. [12] developed another form of strain energy based damage index to localize the damage 3D truss bridge using numerical and experimental models. They observed that false indications of damage may occur at or near nodal points with the damage index. To minimise such false alarms, many researchers adopted improvements to the strain energy method [13-15].
Damage detection is one of the inverse problem in Engineering in which, the location and severity of the damage are determined from the measured dynamic characteristics of the structure. Artificial Neural Networks (ANNs) are the reliable tools to solve these types of inverse problems due to its powerful computational and excellent pattern recognition ability. The ANN-based methods were developed for identifying the location and the extent of damage in structures using static responses [16] as well as dynamic characteristics as input sets. The dynamic characteristics include natural frequencies, mode shapes, modal derivatives, frequency response functions and time domain data. Hakim and Razak [17] have presented and reviewed the technical literature for the past two decades on structural damage detection using ANNs with modal parameters such as natural frequencies and mode shapes as inputs. Meruane and Mahu [18] presented a new methodology designed to assess experimental damage using neural networks and anti-resonant frequencies. Ding et al. [19] have correctly identified the damage locations using the ratio of natural frequency changes as input datasets for ANN. Aydin and Kisi [20] have presented a robust methodology based on ANNs with the natural frequencies and mode shape rotation deviations in addition to beam properties as input sets to determine the crack parameters.
The objective of this paper is twofold. A two stage method for damage detection is presented along with the comparative study among the modal strain energy based indices for damage localisation and quantification. In this paper, damage detection method is explained firstly. Later ANN technique is used for quantification of damage. Initially, three modal strain energy based methods are reviewed briefly. Then, with the help of three dimensional finite element beam model, algorithms are verified for different levels of severity and location of the cantilever, simply supported and fixed support conditions. Using damage indices and the application of ANN technique, the damage severity is predicted. Finally, a new methodology is proposed based on the performance of the damage indicators observed in the previous stages.
2. Modal strain energy based damage indices
In the present work, an attempt has been made to improve the performance of three different damage detection algorithms based on modal strain energy changes for locating damages. The existing damage indices [11-14] use flexural mode shapes for calculation of modal strain energy. The computation of damage indices depends on the summation of the combination of mode shape curvatures. In these formulations, the mode shape vectors have been normalized, but mode shape curvatures are not normalized. Values of mode shape curvature depend on the shapes of each individual mode of vibration. The summation of non-normalized mode shape curvatures may distort the damage index in favour of higher modes, resulting in false damage identifications [13]. To reduce the problem of false alarms, an attempt is made to update these algorithms by (a) using mass normalized mode shapes and (b) mode shape curvatures for a particular mode, are normalized with respect to the maximum value of the corresponding mode. In this paper, the existing damage indices , and as per Eq. (2)-(7) are modified by using normalized displacement and curvature mode shapes so as to find the updated modal strain energy based damage indices – , and . The peak value of the updated damage index, indicates the location of damage.
A comparative study among the three formulations is carried out to investigate the capabilities of the updated damage indices to locate damage. The updated damage indices are evaluated for damaged steel beam structures for cantilever simply supported and fixed support conditions.
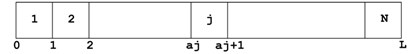
For a Bernoulli-Euler beam of span and flexural stiffness , which is subdivided into numbers of divisions as shown in Fig. 1, the fractional strain energy, associated with each sub-region from nodal coordinates to due to the th mode is given by:
where, is curvature mode shape; which can be computed by using central difference formula [5], is the modal strain energy of the full beam, Similar quantities, can be defined for the damaged structure using the curvature mode shape of the damaged beam in which a superscript asterisk is used to denote the damaged state.
Fig. 1A schematic sketch showing N subdivisions
2.1. Damage index
Cornwell et al. [11] proposed damage index for a segment due to mode as the ratio of fractional strain energy of damaged and healthy structure:
In order to use all the measured modes, , in the calculation, the damage index for sub-region is defined to be:
This damage index requires the mode shape data for healthy and damaged beam structure. The modal data acquired using ambient vibration can directly be used to localize the damage. The peak values of the damage index indicate the damage location.
2.2. Damage index
The damage index proposed by Cornwell [11] normally indicated false alarms at or near the node points of modes. Park et al. [12] therefore modified the expression as shown as Eq. (4). If numbers of modes are used, expression takes the form as indicated in Eq. (5):
2.3. Damage index
Li et al. [13] and Shih et al. [14] proposed this damage index. To overcome the limitation caused due to division by zero difficulty in computation of , an approximation is made to shift the axis of reference for the modal sensitivities to the value of 1.0. The peak values of the damage index above the datum level 1 indicate the damage locations:
To account all considered number of modes, the damage index is given as Eq. (7):
where, Numerator and Denominator are referred from Eq. (6).
3. Artificial neural network
Artificial neural networks are an information – processing system that is inspired by the way biological nervous systems, such as the brain, process the information. ANNs are massive parallel systems composed of a set of very simple processing elements or nodes. These nodes are connected by direct links. Each link has a numeric weight. Multilayer feed-forward neural networks, trained with a back-propagation learning algorithm, are the most popular neural networks [21]. The back propagation algorithm learns from the training datasets and reduces the error between the actual and predicted results. These networks send their signals in the forward direction and the errors in backward direction.
A typical feed forward neural network has three layers, namely, the input layer, the hidden layer and the output layer. Signals are received at the input layer, pass through the hidden layer and reach the output layer. Each layer can have a different number of neurons and activation functions, such as sigmoid and linear functions. All layers are fully interconnected. In this study, the tangent sigmoid and pure linear functions are used for the hidden and output activation functions. Levenberg-Marquardt is used as training function and Minimum Squared Error (MSE) is selected as the performance function.
4. Numerical studies
In the first part of the work presented here, a methodology for predicting the location of damage in the beam structure is finalized after comparing the performance of three updated damage indices. Finite element studies have been carried out with three support conditions; namely, cantilever, simply supported, and fixed. Isotropic material properties of aluminum are assumed as modulus of elasticity 70 GPa, Poisson’s ratio 0.35, and mass density 2696 kg/m3 respectively. The beam cross section 25.4 mm×25.4 mm has been considered with 650 mm length. The Finite element model is prepared with 100 numbers of eight noded brick elements (Solid 185) equally divided along the length. To induce damage, the beam is cut to cause crack of length 6.5 mm and width 25.4 mm. The cut has been created on the top face of the cantilever beam and bottom face of the simply supported and fixed beam. Modal analysis is carried out with the help of ANSYS-13 [22] and natural frequencies and corresponding mode shapes are obtained for the healthy and damaged beam. The cuts are made with depths varying from 0.1 to 0.7 times depth of the beam. The location is also changed at the interval of 1/8th length of the span of the beam from left support.
First three flexural modes of beam structures are extracted for intact and damaged beams from the FE analysis. The preliminary finite element model validation is carried out with the experimental results presented by Owolabi et al. [23] by comparing the relative frequencies (RF) of first three flexural modes (Table 1 and Table 2). The relative frequency of a cracked beam is considered as the ratio of the natural frequency of the cracked beam and the healthy beam.
Three updated damaged indices: , and are initially evaluated using the combined effect of first three normalized flexural mode shapes and curvature mode shapes. The updated damage indices are plotted against the length of the beam. All damage indices are computed with the help of newly developed algorithm. The optimal updated damage index is then selected for locating the damage.
Table 1Relative frequencies of fixed beams for different crack depth ratios with a crack located at midspan (L/2)
Crack depth | First mode | Second mode | Third mode | ||||||
Present work | Exp. [23] | Error % | Present work | Exp. [23] | Error % | Present work | Exp. [23] | Error % | |
0.1d | 0.9920 | 0.9985 | 0.646 | 0.9963 | 1.000 | 0.372 | 0.9916 | 0.9932 | 0.164 |
0.3d | 0.9692 | 0.9746 | 0.550 | 0.9963 | 1.000 | 0.369 | 0.9622 | 0.9728 | 1.091 |
0.5d | 0.9188 | 0.9159 | 0.319 | 0.9934 | 1.000 | 0.665 | 0.9082 | 0.9388 | 3.261 |
Table 2Relative frequencies of simply supported beams for different crack depth ratios with a crack located at midspan (L/2)
Crack depth | First mode | Second mode | Third mode | ||||||
Present work | Exp. [23] | Error % | Present work | Exp. [23] | Error % | Present work | Exp. [23] | Error % | |
0.1d | 0.9960 | 0.9940 | 0.197 | 0.9995 | 0.9999 | 0.043 | 0.9954 | 1.000 | 0.460 |
0.3d | 0.9727 | 0.9530 | 2.067 | 0.9960 | 0.9995 | 0.347 | 0.9670 | 0.9744 | 0.762 |
0.5d | 0.8933 | 0.8724 | 2.393 | 0.9847 | 0.9995 | 1.482 | 0.9032 | 0.9402 | 3.936 |
In the second part of the work, Artificial Neural Networks are employed for calculating the severity of the damage. Updated damage indices for 20 equidistant positions along the length of the beam (-) are considered as input. Different models are prepared by considering the damage location computed in the first stage () and first three relative natural frequencies () in addition to the modal strain energy based updated indices as inputs to the ANN. The damage severity in terms of the ratio of the crack depth to the depth of the beam is considered as the output. The neural network chosen in the present study is the multilayered feed-forward network with neurons in all the layers fully connected to each other in the feed forward manner. The training is carried out using the MATLAB Neural Network (NN) toolbox [24]. Sigmoid function is used as the activation function and the LM back-propagation learning algorithm () is applied for training. One hidden layer is selected and the numbers of neurons in this layer are decided in the learning process by trial and error.
In each beam, eight different damage severities in terms of crack depths from 0.1 to 0.8 with increment of 0.1 are induced at fifteen different location starting from left support to right support at an interval of 16. The natural frequency and the modal strain energy based updated indices are computed at damage location. In this network, thus formed 120 input data is used for training, testing and validation. Before categorizing them into training, validating, and testing, the data is randomized using data sets to increase the accuracy of the model. Out of 120 input data sets, 90 (75 %), 12 (10 %) and 18 (15 %) samples are used for training, validation and testing, respectively. When the network starts over fitting the data, the error on the validation set typically starts to increase. When the validation error increases for specified number of iterations, the training is stopped. The optimum values of network parameters like the rate of learning and momentum values are determined by trial and error.
For the training, several trials are carried out with different numbers of neurons in the hidden layer. For each trial, the mean square error (MSEs) and mean absolute percentage error (MAPE) for the training, validating, and testing is checked. The number of neurons in the hidden layer is decided based on the minimum value of MSE and MAPE for the training as well as validating and testing. The model is run varying the learning parameter, momentum parameter, and the number of cycles until the MSE and MAPE are minimized. The correlation coefficient () gives the indication of accuracy in the trained network.
The final architecture of the ANN in terms of the number of input parameters, number of neurons in the hidden layer and number of output parameters is decided for the model. In this study, nine numbers of models are finalized for each type of the beam. Thus, for the beams with all three boundary conditions, total 27 models are prepared. The models are then tested for unseen dataset for prediction of the damage severities with crack depth 0.15, 0.25, 0.35, 0.45, 0.55 and 0.65 at different locations.
5. Results and discussions
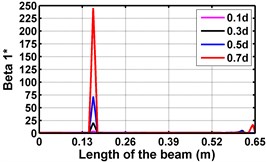
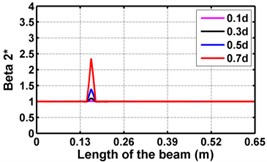
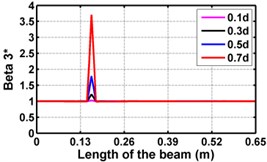
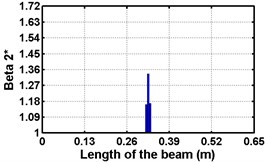
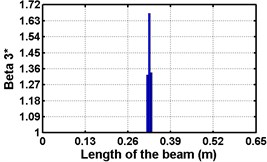
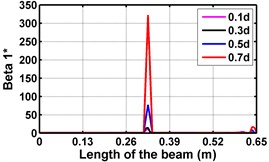
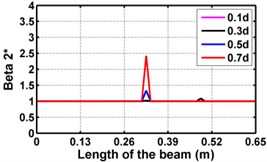
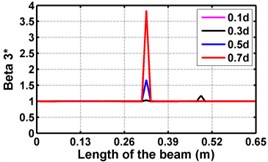
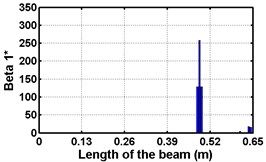
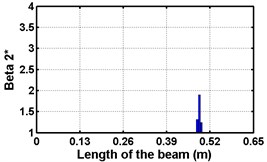
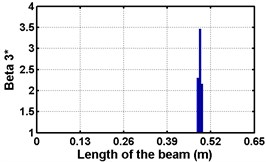
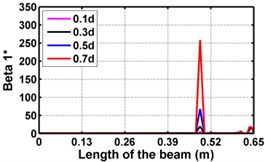
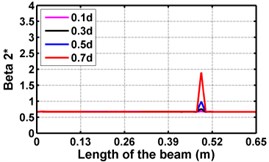
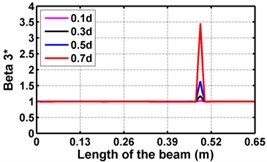
First three flexural mode shapes and their corresponding mode shape curvatures obtained from the results of FE analysis are used for calculating the updated modal strain energy based damage indices for beams. The plot of updated damage indices along the beam for selected damage cases for all three types of beams are shown from Fig. 2(a)-(c) till Fig. 4(a)-(c). The location of damaged elements is well indicated through the peaks of the plot. All updated damage indices are able to correctly locate the damage in beams with all three support conditions. As indicated in Figs. 2-4, the damage index still indicate the false alarm near the right end of the beam for all support conditions. All damage indices show the indication of damage near the damage zone; which may be termed as the vicinity effect. The values of the indices in the vicinity region are smaller than that of the damaged region. Hence, the peak of these values indicates the damage. From Fig. 2(d)-(f) till Fig. 4(d)-(f) shows damage indices for varying damage severity (0.1, 0.3, 0.5 and 0.7) along the length of the beam at different location for beams with different support conditions. The increase in the value of damage indices is observed with increase in severity of damage for all support conditions. After comparing the performance of all three damage indices, damage index is found superior to other two damage indices due to the fact of no indication the false alarm in any case and clear indication of damage in all cases.
Fig. 2Damage Indices for Cantilever Beam at damage location L/4 with (a-c) crack depth 0.3d, (d-f) varying crack depths
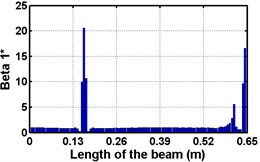
a)
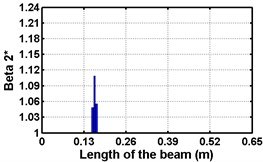
b)
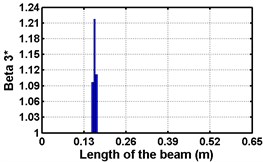
c)
d)
e)
f)
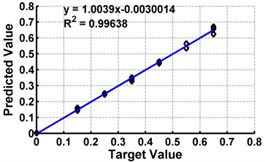
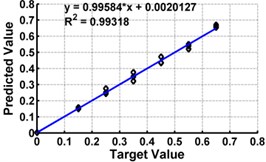
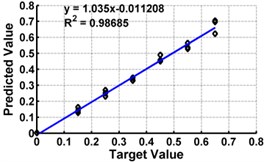
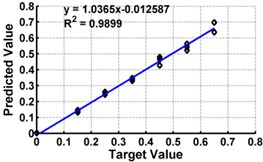
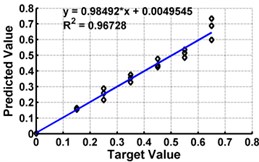
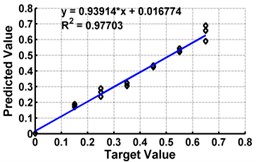
Table 3 shows the details of 27 ANN models (nine models for each support condition). For all support conditions, the architecture and performance of ANN for a specific model is observed to be almost similar. The performance of all models of cantilever beam is shown in Fig. 5. As observed from the Fig. 5, the predicted values in terms of the ratio of the crack depth to the depth of the beam are almost matching with the actual values giving a good correlation factor for the models. For first three models, values of damage index , and are selected as input. All models could successfully predict the severity of damage with the average error of 3 % with the architecture 20-30-1. For the next three cases, the location of the damage () predicted from the first stage is also used as the input dataset along with the damage indices, , and from 20 equidistant positions. 30 hidden layers are used with damage indices , and 29 with . All three models performed well with a correlation coefficient closer to 1. For next three sets of models, first three relative frequencies (RF) are used along with the three damage indices. The architecture 23-40-1 is needed to achieve the better convergence. As seen from Table 3 and Fig. 5, the results with updated damage indices and first three relative frequencies in combination are not as promising as those obtained using the updated damage indices as individual inputs, for prediction of severity of damage.
Fig. 3Damage indices for simply supported beam at damage location L/2 with (a-c) crack depth 0.5d, (d-f) varying crack depths
a)
b)
c)
d)
e)
f)
Fig. 4Damage indices for fixed beam at damage location 3L/4 with (a-c) crack depth 0.7d, (d-f) varying crack depths
a)
b)
c)
d)
e)
f)
Considering the MSE, correlation coefficients and the average error obtained from the test results, the sensitivity of the input datasets for predicting the severity of damage is listed in Table 4 for the beams with all support conditions. The updated damage index is sensitive to the damage severity for beams with all support conditions.
From above results, it is concluded that though all models performed well, the model no. 3 using gives accurate result as compare to other models. It predicts the damage severity giving average error in the unseen damage cases as 2.42 % and correlation coefficient as 0.998. A network with architecture 20-30-1 is selected as the optimum possible architecture for predicting severity of damage for cantilever beam. The same trend is observed in other two support conditions also.
Thus, in the first phase of the methodology, it is recommended to use for predicting the location of the damage and in the second phase, it is proposed to use multilayer percepteron with the architecture 20-30-1 and updated damage index, as the input datasets.
Fig. 5ANN testing results for severity prediction in terms of severity ratios (ratio of crack depth to depth of the beam) with different inputs of cantilever beam
a) Model 1: Input –
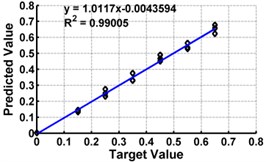
b) Model 2: Input –
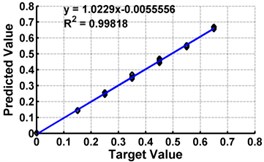
c) Model 3: Input –
d) Model 4: Input – ,
e) Model 5: Input – ,
f) Model 6: Input – ,
g) Model 7: Input – ,
h) Model 8: Input – ,
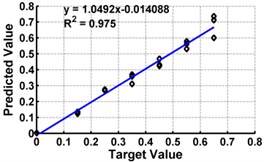
i) Model 9: Input – ,
Table 3The test results of ANN models for beams with different support conditions
Model | Input | Cantilever | Simply supported | Fixed | ||||||
Arch. | MSE | Arch. | MSE | R2 | Arch. | MSE | ||||
1 | 20-30-1 | 0.00030 | 0.996 | 20-30-1 | 0.00035 | 0.992 | 20-30-1 | 0.00062 | 0.988 | |
2 | 20-30-1 | 0.00062 | 0.990 | 20-30-1 | 0.00064 | 0.992 | 20-30-1 | 0.00013 | 0.993 | |
3 | 20-30-1 | 0.00018 | 0.998 | 20-30-1 | 0.00018 | 0.996 | 20-30-1 | 0.00009 | 0.996 | |
4 | , | 21-29-1 | 0.00039 | 0.993 | 21-29-1 | 0.00056 | 0.992 | 21-29-1 | 0.00011 | 0.994 |
5 | , | 21-30-1 | 0.00083 | 0.987 | 21-30-1 | 0.00067 | 0.991 | 21-30-1 | 0.00021 | 0.991 |
6 | , | 21-29-1 | 0.00052 | 0.990 | 21-29-1 | 0.00034 | 0.995 | 21-29-1 | 0.00051 | 0.990 |
7 | , | 23-40-1 | 0.00108 | 0.967 | 23-40-1 | 0.02075 | 0.972 | 23-37-1 | 0.00074 | 0.975 |
8 | , | 23-40-1 | 0.00086 | 0.977 | 23-39-1 | 0.00086 | 0.976 | 23-37-1 | 0.00082 | 0.974 |
9 | , | 23-40-1 | 0.00087 | 0.975 | 23-40-1 | 0.00096 | 0.974 | 23-37-1 | 0.00099 | 0.972 |
Table 4Sensitivity of the input parameters for prediction of damage severity for different support conditions
Support condition | 1 | 2 | 3 | 4 | 5 | 6 | 7 | 8 | 9 |
Cantilever | , | , | , | , | , | , | |||
Simply supported | , | , | , | , | , | , | |||
Fixed | , | , | , | , | , | , |
6. Conclusions
The present study addresses the identification and quantification of damage in the form of cracks present in the beam structure with three support conditions. Finite element simulations are done on the cracked beams with different configuration of crack depths and crack locations to find different modal parameters of the beams. Three updated damage indices based on the modal strain energy method, are evaluated using first three flexural mode shapes. All damage indices could exactly locate the damage for all damage scenarios in the beams with three support conditions. The value of the damage index is a function of its location and extent of damage as well as the support condition. Neural model can be successfully used to find the severity of damage in beam structures. The performance of these updated damage indices is checked for damage localisation and quantification. Based on this performance of damage indices, it is recommended to use updated third damage index for prediction of the location and severity prediction using artificial neural network.
References
-
Rytter A. Vibrational Based Inspection of Civil Engineering Structures. Doctoral Dissertation, Department of Building Technology and Structural Engineering, Aalborg University, 1993.
-
Doebling S., Farrar C., Prime M., Shevitz D. Damage Identification and Health Monitoring of Structural and Mechanical Systems from Changes in Their Vibration Characteristics: A Literature Review. Report No. LA-13070-MS, Los Alamos National Laboratory, 1996.
-
Carden E., Fanning P. Vibration based condition monitoring: a review. Structural Health Monitoring, Vol. 3, Issue 4, 2004, p. 355-377.
-
Fan W., Qiao P. Vibration-based damage identification methods: a review and comparative study. Structural Health Monitoring, Vol. 10, Issue 1, 2011, p. 83-111.
-
Pandey A., Biswas M., Samman M. Damage detection from changes in curvature mode shapes. Journal of Sound and Vibration, Vol. 145, Issue 2, 1991, p. 321-332.
-
Pandey A., Biswas M. Damage detection in structures using changes in flexibility. Journal of Sound and Vibration, Vol. 169, Issue 1, 1994, p. 3-17.
-
Stubbs N., Kim J., Farrar C. Field verification of a nondestructive damage localization and severity estimation algorithm. Proceedings of SPIE the International Society for Optical Engineering, 1995, p. 210-218.
-
Stubbs N., Park S., Sikorsky C., Choi S. A global non-destructive damage assessment methodology for civil engineering structures. International Journal of Systems Science. Vol. 31, Issue 11, 2000, p. 1361-1373.
-
Chang P., Flatau A., Liu S. Review paper: health monitoring of civil infrastructure. Structural Health Monitoring, Vol. 2, Issue 3, 2003, p. 257-267.
-
Alvandi A., Cremona C. Assessment of vibration-based damage identification techniques. Journal of Sound and Vibration, Vol. 292, Issue 1, 2005, p. 179-202.
-
Cornwell P, Doebling S., Farrar C. Application of the strain energy damage detection method to plate-like structures. Journal of Sound and Vibration, Vol. 224, Issue 2, 1999, p. 359-374.
-
Park S., Kim Y., Stubbs N. Nondestructive damage detection in large structures via vibration monitoring. Electronic Journal of Structural Engineering, Vol. 2, 2002, p. 59-75.
-
Li J., Choi F., Samali B., Crews K. Damage localization and severity evaluation of a beam-like timber structure based on modal strain energy and flexibility approaches. Journal of Building Appraisal, Vol. 2, Issue 4, 2007, p. 323-334.
-
Shih H., Thambiratnam D., Chan T. Vibration based structural damage detection in flexural members using multi-criteria approach. Journal of Sound and Vibration, Vol. 323, Issue 3, 2009, p. 645-661.
-
Wahalathantri B., Thambiratnam D., Chan T., Fawzia S. An improved modal strain energy method for damage assessment. Proceedings of the Tenth International Conference on Computational Structures Technology. Univeridad Politecnica de Valencia, Spain, 2010.
-
Maity D., Saha A. Damage assessment in structure from changes in static parameter using neural networks. Sadhana, Vol. 29, Issue 3, 2004, p. 315-327.
-
Hakim S., Razak A. Modal parameters based structural damage detection using artificial neural networks – a review. Smart Structures and Systems, Vol. 14, Issue 2, 2014, p. 159-189.
-
Meruane V., Mahu J. Real-time structural damage assessment using artificial neural networks and antiresonant frequencies. Shock and Vibration, 2014, p. 1-14.
-
Ding Z., Pan L., Ding Y., Jia H., Novák D. Detection of damage in beams using artificial neural networks. Proceedings of the 2nd International Conference of Structural Health Monitoring and Integrity Management, Nanjing, China, CRC Press, 2015, p. 117-121.
-
Aydin K., Kisi O. Damage diagnosis in beam-like structures by artificial neural networks. Journal of Civil Engineering and Management, Vol. 21, Issue 5, 2015, p. 591-604.
-
Haykin S. Neural Networks and Learning Machines, Vol. 3. Pearson Education, 2009.
-
ANSYS/Multiphysics (Release 13), ANSYS Inc., Southpointe 275 Technology Drive, Canonsburg, PA.
-
Owolabi G., Swamidas A., Seshadri R. Crack detection in beams using changes in frequencies and amplitudes of frequency response functions. Journal of Sound and Vibration, Vol. 265, Issue 1, 2003, p. 1-22.
-
MATLAB User Manual. Mathwork Inc. Lowell, USA, 2013.
About this article

