Abstract
The harmonic response under the in plane and out of plane driving force separately and model analysis of the widely used SCM-PIT probe were carried out in the consideration of the typical piezoresponse force microscopy working condition by finite element method. It is shown that there are symmetric modes of the resonance at 68, 408, 1139, 2244 kHz, and antisymmetric modes at 646, 1020, and 3077 kHz in the first seven eigenmodes. The symmetric modes of the harmonic response are verified by the frequency sweep method from the piezoresponse phase signals experimentally. It is also revealed that different driving frequencies should be used in the resonance-enhanced PFM imaging in the consideration of the domain structures. The driving frequency of 68, 408, 1139, 2244 kHz should be preferred in the resonance-enhanced PFM imaging of the out of plane domains, while the driving frequency of 646, 1020 and 3077 kHz should be used for the imaging of in plane domains in order of achieved the best resonance-enhanced effect.
1. Introduction
Piezoresponse force microscopy (PFM) utilizes a basic contact mode setup of atomic force microscopy (AFM) with an alternating voltage applied to a conductive probe, which induces the mechanical vibrations of a piezoelectric specimen due to converse piezoelectric effect. The mechanical vibrations transferred to the probe are detected using the optical lever method and then the signal is demodulated by lock-in amplifier so that both piezoresponse (PR) amplitude and phase information can be obtained. The PR amplitude provides the magnitude information of the piezoelectric effect, and the different polarization vector of adjacent domains leads to a contrast in PR phase images [1-3].
Since the concept is straightforward and the technique is easy to use, PFM has been developed as a versatile tool for static [4-6] and dynamic [7-10] ferroelectric domain monitoring and high resolution domain manipulation in last decade. Recently, resonance-enhanced technique has been introduced into PFM imaging, which works at frequencies close to the resonances of the cantilever-sample system. Operating near the resonances amplifies the response signal comparing with the oscillation amplitude of sample surface, and therefore improves the signal-to-noise ratio (SNR) of PR amplitude and PR phase [11]. However, the resonances are extremely sensitive to the contact stiffness of the tip-surface junction, which is determined by the surface curvature and local mechanical properties, and in turn leads to a large position dependent frequency shift, up to ~10-100 kHz. Thus, the standard frequency-tracking (phase-locked loop) technique is not appropriate in resonance-enhanced PFM imaging for the unavoidable crosstalk [12].
Therefore, Rodriguez et al. [13] put forward the Dual-frequency resonance-tracking method, in which the conductive cantilever operates with two oscillating voltages with frequencies at or near its resonances. Jesse et al [14]. proposed the band excitation technique, which substitutes the AC modulation signal with a synthesized one that spans a continuous band of frequencies at the resonant frequency of the cantilever. Both technological developments are in the aim of avoiding the crosstalk and maintaining the advantages of resonance detection.
The majority of recent experimental and theoretical researches focus on the electromechanical activity of PR amplitude [12] and the improvement of SNR [15]. Few efforts are devoted to the systemically analysis of both in plane and out of plane harmonic responses under cantilever resonance, which is not only of importance of understanding the resonance mode PFM imaging in the regime of electromechanical behavior, but also helpful for the optimization of driving frequency in resonance-enhanced PFM imaging.
In this contribution we present a harmonic response analysis of SCM-PIT probe in the consideration of the typical PFM working condition under the in plane and out of plane driving force acting on the tip separately by finite element method. The antisymmetric and symmetric modal shapes for the first seven eigenfrequencies are extracted. The symmetric modes of the harmonic response are verified by the frequency sweep method from the PR phase signals experimentally. And we proposed the best driving frequency for optimization of resonance-enhanced PFM imaging for the in plane and out of plane domain structures using SCM-PIT probe.
2. Theoretical and experimental details
In this article, the harmonic response analysis of the widely used Pt/Ir coated conductive probe (SCM-PIT, Bruker) was carried out in the consideration of the typical PFM working condition under the in plane and out of plane driving force acting on the tip separately by finite element method with ANSYS 10. The cantilever specifications of the probe given by the manufacturer are length ~225 μm, width ~28 μm, thickness ~2.75 μm, and the typical tip height is ~12.5 μm [16].
In order to reveal dynamic response of structures of the probe under harmonic, modal analysis was performed on the same probe using ANSYS, which illustrates the modal shape at each eigenfrequency.
To demonstrate the validity of the harmonic response spectra obtained by finite element analysis, -cut, near-stoichiometric lithium niobate (SLN) crystals of original uniform single domain state were used as the specimens, which were double sides polished (about 5 μm thick) and glued to a bottom electrode using conductive silver paste. A commercial scanning probe microscope (Nanoscpoe IV, Veeco) was used for the harmonic response measurement of PR phase signal with SCM-PIT probe.
In our experiment, a 10×10 μm2 square region was first scanned with a bias voltage of +120 V to fabricate antiparallel domains in SLN. Fig. 1 illustrates the topography and PR phase image of the fabricated domains.
Fig. 1a) Topography, b) PR phase images of SLN after the poling of +120 V on a 10×10 μm2 region. Domains marked by “B” and “D” are antiparallel domains
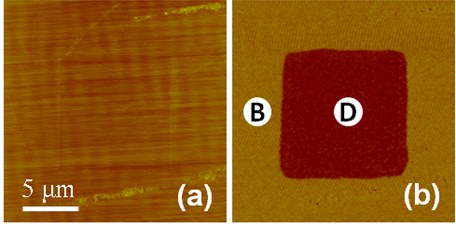
The PR phase spectrum is acquired by frequency sweep method (as shown in Fig. 6), in which the tip is fixed on the antiparallel domains [marked by “B” and “D” in Fig. 1(b)] separately with AC modulation voltage of 5.5 V applied between the tip and the bottom electrode while the drive frequency sweeps continuously from 10 to 1500 kHz. The PR phase signal of the harmonic response is acquired under the vertical mechanical driving force applied by the specimen due to converse piezoelectric effect. The PR phase curves in our study are averages of three frequency sweep taken at different positions of domains with same polarization to eliminate errors.
3. Results and discussion
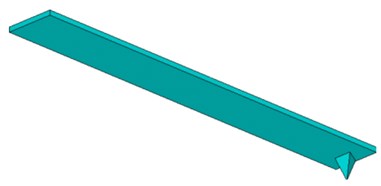
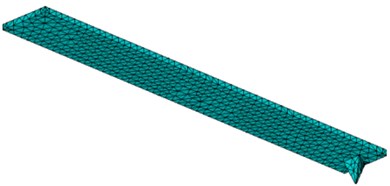
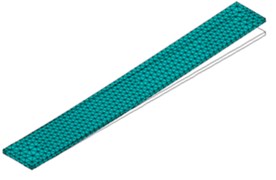
Fig. 2 shows the SCM-PIT probe modeled in ANSYS according to the cantilever and tip specifications of the manufacturer [Fig. 2(a)] and the probe geometry with the mesh used for finite element analysis [Fig. 2(b)]. Considering the SCM-PIT probe is produced with silicon by etching techniques, the material parameters of silicon are used for the theoretical analysis as Young’s modulus 129.2 GPa, Poisson ratio 0.28, and mass density 2.33 g/cm3 [17].
Fig. 2a) Cantilever geometry and b) cantilever geometry with the mesh used for finite element analysis
a)
b)
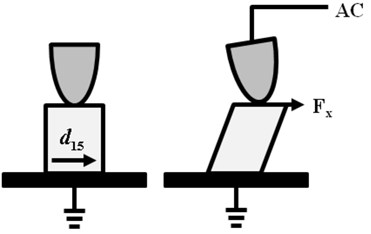
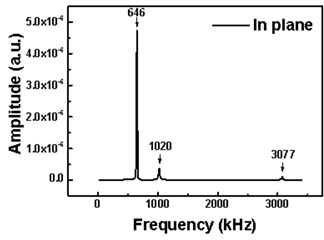
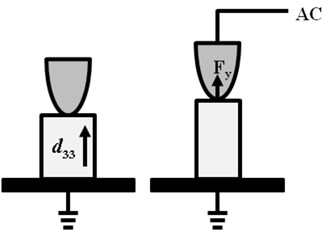
In PFM imaging, the shear movement originated from the electric field applied orthogonal to the polarization due to the coefficient results in a in plane driving force , which drives the vibration of the probe as it is shown in Fig. 3(a) [1]. The harmonic analysis is performed in the frequency range of 0-3400 kHz with a periodical in plane driving force of 100 nN applied on the tip horizontally. Fig. 3(b) shows the amplitude of the tip vibration in the horizontal direction (in plane) under the driving force. It should be noticed that under the in plane driving force there are three resonance peaks at 646, 1020, and 3077 kHz in the in plane harmonic response spectrum.
Fig. 3a) AC modulation voltage applied orthogonal to the spontaneous polarization leads to a shear vibration of the piezoelectric sample due to the d15 coefficient, which applied the in plane driving force on the tip in PFM imaging, b) the in plane harmonic amplitude responses of the probe under the in plane driving force via finite element analysis
a)
b)
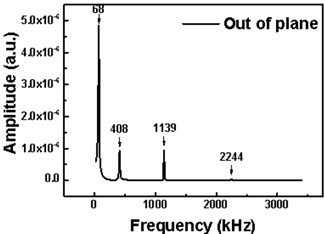
It is shown in Fig. 4(a) the AC modulation voltage aligned parallel to the spontaneous polarization leads to a vertical vibration of the cantilever due to the effect. It causes additional lateral contraction of the ferroelectric via the piezoelectric coefficient. The mechanical vibration of the sample results is an out of plane driving force , which drives the vibration of the probe [1]. The harmonic analysis is also performed in the frequency range of 0-3400 kHz with a periodical out of plane driving force of 100 nN applied on the tip. Fig. 4(b) shows the out of plane harmonic amplitude responses of the probe under the out of plane driving force separately. And there are four resonance peaks at 68, 408, 1139, 2244 kHz in the out of plane harmonic response spectrum in Fig. 4(b).
Fig. 4a) AC modulation voltage aligned parallel to the spontaneous polarization leads to a vertical vibration of the piezoelectric sample due to the d33 effect, which applied the out of plane driving force on the tip in PFM imaging, b) The out of plane harmonic amplitude responses of the probe under the out of plane driving force via finite element analysis
a)
b)
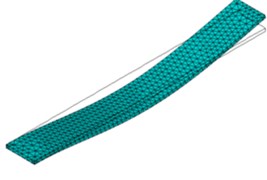
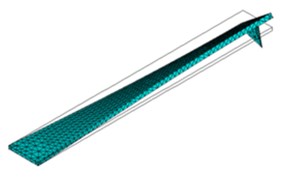
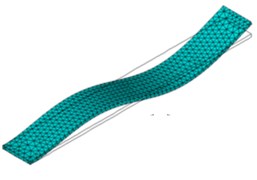
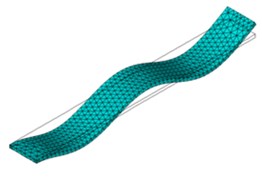
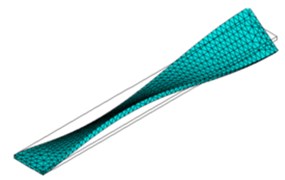
In order to show dynamic response of structures of the probe under harmonic frequencies mentioned above, the modal analysis was carried out. The results are the first seven modal shapes shown in Fig. 5 and the eigenfrequencies of the undamped system are given below the picture. In the symmetric modes (a), (b), (e) and (f), the tip oscillates vertically as shown in the Fig. 5, whereas in antisymmetric modes (c), (d) and (g), the tip vibrates laterally.
Therefore, we can imply that the three resonances at 646, 1020 and 3077 kHz in the in plane harmonic response spectrum in Fig. 3(b) are related to the antisymmetric modes in which the shear movements are stronger, while the four resonances at 68, 408, 1139, 2244 kHz in the out of plane harmonic response spectrum in Fig. 4(b) are related to the symmetric modes of the probe in which the vertical movements dominate.
In the aim of validating our theoretical results above, the PR phase spectrum is acquired by frequency sweep method. The AC modulation voltage of 5.5 V aligned parallel to the spontaneous polarization of the SLN sample excites the vibration of the sample due to the effect, which leads to a vertical vibration of the cantilever and the PR phase spectrum is acquired continuously. It realizes the model shown in Fig. 4(a).
Theoretically, the resonance behavior is usually manifested in two different ways. The amplitude resonance is frequently more dramatic, but the phase resonance, which is the angular shift between the external driver and the oscillating object, may sometimes be much clearer. The oscillation displacement, amplitude, is at a maximum near resonance frequency and smaller off resonance. The phase of oscillation relative to the driving force shifts by 180° as the driving frequency varies through resonance [18]. In our experiment, we will use phase response to analyze the resonance behavior.
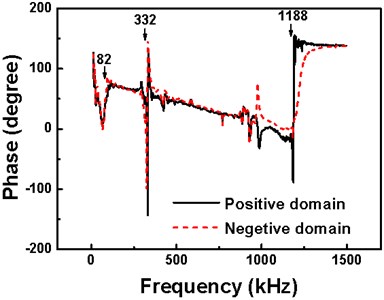
It is clearly shown in Fig. 6 that there are three phase shifts at 82, 332 and 1188 kHz in the frequency range of 10 to 1500 kHz, which can be interpreted as there are three resonances at each frequency. Comparing to the first three resonances at 68, 408 and 1139 kHz of the symmetric modes of the probe in the out of plane harmonic response [Fig. 4(b)], the resonance frequency from experimental measurements and harmonic analysis at each mode being close to one another suggests that our theoretical analysis is valid.
It should be mentioned there are several tens of kilohertz differences of the resonance frequency from harmonic analysis and experimental measurements at each eigenmode. For example, the resonance frequency of the first harmonic is 68 kHz from the finite element analysis, but the resonance frequency from experimental measurements is 82 kHz. However, both the resonance frequencies are in range of the first resonance frequency given by the manufacturer of 50-100 kHz. This is because the inevitable minor geometric differences of the theoretical model to the actual probe used in experiment. Furthermore, the experimental measurements are different from finite element analysis based on the ideal model, as the contact between the sample and tip can be affected by the atmosphere and humidity of the environment or the topography, which will lead to the small variation of the resonance frequency [12].
Fig. 5The first seven eigenmodes obtained for SCM-PIT probe in sequence of their respective eigenfrequencies from a) to g) with eigenfrequencies given below. Eigenmodes a) 68 kHz, b) 408 kHz, e) 1139 kHz and f) 2244 kHz are symmetric, whereas eigenmodes c) 646 kHz, d) 1020 kHz and g) 3077 kHz are antisymmetric
a)
b)

c)
d)
e)
f)
g)
Furthermore, it is revealed that different driving frequencies should be used in the resonance-enhanced PFM imaging in the consideration of the domain structure. The driving frequency of 68, 408, 1139, 2244 kHz should be preferred in the resonance-enhanced PFM imaging of the out of plane domains, while the driving frequency of 646, 1020 and 3077 kHz should be used for the imaging of in plane domains in order of achieved the best resonance-enhanced effect by SCM-PIT probe.
Fig. 6Drive frequency dependence of PR phase signal on the antiparallel domains marked as “B” (dashed curve) and “D” (solid curve) in Fig. 1(b). The resonance frequencies are indicated by the arrows
4. Conclusions
In conclusion, the harmonic response under the in plane and out of plane driving force separately and model analysis of the widely used SCM-PIT probe were carried out in the consideration of the typical PFM working condition by finite element method. It is shown that there are symmetric modes of the resonance at 68, 408, 1139, 2244 kHz, and antisymmetric modes at 646, 1020, and 3077 kHz in the first seven eigenmodes. The symmetric modes of the harmonic response are verified by the frequency sweep method from the PR phase signals experimentally. It is also revealed by our research that the driving frequency of 68, 408, 1139, 2244 kHz should be preferred in the resonance-enhanced PFM imaging of the out of plane domains, while the driving frequency of 646, 1020 and 3077 kHz should be used for the imaging of in plane domains in order of achieved the best resonance-enhanced effect.
References
-
Kholkin A. L., Kalinin S. V., Roelofs A., Gruverman A. Review of Ferroelectric Domain Imaging by Piezoresponse Force Microscopy, Scanning Probe Microscopy: Electrical and Electromechanical Phenomena at the Nanoscale. Springer, New York, 2007, p. 175-183.
-
Bonnell D. A., Kalinin S. V., Kholkin A. L., Gruverman A. Piezoresponse Force microscopy: a window into electromechanical behavior at the nanoscale. MRS Bulletin, Vol. 34, Issue 9, 2009, p. 648-657.
-
Balke N., Bdikin I., Kalinin S. V., Kholkin A. L. Electromechanical imaging and spectroscopy of ferroelectric and piezoelectric materials: state of the art and prospects for the future. Journal of the American Ceramic Society, Vol. 92, Issue 8, 2009, p. 1629-1647.
-
Paruch P., Giamarchi T., Triscone J. M. Domain wall roughness in epitaxial ferroelectric PbZr0.2Ti0.8O3 thin films. Physical Review Letters, Vol. 94, Issue 19, 2005, p. 197601.
-
Pertsev N. A., Petraru A., Kohlstedt H., Waser R., Bdikin I. K., Kiselev D., Kholkin A. L. Dynamics of ferroelectric nanodomains in BaTiO3 epitaxial thin films via piezoresponse force microscopy. Nanotechnology, Vol. 19, Issue 37, 2008, p. 375703.
-
Catalan G., Bea H., Fusil S., Bibes M., Paruch P., Barthelemy A., Scott J. F. Fractal dimension and size scaling of domains in thin films of multiferroic BiFeO3. Physical Review Letters, Vol. 100, Issue 2, 2008, p. 027602.
-
Gruverman A., Wu D., Scott J. F. Piezoresponse force microscopy studies of switching behavior of ferroelectric capacitors on a 100-ns time scale. Physical Review Letters, Vol. 100, Issue 9, 2008, p. 097601.
-
Gruverman A., Wu D., Fan H. J., Vrejoiu I., Alexe M., Harrison R. J., Scott J. F. Vortex ferroelectric domains. Journal of Physics: Condensed Matter, Vol. 20, Issue 34, 2008, p. 342201.
-
Maksymovych P., Jesse S., Yu P., Ramesh R., Baddorf A. P., Kalinin S. V. Polarization control of electron tunneling into ferroelectric surfaces. Science, Vol. 324, Issue 5933, 2009, p. 1421-1425.
-
Jesse S., Rodriguez B. J., Choudhury S., Baddorf A. P., Vrejoiu I., Hesse D., Alexe M., Eliseev E. A., Morozovska A. N., Zhang J., Chen L. Q., Kalinin S. V. Direct imaging of the spatial and energy distribution of nucleation centres in ferroelectric materials. Nature Materials, Vol. 7, Issue 3, 2008, p. 209-215.
-
Harnagea C., Alexe M., Hesse D., Pignolet A. Contact resonances in voltage-modulated force microscopy. Applied Physics Letters, Vol. 83, Issue 2, 2003, p. 338-340.
-
Jesse S., Mirman B., Kalinin S. V. Resonance enhancement in piezoresponse force microscopy: mapping electromechanical activity, contact stiffness, and Q factor. Applied Physics Letters, Vol. 89, Issue 2, 2006, p. 022906.
-
Rodriguez B. J., Callahan C., Kalinin S. V., Proksch R. Dual-frequency resonance-tracking atomic force microscopy. Nanotechnology, Vol. 18, Issue 47, 2007, p. 475504.
-
Jesse S., Kalinin S. V., Proksch R., Baddorf A. P., Rodriguez B. J. The band excitation method in scanning probe microscopy for rapid mapping of energy dissipation on the nanoscale. Nanotechnology, Vol. 18, Issue 43, 2007, p. 435503.
-
Seal K., Jesse S., Rodriguez B. J., Baddorf A. P., Kalinin S. V. High frequency piezoresponse force microscopy in the 1-10 MHz regime. Applied Physics Letters, Vol. 91, Issue 23, 2007, p. 232904.
-
https://www.brukerafmprobes.com/Product.aspx?ProductID=3392, 2015.
-
Stark R. W., Drobek T., Heckl W. M. Tapping-mode atomic force microscopy and phase-imaging in higher eigenmodes. Applied Physics Letters, Vol. 74, Issue 22, 1999, p. 3296-3298.
-
Garcia R., Perez R. Dynamic atomic force microscopy methods. Surface Science Reports, Vol. 47, Issues 6-8, 2002, p. 197-301.
About this article

This work was supported by the National Science Foundation (Grant Nos. 61170317, 51474089 and 11504082), Natural Science Foundation of Hebei Province (Nos. A2013209295 and A2014209048), and the Science Foundation of North China University of Science and Technology (Nos. GP201502).
