Abstract
Multilayer piezoelectric actuators operating in quasi-static conditions under high electrical field find more and more applications in demanding environments, such as in the field of aerospace. Naturally, increasing amounts of data are being published on the behavior of PZT materials under large signal conditions. However, the information is often incomplete and not directly usable by mechanical design engineers. Using a pragmatic approach, the present work aims at drawing a complete set of parameters for designers to use when selecting a piezoelectric actuator, in particular for applications at elevated temperature (up to 200 °C). For the design process, it is important to characterize apparent capacitance, apparent losses, free stroke, blocking force and height according to temperature. In addition, non-linear effects such as creep must be considered. The present paper focuses mostly on apparent capacitance, losses and displacement. The evolution of capacitance with field is not linear and strongly temperature dependent. Measurements on NCE51 (soft-doped) and NCE46 (hard-doped) indicate a very different behavior. As signal amplitude increases, capacitance increases, reaches a maximum then decreases. This maximum shifts with temperature, so that at 200 °C, NCE51 reaches a maximum at 0,8 kV/mm while NCE46 peaks at 1,8 kV/mm. Results are presented also for the apparent loss factor (tangent ) and free displacement. At 200 °C, NCE51 and NCE46 provide respectively 23 % and 15 % additional free displacement. Furthermore, the loss factor at maximum field decreases for NCE51, so the basis for material choice (soft-doped or hard-doped) is challenged. Using these measurements, the operating envelope of the actuators can be calculated for different temperatures. The comparison of the two materials highlights the advantage of NCE51 at low frequency. At high frequency, NCE46 maintains an advantage, particularly for energy-intensive applications.
1. Introduction
Piezoelectric transducers have been widely used in sonars and other high frequency applications for decades. More recently, multilayer piezoelectric actuators have also reached a high level of maturity, finding applications in micro- and nano-positioning, vibration control or valves. Demanding applications in aerospace are being developed, such as piezoelectric valves within micro-thrusters for ESA’s GAIA mission [1]. These applications of multilayer piezoelectric actuators are made possible by their high strain, achievable under high electrical field in quasi-static conditions. In these conditions, the standard material parameters provided by manufacturers are becoming less relevant. Instead, macroscopic quantities referring directly to the performance of the element are preferred. In addition, it is critical to know how these quantities evolve over a wide temperature range in order to identify the worst case scenario, as well as benchmark different options. Unfortunately, even though some literature is available on the topic [2-4], this information is often incomplete.
The present work is performed within the project AeroPZT, specifically funded under the Clean Sky Joint Technology Initiative (EU FP7). The project partners, TWI Ltd. (UK), Cedrat Technologies (France), Noliac (Denmark) and Politecnico di Torino (Italy) are targeting the development of materials and processes for the application of piezoelectric materials in aero engine controls, which implies harsh environmental conditions, particularly elevated temperature. The overall target from an actuation point of view is to characterize the main parameters (allowable reverse field, apparent capacitance, apparent losses, free stroke, blocking force and height) according to temperature. In the present work, this characterization was performed for two different materials, one hard-doped and one soft-doped lead zirconate titanate (PZT) ceramic. In a second step, these characteristics can be compared in order to validate the material choice. This publication focuses on the comparison of the dielectric properties, free displacement and stiffness of the two materials, concluding on material selection based on criteria of free displacement and mechanical energy. A previous publication [5] was focusing on dielectric losses and creep, while other parameters will be analyzed in more detail in further publications.
The hard-doped PZT used in these tests is based on Noliac’s NCE46 while the soft-doped PZT is using NCE51. The samples used for this characterization are either single multilayer elements (10×10×2 mm3) or small stacks of multilayer elements (5×5×14 mm3), rated for low voltage (either 100 or 200 V at a nominal field of 3 kV/mm). All samples were poled by the manufacturer using standard parameters (application of 2-3 kV/mm at 130-150 °C for several minutes).
2. Measurement results
2.1. Apparent capacitance
For the assessment of apparent capacitance and apparent dielectric losses, the sample is submitted to a unipolar sinusoidal voltage at 1 kHz. The amplitude of the excitation voltage is varied, providing measurements for various peak fields. Using a simple Sawyer-Tower circuit [6], the charge absorbed by the sample is measured and split into in-phase (capacitive) and out-of-phase (resistive) components with reference to the applied voltage. More details about the measurement method can be found in a previous publication [5].
The apparent capacitance is calculated from the RMS current, frequency and voltage according to Eq. (1):
The apparent capacitance is compared to the static capacitance under small signal excitation . The ratio is called relative apparent capacitance. Results are given in Figs. 1 and 2 for the two materials and for different ambient temperatures.
Fig. 1Evolution of apparent capacitance with electrical field and temperature for NCE51
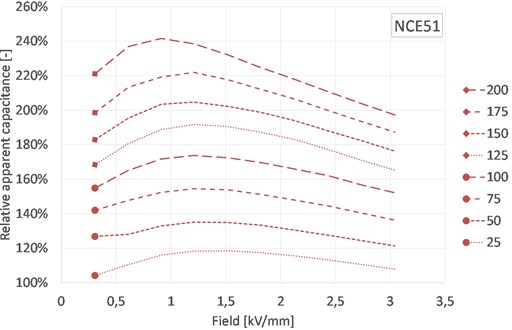
It is well known and reported that small signal capacitance increases with temperature below the Curie temperature [7]. Also, it is common knowledge that the apparent capacitance increases with the amplitude of the electrical field, in other words that for large signal, a piezoelectric element will draw more current than one could expect from its small signal capacitance [4]. These trends are clearly visible for both materials. It can be noticed that the behavior of the soft-doped material is more field-dependent. The interpretation is that the soft-doped PZT has a higher domain mobility [7], causing the apparent capacitance curve to reach a maximum around 1,5 kV/mm peak at room temperature. Above that value, we observe a saturation of the hysteresis, leading to a decrease in the apparent capacitance. As temperature increases, domain mobility is improved and the field at which the apparent capacitance peaks shifts to lower values.
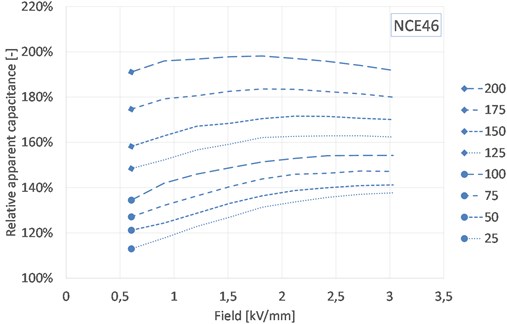
For the hard-doped PZT a similar behavior can be observed, but at much higher fields. As a result, at room temperature it is not possible to observe the saturation of the hysteresis. At high temperature, even though a shift is visible, the saturation field remains very high, around 2 kV/mm, illustrating the low domain mobility.
Fig. 2Evolution of apparent capacitance with electrical field and temperature for NCE46
2.2. Apparent dielectric losses
The apparent dielectric loss factor tan is calculated from the dissipated power, the RMS current and applied voltage according to Eq. (2):
Measurement results are given in Fig. 3 and 4 for the two materials and for different ambient temperatures.
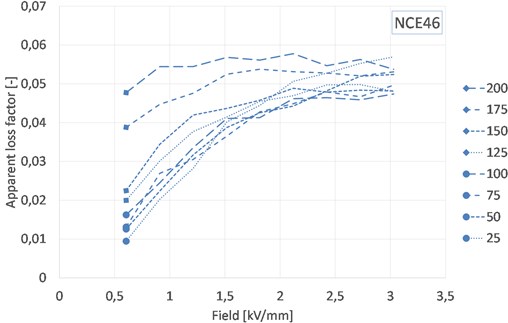
As previously reported [4, 8, 9] apparent dielectric losses increase significantly for large signal. This is the case for both soft-doped and hard-doped PZT which exhibit losses up to respectively 11 times and 19 times higher than the specified small signal tan of respectively 1,5 % and 0,3 %.
For soft-doped PZT, it is clear that the dielectric losses peak at the same electric field as for apparent capacitance. The general trend conforms to previous observations: the value at 3 kV/mm decreases with temperature and the curve at room temperature reaches a maximum around 1,5 kV/mm [8]. This observation confirms that, above this field, the hysteresis effect decreases in proportion. As a result, as temperature increases, the dielectric losses in this material at high electrical field do not increase as fast as one could fear.
For hard-doped PZT, the measurement is less accurate due to the lower dissipation. It is however still possible to see that the curve shifts to the left as temperature increases. At 200 °C, domain mobility is increased, so the material reaches a maximum value of dielectric losses around 2 kV/mm. For this material, the dielectric loss factor at high electrical field remain stable as temperature increases, meaning that the power loss increases with capacitance.
Fig. 3Evolution of loss factor with electrical field and temperature for NCE51
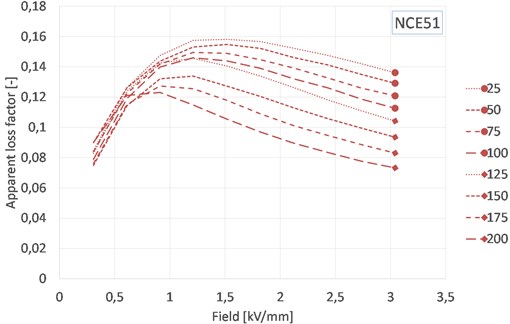
Fig. 4Evolution of loss factor with electrical field and temperature for NCE46
2.3. Free displacement
Free displacement is measured on stacks using an interferometer. The actuator is submitted to a trapezoidal signal from 0 to its maximum operating voltage and displacement is monitored over 2 minutes in order to measure and compensate for the creep effect. More details about the measurement method can be found in a previous publication [5].
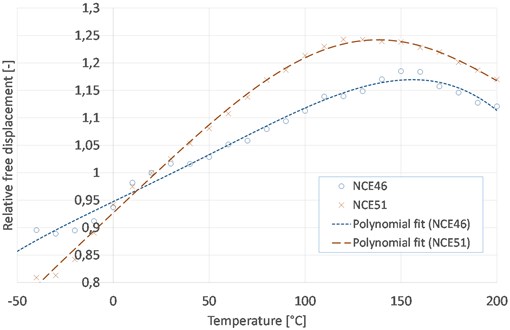
For comparison, the measured displacement is divided by the room-temperature value to give a relative free displacement. Results for both materials are given in Fig. 5.
As expected, free displacement increases with temperature. However, at a certain temperature (130 to 150 °C depending on the material), free displacement reaches a maximum and starts to drop. Still, at 200 °C, NCE51 and NCE46 provide respectively 23 % and 15 % additional free displacement compared to room temperature. Therefore, for most applications the worst case in terms of free displacement will be at low temperature.
Even though it occurs well below the Curie temperature of 330-360 °C for these materials, this effect is attributed to the loss of piezoelectric effect in some of the grains within the ceramic.
2.4. Stiffness
The measurement of large signal stiffness is challenging, particularly over a large temperature range. The reason is that it requires very precise (only a few microns) displacement measurement coupled with the application of large forces (several kN). Both measurement systems have to be either calibrated for operation over a wide temperature range, or placed far away from the unit under test, which causes errors. Specific setups are devised in the literature [10]; unfortunately, they were not accessible in the frame of this research. Therefore, a concession was made that only the small signal stiffness would be measured through the evolution of a major resonance.
Fig. 5Evolution of free displacement at 3 kV/mm with temperature
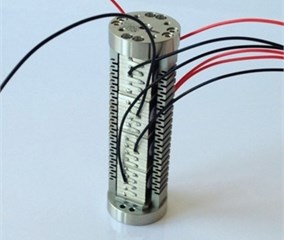
The units under test are composed of a piezoelectric stack enclosed within a stainless steel preloading frame (see Fig. 6), in free conditions. If we neglect the change in the stiffness of the preloading frame and the effects of thermal expansion, the first resonance frequency of such a structure is proportional to the square root of the actuator stiffness divided by the equivalent moving mass . The first resonance frequency can be clearly identified on the impedance spectrum of the piezoelectric element.
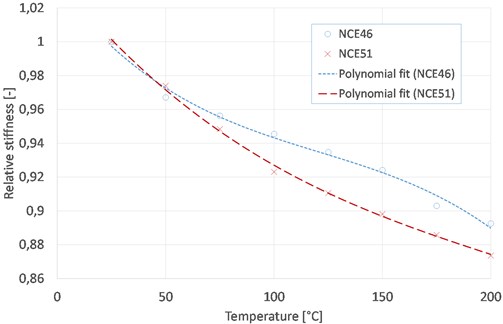
Using the frequency measurements, it is possible to calculate the relative change in stiffness of the actuator according to temperature, taking the room-temperature measurement as a reference. Results are presented in Fig. 7.
Measurements indicate that stiffness decreases for both materials as temperature increases, which is common for most materials. At 200 °C, stiffness is respectively 11 and 13 % lower compared to room temperature.
Fig. 6Parallel pre-stressed actuator (PPA). Courtesy of Cedrat technologies
3. Material comparison
The operation of a multilayer piezoelectric actuator is usually limited by one of these three factors: voltage, self-heating i.e. power dissipation or mechanical stress. The voltage range is usually specified by each manufacturer. Self-heating depends on thermal properties such as material and configuration of the surroundings, the presence of cooling or the dimensions of the sample. For the present comparison, actuators of similar dimensions (10×10×20 mm3) are considered. In these conditions, the thermal properties can be directly compared. Mechanical stress levels are related to the application. For this comparison we assume that stresses are not a limiting factor for any of the materials.
Fig. 7Evolution of stiffness with temperature
This comparison is performed according to two criteria: free displacement and mechanical energy. This is because the needs can be different from an application to the other. Typically, some applications will require large displacement but low force. This is the case for valve applications, for which displacement is critical. On the other hand, vibration control applications for example require a more equilibrated combination of force and displacement.
3.1. Free displacement
Assuming that the actuator operates far from a mechanical resonance, at low frequency the actuator can be operated at its maximum voltage amplitude, providing a relatively constant free displacement. As frequency increases, the power losses will become more significant and the actuator will move from a voltage limitation to a power limitation. In order to keep the dissipated power constant, it will be necessary to reduce the voltage amplitude, thereby reducing the motion.
On a displacement versus frequency graph, the measurements presented in Section 2.3 provide us with the ordinate of the first part of the envelope, when the actuator is running according to a voltage limitation.
The curves presented in Sections 2.1 and 2.2 can be used to calculate, for a given voltage amplitude , the frequency that will generate a given power dissipation :
At this point, we do not have the knowledge of the free displacement for any given voltage input. We do have measurements of dielectric charge and it is common to extrapolate free displacement from dielectric charge. However, past experience showed that this extrapolation can lead to higher values than actual. Therefore, a proportionality to electrical field was used, which was found to provide more accurate values.
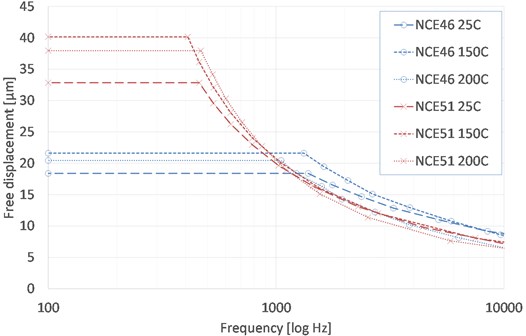
From these assumptions, the maximum free displacement of a given actuator can be plotted versus operating frequency. In a first portion, displacement remains constant as it is limited by the maximum operating voltage. In a second portion, displacement decreases as voltage is decreased in order to keep the power dissipation constant. Curves are given in Fig. 8 for the two materials and three temperatures, with an arbitrary power limitation of 10 W. Note that the absolute value does not affect the comparison since it will only shift the curves horizontally.
At low frequency, the soft-doped material provides a significant advantage over the hard-doped with a gain of 78, 86 and 85 % respectively at 25, 150 and 200 °C. The hard-doped material on the other hand can be operated at slightly higher frequency in particular at 150 °C where the gain reaches 40 %.
Fig. 8Comparison of maximum displacement versus frequency for two materials
3.2. Mechanical energy
For mechanical energy-critical applications, the actuator provides a combination of displacement and force. In an ideal design, mechanical impedance matching implies that the optimum load has the same stiffness as the actuator (or from a design perspective that the actuator should have a stiffness similar to the load). In such conditions, the mechanical work transmitted from the actuator to the spring load can be expressed as a function of actuator stiffness and free displacement as shown in Eq. (4):
Fig. 9Comparison of maximum mechanical work versus frequency for two materials
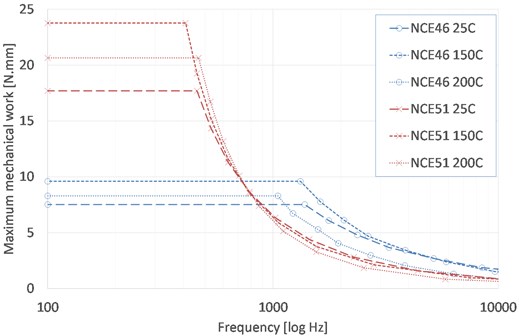
In the same manner as what is done in Section 3.1., the maximum mechanical work can be plotted versus frequency for the two actuators and with the same power limitation. Curves are given in Fig. 9.
Again, the soft-doped material is advantageous at low frequency, with factors around 2,4. But the hard-doped material also confirms its advantages in terms of frequency with gains of 50, 75 and 30 % respectively at 25, 150 and 200 °C.
4. Conclusions
Multilayer piezoelectric devices find numerous applications for quasi-static actuation, particularly in harsh environment. Unfortunately, the designer lacks complete models to assess the operating envelope of these devices. Through a pragmatic approach, the present describes this envelope for two typical materials submitted to elevated temperature. Curves are presented, documenting capacitance, dielectric losses, free displacement and stiffness and thereby providing a powerful tool for mechanical and electrical designers.
Furthermore, the knowledge of these characteristics makes it easier to select the best material for a given application. Soft-doped material (NCE51) provides a significant advantage (>75 % gain) in terms of displacement and mechanical work at low frequency. However, the study shows that this material will reach its limit in terms of self-heating at a lower frequency compared to hard-doped material (NCE46). Although this observation is not new, it is interesting to point out that the breakeven point shifts with temperature, so the specified temperature range has a significant impact on material choice.
References
-
Goueffon C. Noliac in Space. Actuator 2014 Presentation, 2014.
-
Schaüfele A., Härdtl K. Ferroelastic properties of lead zirconate titanate ceramics. Journal of the American Ceramic Society, Vol. 79, 1996, p. 2637-2640.
-
Kerkamm I., et al. Correlation of small- and large-signal properties of lead zirconate titanate multilayer actuators. Acta Materialia, Vol. 57, 2009, p. 77-86.
-
Heinzmann A., et al. Properties of PZT multilayer actuators. Actuator Proceedings, 2002, p. 403-406.
-
Mangeot C., Andersen B. Investigation of large signal properties of quasi-static PZT actuators at elevated temperature. Advances in Applied Ceramics, 2015.
-
Sawyer C. B., Tower C. H. Rochelle salt as a dielectric. Physical Review, Vol. 35, 1939.
-
Uchino K., Giniewicz J. Micromechatronics. Marcel Dekker Inc., New York, 2003.
-
Zheng J., et al. Heat generation in multilayer piezoelectric actuators. Journal of the American Ceramic Society, Vol. 79, 1996, p. 3193-3198.
-
Georgiou H., Ben Mrad R. Experimental and theoretical assessment of PZT modeled as RC circuit subject to variable voltage excitations. Mechatronics, Vol. 14, 2004, p. 667-674.
-
Schuh C., et al. Piezoelectric multilayer actuators for fuel injection systems in automotive area. Proceedings of SPIE 3992, Smart Structures and Materials, 2000, p. 165-175.
About this article

The research leading to these results has received funding from the European Union’s Seventh Framework Programme (FP7/2007-2013) for the Clean Sky Joint Technology Initiative under grant agreement No. 632604.
