Abstract
Experimental investigation on flow perturbations coupled with tube vibrations along the interstitial flow path are presented. A Normal Triangular tube arrays at different operating conditions with a pitch ratio of 1.85 was calculated. Interstitial flow perturbations Measurements all along the flow path were recorded by means of a hot-wire probe while monitoring the tube vibration in the stream wise and cross flow directions. A single flexible tube located in the centre of a rigid array was equipped with pressure transducers to observe the surface pressure deviation. The amplitude of flow perturbation and phase with respect to the tube vibrations were acquired at a number of positions alongside the flow path in the array. The consequence of tube vibration amplitude, mean gap velocity frequency, and measurement position of the hot wire probe on the amplitude of the flow perturbation and comparative phase were examined. It is observed that the perturbations of the fluid flow are primarily evident at the position of separation of the fluid flow from the test tube and decay swiftly with space from this position. It shows that the time delay between tube vibration and perturbation of the flow is associated with separation of the flow and enhanced vortices resulted due to the tube vibration.
1. Introduction
The fluid flow over the circular cylindrical structures has been widely investigated by many researchers especially tubes employed in heat exchangers, wind turbines etc. In the view of controlling the vortex shedding and thus reduce the flow-induced vibration, which is becomes a challenging problem in the field of fluid dynamics. The tube bundles are generally employed in lateral heat exchangers, the design parameters of the heat exchangers were still depending up on experimental correlations of heat transfer and fall of pressure which have boundaries and are of uncertain accuracy. The shell-and-tube heat exchanger is the most adaptable type of cross-flow exchangers [1] and one of the most employed types in the power and processing industries. Indeed, it records for more than 85 % of newly supplied heat exchangers to the chemical, petrochemical, oil refining and power companies in leading European nations [2]. Hence, better design and well-organized operation of such equipment can lead to significant energy savings. Aside from the heat transfer, the design also should consider for vortex-induced vibrations. Apart from the instability of the shear layers, the large-scale vortex shedding and the different wake interaction mechanisms are significant factors for larger-amplitude vibrations or structural resonance in the arrangement of the structures and causing severe structural failures, which leads to loss of production and higher repairing costs. As a result, trustworthy numerical methods for evaluating the existing (or the development of new) designs are urgently required in order to avoid expensive and wide-range of experimentation. Structures subjected to cross flow arranged in different configuration resulted in vibration excitation and noise formation throughout its operation mainly depends on its design aspects were investigated and briefly described [3, 4]. [5, 6] investigated excitation behavior of the circular cylinders arranged in Isolate, tandem and staggered arrangement, whereas [7] experimentally investigated the curved cylinder arranged in convex and concave configurations. Normal triangular arrangement [8], inline square arrangement [9-11], parallel triangle arrangement [9, 11, 12] investigated the characteristics of vortex shedding behavior inside several standard triangular arrangements, it is identified that three vortex shedding frequencies for the array with pitch to diameter ratio 2.08 for a range of (22200 45000). Whereas the high frequency was coupled with the cylinders placed in the first rows, further the lower frequency was associated with the cylinder in the downstream rows, despite the fact that the third frequency was the consequence of the nonlinear interaction between the above two and was precisely equivalent to their discrepancy. They also verified that the multiple frequency nature of vortex shedding observed for the first few cylinder rows were mostly depends on the Reynolds number (Re). [8] Have performed in the normal triangular tube arrays for the Reynolds number in a range of (760 49000) and identified that pitch-to-diameter ratio 2.0, a lower frequency vortex shedding is observed from the second row than the first row. [11] performed a wind tunnel experiments for the inline square arrays with pitch to diameter ratios of (1.21 2.83) and, with the exception of the smallest pitch ratio array, they also acknowledged two different vortex shedding frequencies in the first and second rows of the tube. The vortex shedding, acoustic resonance, fluid elastic instability, and Multi-phase buffeting are the four mechanisms were recognized to be causing extreme vibration excitation of tube bundles employed in the high pressure applications such as heat exchangers. Among the above mentioned critical vibration excitation mechanisms, the fluid elastic instability is considered to be having significant impact in the induced vibration excitation of tube bundles. The phenomenon of fluid elastic instability is mainly occurred due to the flow of fluid across the circular tube bundles operates above the critical flow velocity; further the transfer of energy from the fluid over tube bundles increasing the higher vibration amplitudes [13, 14]. Such type of higher vibration amplitudes will lead to sudden failures, extremely costly and significantly hazardous, particularly in the steam generators equipped in the nuclear power plant [15]. In the present study, an elastodynamic model is employed to understand the nature of response of a heat exchanger tube bundle made of same material with the similar dimensions. The studies of an elastic tube in a bundle have proven to be relevant not only for academicals but also for design aspects. [16] Made an assessment that upstream cylinders had a greater influence on the amplitude response than the cylinders in the downstream of the test cylinder. [17] Showed that adjacent tubes have a significant effect on the stability of the flexible tube, even though they are rigid. Additionally, based on an experimental verification and their hypothetical model, [18] and [19] show that a single flexible tube becomes unstable at fairly the same velocity as in a fully flexible array. In a comprehensive review, observation seems to be consistent especially for the parallel triangular array configuration. The tube located in the middle of the third row is the most prone to instability. Moreover, the parallel triangular array becomes unstable for lower reduced velocities than other arrays [20]. Hence, its stability threshold is a conservative value for all the other bundles. Further to find the optimized outcomes related to the stability of the structures can be analyzed by employing swarm and genetic optimization techniques [21].
In the present study, a single flexible tube located in the centre of square tubes arranged in normal triangular pattern, equipped with pressure transducers to observe the surface pressure deviation. The amplitude of flow perturbation and phase with respect to the tube vibrations were acquired at a number of positions alongside the flow path in the array. The consequence of tube vibration amplitude, mean gap velocity frequency, and measurement position of the hot wire probe on the amplitude of the flow perturbation and comparative phase were examined.
2. Experimental technique
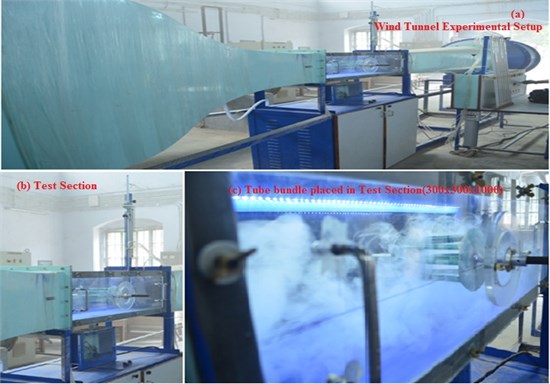
The experimental investigations were carried out in an open type low turbulence (0.1 % turbulence intensity) wind tunnel at the Fluid Flow Laboratory of Indian School of Mines, Karthik Selva Kumar and Kumaraswamidhas (2015). The wind tunnel has test section of 0.3 m×0.3 m×1.0 m, with a maximum wind speed up to 75 m/s. The temperature of the fluid flow was at 22 °C. Sequentially, before the 9:1 contraction a layer of honeycomb structures, several screens were established to decrease the turbulence. Pitot tube was outfitted to monitor the flow velocity of the fluid at inlet. The flow velocity distribution without considering the boundary layer in the test section area is found to be even within 1.1 %.
Fig. 1Wind tunnel test experimental setup
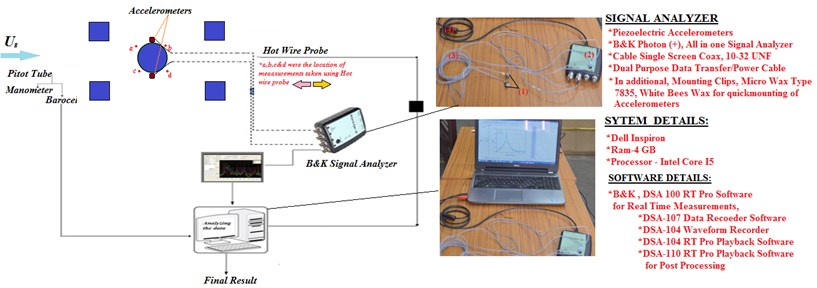
The elastically mounted tube is made of copper of diameter 18 mm surrounded by square shaped tubes having a span of 150 mm be used as adjacent tubes, further ratio of the tubes centre to centre spacing with respect to the tube diameter () is 1.85. Despite the elastically mounted circular tubes at the centre, the adjacent tubes were mounted rigidly in Normal Triangular pattern. To visualize the flow characteristics in the region of the test tubes surface, a smoke generator with a little orifice was positioned at a half a diameter of the tubes space in the upstream condition. The orifice of the smoke generator was positioned at the mid-distance of the tubes and about the equal height of the tubes axis in mid-distance. As shown in the Fig. 2, except the adjacent tube bundles, the test tubes located at the centre is outfitted with two accelerometers.
Fig. 2A brief sketch of data acquisition, signal measurement and analyzing setup
2.1. Data acquisition and analyzing
The instrumentation arrangement consists of two accelerometers manufactured by B&K with sensitivity of 100 mV/sec along with the frequency response up to 0.3-8 kHz. The two accelerometers were mounted at each edge of test tubes, which is elastically mounted in the centre of the array.
The configuration of the accelerometers was adapted to their receptive with respect to the vibration excitation of the tube in the stream wise () and cross flow () direction. Further the pragmatic output from each accelerometer was evaluated by make use of B&K dynamic signal analyzer. The obtained stream wise (), and cross-flow () displacement signals were digitized concomitantly at a sampling rate of 192K samples/sec by a 24 bit ADC, whereas the B&K signal analyzer is attached to a computer to stock up the data for additional privilege and to screen the amplitude spectra of the test tubes throughout the experimental investigation. Prior to measuring the vibration excitation in the test tubes, the voltage response from the data acquisition and signal analyzer system is calibrated in resistance to the vibration amplitudes.
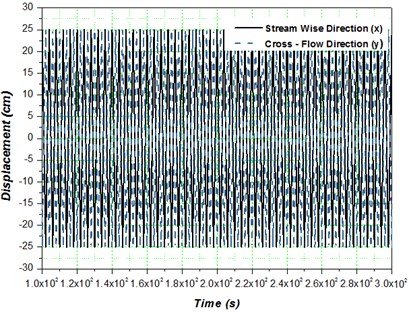
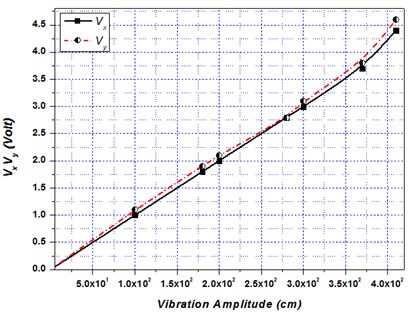
Fig. 3a) Displacement in the x- and y- direction, b) output voltage Vx and Vy v/s Vibration amplitude in stream wise (x) and cross- flow (y)- direction for single flexible tube. Karthik Selva Kumar and Kumaraswamidhas (2015)
a)
b)
While calibration, the test cylindrical copper tube with the two accelerometers at each edge was given a spherical motion. Besides that, a unique time series of displacements in the stream wise (), cross flow () direction are shown in Fig. 6(a). The amplitudes with regard to the sinusoidal output voltages for the stream wise () and cross-flow () directions were experiential and then plotted in resistance to the vibration amplitude. As shown in Fig. 3(b), the calibration records for both the stream wise () and cross flow () directions are set to a straight line , where A represent the vibration amplitude and represents the voltage output. Curve-fitting gives the values of the coefficients, 0.11 and 0.008. It is thus revealed that the voltage outputs can linearly symbolize the vibration amplitudes in the investigational range. To differentiate the vastness of the test tubes vibration, the real mean square value with respect to the vibration amplitude is articulated in a dimensionless form as:
where the diameter of the tubes is , rms values of the tubes displacement in and direction is characterized as and respectively. The tubes displacements were experiential by digitizing the yield voltages experiential from the measurement system which converts the tubes displacement into voltage signal. Whereas, the fine precision of the vibration measurement and data acquisition system ensued to be a source for the uncertainties in the measurement of displacement of the tubes in and direction. Further the basic parameters for the experimental analysis are recapitulated in the Table 1.
3. Result and discussion
3.1. Vibration amplitude
The prominences of the present study are to investigate the response of an elastically mounted test tube with respect to the adjacent tubes placed at normal triangular arrangement and the natural frequency of the test tubes with respect to the vibration excitation in the tubes. This segment presents the measurements of perturbation amplitude of the test tube all along the flow channel in the test tubes array.
Table 1Basic parameters such as, flow velocity, mass damping and damping factor
Case | S. No | ||||
Normal triangular | 1 | 22.5 | 3.39±0.03 | 0.00798±0.0004 | 0.17±0.008 |
2 | 23 | 3.39±0.03 | 0.00910±0.0003 | 0.19±0.007 | |
3 | 23.5 | 3.39±0.03 | 0.01035±0.0005 | 0.22±0.005 | |
4 | 24 | 3.39±0.03 | 0.00101±0.0002 | 0.024±0.006 |
Fig. 4Vibration excitation of the elastically mounted circular tube at normal triangular arrangement
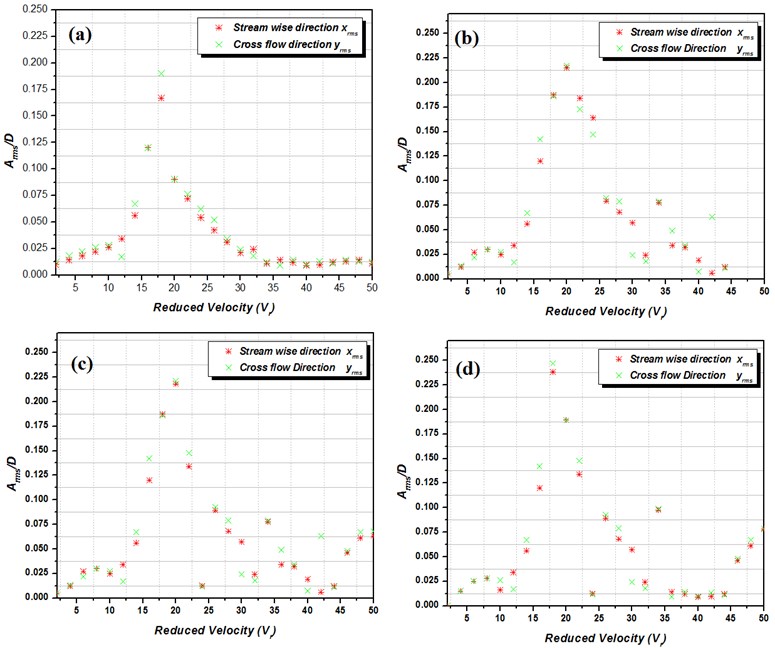
The investigation is performed using a single flexible tube located in the centre of a rigid arrangement of tubes. In the wind tunnel, the fluid flow velocity was steadily increased to the preferred point and kept undisturbed for about 25 s to attain a steady-state. Subsequently, the hot-wire probe was moved through four different locations (a, b, c and d) to gather the measurements. The fluid flow velocity was increased in ascending order and the process was repetitive until the test tube finally attain the state of unsteady fluid elasticity. The rms amplitude response of the test is obtained from the motion of the test tube in and direction respectively at different flow condition, which is briefly illustrated in the Fig. 4. It is experiential form the amplitude response of the test tube for each cases that, the vibration response of the test tube in stream wise direction and cross flow direction are characterized as two curves, which demonstrate that the curves having similar pattern with respect to increase in the flow velocity of the fluid. Further a steady rise in the response of test tube for each cases is observed to be mainly coupled with the increase in the mean gap velocity up to a point of 22.5 m/s where the amplitude of the test tube is measured about 1 % of the tube diameter (). A noteworthy enhancement in each cases, that the amplitude response of the elastically mounted test tube is observed to be fluidelastically unstable at the velocity of 24 m/s. Due to the existence of fluid elastic instability with respect to fluid flow velocity, a steady increase in the vibration excitation of the test tube is observed. Besides that, minimal vibration amplitude observed could be endorsed for the presence of turbulence in a view of that monitored section in the wake of upstream cylinders. Whereas the stern response excitation behavior of the test tube at the critical flow velocity is briefly conferred as follows; The fluid exhibits an enormous energy, when the flow velocity is elevated enough to excite the test tube to excite in a certain amplitude with respect to the tube natural frequency. As a result of the gradual increase in the flow velocity, the vibration amplitude is observed to be enlarged and consequently leads to a relentless excitation of the tube. At 24 m/s, the vibration excitation is observed to be fluid elastically unstable ( 0.245), which is shown in the Fig. 4(d). There is a significant enhancement in the RMS amplitude/Vibration excitation is observed for the elastically mounted circular tubes in the normal triangular arrangement.
3.2. Spectral response
Further the spectral measurements showed a minute enhancement in the peak frequency increased with respect to the increase in the fluid flow velocity shown in the Fig. 5. The related Strouhal number based on mean gap velocity is 0.24 which consent plausibly fit in the midst of the previous research work in circular tubes/cylinders. The hot-wire probe is employed to observe the mean flow velocity and turbulence level at each location index (a, b, c and d). Fig. 5. shows the frequency spectrum resulting from 50 sample averages for the both cases. The velocity perturbation amplitude is consent to be the magnitude of the peak in the spectral frequency with respect to the natural frequency of the tube. Besides that, similar power spectra were experiential regardless of the inlet fluid flow velocity once the velocity is high enough.
Fig. 5Spectral response with respect to test tubes vibration frequency for different flow velocity at 1 % D of posistion index (c) for normal triangular array
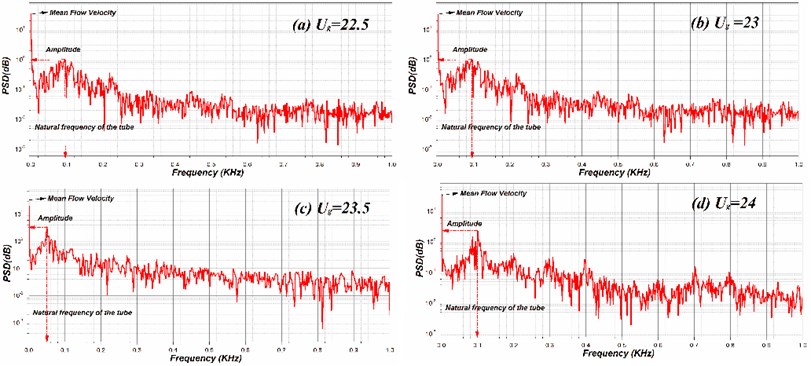
Whereas the experiential velocity spectra indeed exhibit multiple peaks, in which the highest peak were developed only nearer to the natural frequency test tube (89 Hz), which signify that the fluid flow fluctuate with respect to the natural frequency of the tube. Owing to the distinction in natural frequency and vortex shedding frequency leads to the development of volatile vortices, which further results in a higher excitation in the test tube. Accordingly, the vibration excitation in the elastically mounted test tube is a consequence of the existence of fluid elastic instability. Derived from the deeds of the vibration excitation in the test tube shown in the Fig. 4, it is observed that the vibration amplitude increases steadily with respect to the raise in the fluid flow velocity. According to Belvin, if vibration occurs in a sub or super harmonics with respect to vortex shedding frequency are normally identified with the presence of a single peak or with multiple peaks. Further the flow and the test tube excites in higher end with respect to the natural frequency, roughly self-sufficient of the inlet fluid flow velocity. The resonance of the test tubes all the way through the blending of the fluid is obvious that all the tubes having identical natural frequency.
3.3. Response with respect to hot wire probe positioned at multiple points in the flow regime
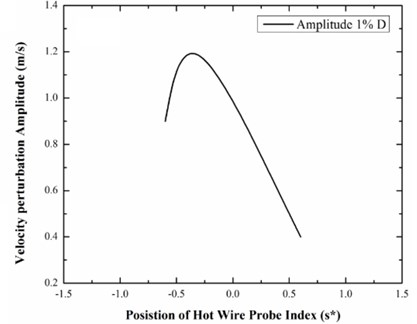
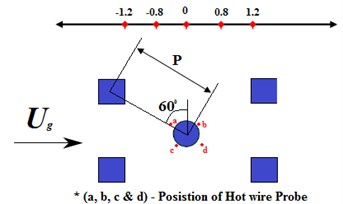
The amplitudes of flow deviation coupled with the vibration of the test tube along the fluid flow are shown in Fig. 6(a) for tube vibration amplitude of 1 % . The position of the measurements is illustrated using the curvilinear coordinates which follow the edge of the flow path along the stream wise direction and takes a value of zero at the cross flow contour throughout the core of the vibrating tube. The coordinates in the positive direction represents the downstream, while the negative direction represent upstream. The position of the hot wire probe index with respect to the measurement position scaled with the test tube diameter () is shown in Fig. 6(b). The observation was taken nearer to the vibrating tube as promising, proportionate with guarantee that the tube by no means crash with the hot-wire probe.
Fig. 6a) Flow velocity perturbation amplitude at different position for normal triangular arrangement, b) measurement position of hot wire probe
a)
b)
It is pragmatic in Fig. 6 that there is a pointed peak in the RMS perturbation velocity amplitude at position c, which overlaps with the position at which separation of flow aroused at the test tube. This is the position upon which vortices were spawned in the boundary layer of the test tube which further shedding into wake formation. There is in addition a much minor peak closer to point b which corresponds to the position with respect to flow attachment of the tube. The RMS velocity disturbance amplitudes perish very swiftly upstream and downstream of position (c), accomplished very undersized values at about –1.0. The downstream disturbance emerges to stabilize at higher values near 1.0. These interpretations imply that the flow disturbances are allied with the development of vortices all along the vibrating tube, which supports the hypothesis of Granger and Paidoussis (1996). The disturbance perishes swiftly ahead of their starting point which consent with the experimental interpretation of Tanaka and Takahara (1981), established that the flow disturbances were fundamentally self-indulgent contained by rows of the vibrating tube. It is significant to distinguish that these outcomes do not establish a direct fundamental affiliation between the assumed mechanism of the vortices and the time delay. Conversely, it is experienced that there are two excellent motivations to consider this as the most reasonable mechanism of the existing entrants, as were conversed in the prologue. Primary, the disturbances related with vibration of the test tube, were deliberated through the array of tubes is evidently prevalent at the position of separation of fluid flow from the test tube and perished with detachment from that position, i.e., the position at which vortices spawned in the boundary layer of the tube is discard into the tube wake at the frequency of vibrating test tube. Subsequently, the vortices mechanism is mainly based in essential hypothesis which is not the issue for the system of flow inertia. The final two systems were based on heuristic point of view which plead to the self-aspiration for substantial perceptive except be short of what it is regard as to be an indispensable establishment in the speculation.
3.4. Response with respect to vibration excitation of the test tube
Further it is indomitable that the vibration excitation resulted due to disturbance of fluid flow be the prevalent in the vicinity of the position with respect to the separation of fluid flow from the tube and swiftly perish away from that position, it is of concern to resolve the consequence of vibration excitation of the tube on this actions. As a result, the experimentation illustrated above was repetitive for three diverse RMS amplitude of the test tube; 0.5 % , 1.0 % , and 5 % . For the assurance, the hot-wire probe was not spoiled in the course taking measurements all along the centerline fluid flow lane with the vibrating test tube. The outcomes of the trails are illustrated in Fig. 10 for the Normal Triangular arrangement, where the disturbance due to flow velocity erstwhile standardized with the velocity of the test tube. It is prominent that the peak in the disturbance due to flow velocity has actually stimulated a little downstream, shimmering the reality that this measurement position is at the middle of the flow path, well beyond the vibrating tube.
Fig. 7Scaled flow velocity perturbation amplitude measured at various positions along the flow channel
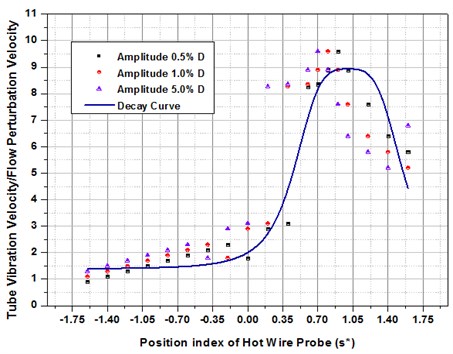
The common conduct of the disturbance velocity ratio as a function of detachment beyond the vibrating tube is the equivalent as that observed in Fig. 7. The disintegrated facts for the three dissimilar vibration excitation amplitude of the test tubes are astonishing, particularly in the upstream condition. In view of the fact that the tube vibration frequency was observed to be identical in all experimentation, this imply that the flow disturbance velocity amplitudes extent linearly with the amplitude of the vibrating tube, in any case beyond the range commencing 0.5 % to 5 % . Hence, the measurements of the phase lag are conferred in the subsequent sections.
3.5. Turbulence
3.5.1. Quantification of turbulence
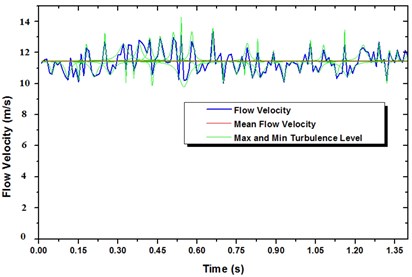
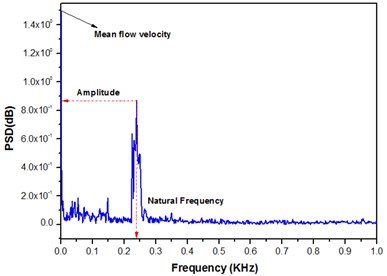
Experimental investigation is performed on a wind tunnel, where the fluid flow velocity was amplified incrementally to the desired value and left for about (30 s) to reach a steady-state. Then, the hot-wire probe was traversed through all location to collect measurements. The flow velocity was increased incrementally and the procedure was repeated until the tube became fluid elastically unstable. The hot-wire time signal was used to obtain the mean flow velocity and turbulence level at each location as shown in Fig. 8(a), while the averaged frequency spectrum of the hot-wire measurements was used to measure the flow perturbation amplitude as shown in Fig. 8(b). The spectra used were the results of 50 sample averages and the velocity perturbation component is the RMS amplitude of such a spectrum at the tube natural frequency.
Fig. 8Hot-wire measurements signal at point (H), tube vibration amplitude 1 % D, a) hot wire time signal representing the turbulence level, b) consequent frequency spectrum
a)
b)
Whereas the upstream turbulence level in the wind tunnel is less than 1 % which means that flow disturbances caused by tube motion in the very early tube rows should be detectable over turbulence. The present arrangement supports such an investigation. Further over a range of mean gap velocity 2-5 m/s, the RMS response of test tube is small, which is typically less than 0.21 % of the tube diameter. The excitation mechanism in this region is turbulent buffeting, and the very small amplitudes can be attributed to the low turbulence level. At about 6.6 m/s, the RMS vibration amplitude in the transverse direction suddenly increased to about 3.5 % of the tube diameter and the tube is considered to have become fluid elastically unstable. At about 6.5 m/s, the RMS response of test tube fall slightly despite the fact that violent vibrations of the adjacent tubes in the array were observed and the experiment was terminated at 12.4 m/s.
3.5.2. Response with respect to turbulence level
It is anticipated that, identifying the consistent flow structure of the fluid will be more complicated due to the raise in the flow turbulence; as a consequence, the results of turbulence on the consistency achieved at any particular position of measurements in the array was examined.
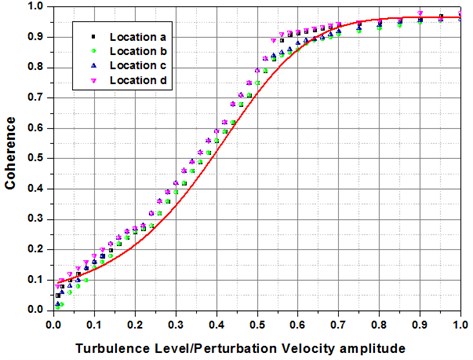
Recollect that the consistency represents the dependency flanked by two signals, and varies from 0 for two discrete signals to 1 for two entirely associated signals. In the current study, the consistency phrase refers to the consistency at the frequency of the tube vibration and measurements of phase at this frequency are considered again for a coherence level 0.5. The hot-wire probe was moved in the cross wise direction throughout the measurement position shown in Fig. 6, at each measurement position, the vibration response of the test tube, the flow disturbance velocity and the turbulence level were deliberated along with the phase amid the tube vibration and disturbance velocity in addition to the consistency among measurements were evaluated. The flow velocity was amplified steadily, and the measurement process was recurred until the tube became elastically unstable. It was established that the fraction of the flow velocity perturbation amplitude as demonstrated in Fig. 5, strongly affects the consistency amid the vibration of the tube and velocity perturbation as publicized in Fig. 9. As the fraction amplified from 0.1 to 0.2, a spectacular enhancement in the consistency level was identified. It was established that in order to achieve consistent phase measurements, the flow velocity perturbation amplitude be supposed to higher than about 15.5 % with respect to the turbulence level which correspond to a consistency superior than about 0.6.
Fig. 9Turbulence level effect on the coherence in between the fluid flow perturbation index and tube vibration for Normal Triangular arrangement
3.6. Response with respect to tube vibration frequency
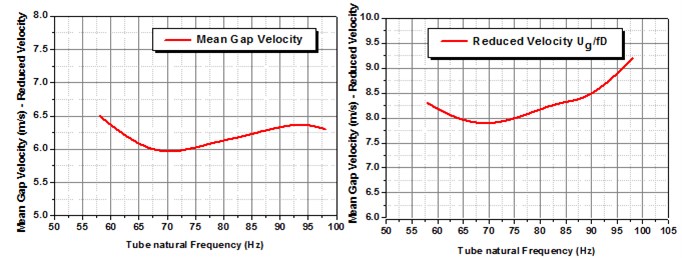
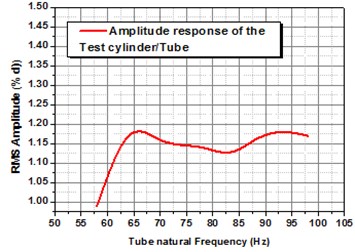
The consequence of vibration frequency of the tube was examined by determining the virtual phase involving velocity of the tube vibration and flow perturbation at a rigid position for some tube natural frequencies at the same time as retaining the vibration amplitude of the tube to a stable value. Sustaining the response amplitude of the tube to a stable value on 0.8 % was accomplished by bending the mean flow velocity. It was established that as the raise in the natural frequency of tube, requires a higher mean gap velocity to attain the similar response of rms amplitude as shown in Fig. 10. The correlation among velocity and frequency for predetermined RMS amplitude response of the tube is linear. Besides that, when the mean gap velocities been ranged to the subsequent frequencies of the tube, the reduced velocities () were established to be almost stable. Maintaining the RMS amplitude response of the tube is stable, the outcome of unreliable natural frequency of the tube on the phase angle involving tube vibration and the allied flow perturbations was then scrutinized as shown in Fig. 10.
It is distinguished that the virtual phase was nearly stable for all the tested vibration frequencies of the tube. Further it is facilitating to scrutinize the results of tube natural frequency of tube, the time flanked by tube vibration and flow perturbation was deliberated. This time delay is correlated to the virtual phase by:
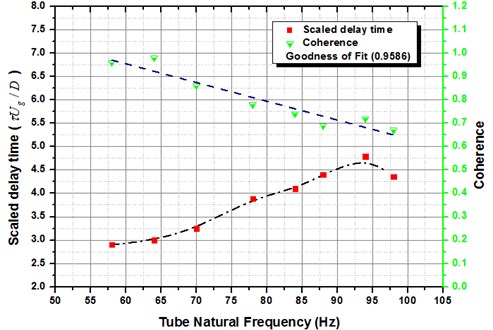
whereas the time hindrance among tube vibration and flow perturbation is the virtual phase angle, represents the signal period, and is the tube natural frequency. While the phase measurements are distorted to time hindrance in milliseconds (ms), it was established that the time hindrance diminished as the vibration frequency augmented. The time hindrance terms can be standardized by means of the mean gap velocity and the tube diameter , and the ensuing dimensionless time scale is . The consequence of tube vibration frequency on this time scale is shown in Fig. 12. It is observed with the intention of the scaled delay time amplified linearly with the raise in the tube vibration frequency with a goodness of fit 0.9586 for Normal Triangular arrangement. This deed is allied with the raised in mean gap velocity mandatory to attain steady vibration amplitude at the entire frequencies. It is also renowned that, as the tube frequency augmented, the consistency level reduced. This is allied with the raise in the turbulence level with escalating mean gap velocity.
Fig. 10Divergence in Mean gap velocity with respect to natural frequency of the test tube, to observe stable vibration amplitude for normal triangular arrangement
3.7. Response with respect to phase measurements along the flow channel
To assist the examination of instability proliferation allied with tube vibrations, the virtual phase was calculated all along the flow channel illustrated in Fig. 10 by means of two experimental trials. The first method is mentioned as “rigid position”, in which the hot-wire probe was set at one position and the flow velocity was amplified progressively in anticipation of the tube turn into elastically unstable. Then, the probe was stimulated to the subsequent measurement position and the process was repeated. The subsequent process is referred to as “steady velocity,” in which the velocity of the fluid flow was situate to an invariable value whereas the hot-wire probe was pass through all positions to accumulate the measurements.
Then, the velocity was amplified gradually and the hot-wire probe was moved across again through all positions. As anticipated, both trials created indistinguishable results contained by the investigational inaccuracy. The outcome of these testings are reviewed in Fig. 12, where the standardized time delay is intrigued as a function of position all along the midpoint of the flow conduit for four diverse vibration amplitudes of the test tube. According to the multiple features as a manifestation, primary, the outcome for dissimilar flow velocities and tube vibration amplitudes disintegrate very well apart from the upstream conditions, because the distances are bigger than test tube diameter. The exemption is relatively possible the outcomes of exceptionally little perturbation velocity amplitudes is observed as shown in Fig. 10, which are related with lesser consistency and enlarged experimental improbability. Subsequent, the time delay shows a in close proximity to linear enlargement, in both upstream and downstream, as of a value close to zero at point c, the peak in the velocity perturbation amplitude is coupled with the flow separation as of the tube vibration. This supports the proposition that the basis of the velocity perturbations by the side of the natural frequency of the tube along with vortices generation from the tube vibration. The gradient of the curvature is determining the rate of proliferation of the flow perturbations ahead of the source of the perturbation. This slope, , is specified by:
Fig. 11Phase Lag between the fluid flow perturbation index (d) and tube vibration (vibration of the tube is at 0.8 % D) for normal triangular arrangement
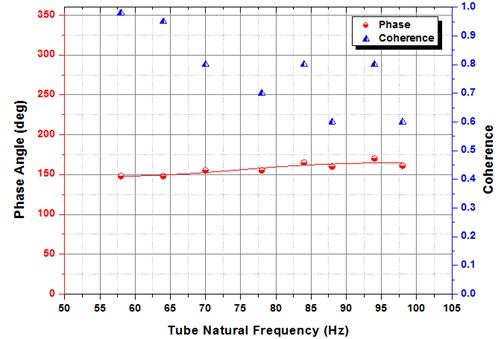
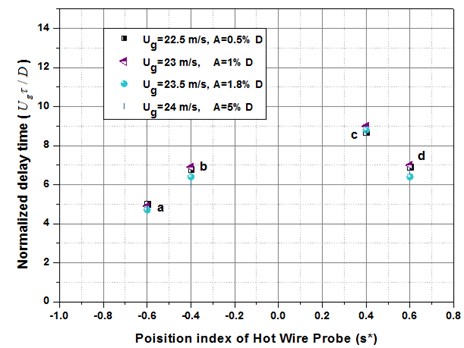
Fig. 12Outcome of tube frequency on normalized time τUg/D at the position (d), tube vibration amplitude 0.8 % D for Normal Triangular arrangement
On behalf of a steady mean gap velocity, the disturbance velocity of propagation, can be mentioned as:
Thus, merging the Eqs. (4) and (5), the gradient of the curvature in Fig. 11 can be written as:
This is the fraction of the mean gap flow velocity to the hindrance velocity of propagation. Investigating the perturbation dissemination along the downstream, in Fig. 13, it emerges that the proliferation time (gradient of the curvature) is linear from the source at c to the point d at the least gap flanked by the tubes in downstream. The flow visualization of eddy detachment in an inflexible tube array Polak and Weaver (1995) demonstrated that the escalation of coherent structures of the vortices in the premature tube rows in an array was multifaceted and robustly subjected towards a restricted velocity of the fluid flow.
Fig. 13Normalized time delay as a function of measurement position, f= 89 Hz, for various vibration amplitudes for normal triangular arrangement
4. Conclusions
The foremost observations strained from this investigation are as follows, the higher vibration excitation amplitude of the flow perturbations is deliberated at the tube natural frequency transpired close to the position of flow separation away from the test tube. It recommends that the outcome of the hindrance as of fluid flow separation along with the development of vortex shedding all along the boundary layer of the test tube. Further the flow perturbations amplitude response is allied with vibration excitation of the tube is observed to be perishing swiftly along upstream and downstream of flow separation from the test tube. The perturbation proliferation time ahead of the flow separation position, as considered from the phase measurements, which is in the array, partly indicate the interstitial gap flow velocity above the range of gap velocities deliberated. Subsequently it is emerged out to be fairly less significant in the upstream direction. The consistency among the tube vibration and flow perturbations by the side of the tube natural frequency, which is fall stridently when the trialed averaged peak perturbation velocity falls less than about 20.98 % with respect to rooted mean square turbulence velocity ratio. Besides that, it is observed that amplitude response of flow perturbation velocity is balanced unswervingly all along the vibration amplitude response of the test tube.
References
-
Kakac S., Liu H. Heat Exchangers: Selection, Rating and Thermal Design. CRC Press, Boca Raton, FL, 1997.
-
Butterworth D., Guy A. R., Welkey J. J. Design and Applications of Twisted Tube Exchangers. European Research Meeting on the Future Needs and Developments in Heat Exchanger Technology – Advances in Industrial Heat Transfer, IChemE, 1996, p. 87-95.
-
Helge Aagaard Madsen Low frequency noise from wind turbines mechanisms of generation and its modelling. Journal of Low Frequency Noise, Vibration and Active Control, Vol. 29, Issue 4, 2011, p. 239-251.
-
Cai Jian-Cheng, QI Da-Tong, LU Fu-An, Wen Xuan-Feng Study of the tonal casing noise of a centrifugal fan at the blade passing frequency. Part 1: aeroacoustics. Journal of Low Frequency Noise, Vibration and Active Control, Vol. 29, Issue 4, 2011, p. 253-266.
-
Carmo B. S., Sherwin S. J., Bearman P. W., Willden R. H. J. Wake transition in the flow around two circular cylinders in staggered arrangements. Journal of Fluid Mechanics, Vol. 597, 2008, p. 1-29.
-
Korkischko I., Meneghini J. R. Experimental investigation of flow-induced vibration on isolated and tandem circular cylinders fitted with strakes. Journal of Fluids and Structures, Vol. 26, Issue 4, 2010, p. 611-625.
-
Gustavo R. S. Assi, Narakorn Srinil, Cesar M. Freire, Ivan Korkischko Experimental investigation of the flow-induced vibration of a curved cylinder in convex and concave configurations. Journal of Fluids and Structures, Vol. 44, 2014, p. 52-66.
-
Polak D. R., Weaver D. S. Vortex shedding in normal triangular tube arrays. Journal of Fluids and Structures, Vol. 9, 1995, p. 1-17.
-
Price S. J. A review of theoretical models for fluid elastic instability of cylinder arrays in cross-flow. Journal of Fluids and Structures, Vol. 9, 1995, p. 463-518.
-
Simonin O., Barcouda M. Measurements and prediction of turbulent flow entering a staggered tube bundle. Proceedings of Fourth International Symposium on Applications of Laser Anemometry to Fluid Mechanics, Lisbon, Chemical Engineering, Vol. 75, Issue 5, 1988, p. 823-831.
-
Weaver D. S. Vortex shedding and acoustic resonance in heat exchanger tube arrays. Technology for the 90’s, ASME Special Publication, New York, 1993, p. 776-810.
-
Oengoren A., Ziada S. Vortex shedding in an in-line tube bundle with large tube spacing. Journal of fluids and Structures, Vol. 7, 1993, p. 661-687.
-
Pettigrew M. J., Taylor C. E. Vibration analysis of shell-and-tube heat exchangers: an overview – part 2: vibration response, fretting-wear, guidelines. Journal of Fluids and Structures, Vol. 18, 2003, p. 485-500.
-
Pettigrew M. J., Taylor C. E. Vibration analysis of shell-and-tube heat exchangers: an overview – part 1: flow, damping, fluid elastic instability. Journal of Fluids and Structures, Vol. 18, 2003, p. 469-483.
-
Païdoussis M. P. Real-life experiences with flow-induced vibration. Journal of Fluids and Structures, Vol. 22, Issues 6-7, 2006, p. 741-755.
-
Karthik Selva Kumar K., Kumaraswamidhas L. A. Experimental investigation on flow induced vibration excitation in the elastically mounted circular cylinder in cylinder arrays. Fluid Dynamic Research, Vol. 47, 2015, p. 015508.
-
Price S. J., Païdoussis M. P. A single-flexible-cylinder analysis for the fluid elastic instability of an array of flexible cylinders in cross-flow. Journal of Fluids Engineering, Vol. 108, Issue 2, 1986, p. 193-199.
-
Weaver D. S., Lever J. H. Tube frequency effect on cross flow induced vibrations in tube array. Proceedings of The Fifth Biennial Symposium on Turbulence, Vol. 1, Missouri, USA, 1977, p. 323-331.
-
Lever J. H., Weaver D. S. On the stability behavior of heat exchanger tube bundles. Part 1: numerical results and comparison with experiments. Journal of Sound and Vibration, Vol. 107, 1986, p. 393-410.
-
Pettigrew M., Taylor C., Janzen V., Whan T. Vibration behavior of rotated triangular tube bundles in two-phase cross flows. Journal of Pressure Vessel Technology, Vol. 124, Issue 2, 2002, p. 144-153.
-
Julai S., Tokhi M. O. Vibration suppression of flexible plate structures using swarm and genetic optimization techniques. Journal of Low Frequency Noise, Vibration and Active Control, Vol. 29, Issue 4, 2010, p. 293-318.
-
Blevins R. D. Flow Induced Vibration, Second Edition. Van Nostrand Reinhold, New York, 1990.
-
Granger S., Paidoussis M. P. An improvement to the quasi steady model with application to cross flow induced vibration of tube array. Journal of Fluid Mechanics, Vol. 320, 1996, p. 163-184.
-
Karthik Selva Kumar K., Kumaraswamidhas L. A. Experimental investigation on flow induced vibration excitation in the elastically mounted square cylinders. Journal of Vibroengineering, Vol. 17, 2015, p. 468-477.
-
Tanaka H., Takahara S. Fluid elastic vibration of tube array in cross flow. Journal of Sound and Vibration, Vol. 77, Issue 1, 1981, p. 19-37.
-
Ziada S., Oengoren A. Flow periodicity and acoustic resonance in parallel triangle tube bundles. Journal of Fluids and Structures, Vol. 14, Issue 2, 2000, p. 197-219.
Cited by
About this article

Authors gratefully acknowledge the support of research grant (No. SB/FTP/ETA-389/2012) awarded by the Department of Science and Technology (DST), Government of India.
