Abstract
For optimization of performances of a hydraulic-electricity energy regenerative suspension (HERS) unit, the tradeoff point was determined based on study of ride comfort and energy-regenerative characteristics of a HERS unit in this study. A HERS unit as a new energy reclaiming suspension device is equipped with an energy-harvesting hydraulic electromagnetic shock absorber (HESA). The HESA together with a quarter car was modeled based on theoretical analysis and experiments, in which the root mean square (RMS) values of the sprung mass vibration acceleration and the recovered power are regarded as the optimization objectives under different road excitation conditions such as the constraints (natural frequency, dynamic displacement, and dynamic load of wheels). The HERS unit was optimized after the relationship between the ride comfort and the energy regeneration was obtained. In comparison with the traditional suspension, the HERS unit may be utilized to improve the ride comfort and meet the vehicle-driving requirements. Moreover, the total input power may be saved by 34-100 W on average while the vibration acceleration is among 0.65-1.06 m/s2. Furthermore, it is verified that the HERS damping force control is the feasible under various load currents.
1. Introduction
70 % of oil consumption is used for transportation (DOE data [1]) in the United States, in which automobiles make up 62 % [1, 2]. On the other hand, only 10 %-16 % of the available fuel energy is used for vehicle-driving (DOE and EPA data [3]).
The kinetic energy is primarily dissipated due to vehicle vibration and motion for a car. As for traditional viscous shock absorbers, the excitation energy is dissipated passively into waste heat due to road irregularity and the transferred vibration might cause discomfort of passengers; thus, some effective measures should be taken to recover such considerable amount of kinetic energy dissipated in conventional vehicle suspension shock absorbers.
A great deal of research work was carried out to recycle such potential kinetic energy dissipation. Karnapp made variable vehicle suspension mechanical dampers including permanent magnet linear motors to change the external resistance [4]. Hsu indicated that driving, road conditions and the control algorithm were primary influencing factors for the recoverable energy and the active suspension may affect the suspension performances to some extent while recycling energy [5]. Suda et al. developed a self-powered active suspension unit with two linear DC motors (one as an energy regenerative damper recycling the kinetic energy; and the other one as an actuator) and the corresponding tests proved that their hybrid suspension unit may improve the isolation performance especially at high frequency [6]; moreover, one linear DC motor may also be used to realize the active control and energy recovery [7, 8]. Kawamoto et al. put forward an active suspension scheme integrating a ball screw mechanism and an electro-mechanical actuator, whose measured results indicate the regenerated power is 33 W [9]. Chen investigated a self-sensing magnetorheological (MR) damper for power generation to integrate energy harvesting, dynamic sensing and MR damping technologies [10].
Energy-harvesting shock absorbers having the potential of converting kinetic energy into electric power have been being is one of the research hotspots in both academia and industry for more than two decades. The semi-active suspension scheme was put forward to better compromise between energy consumption and suspension performances. There are various regenerative shock absorbers such as electromagnetic and regenerative hydraulic suspension units based on different operating principles and design schemes. The energy-harvesting shock absorbers are primarily classified into linear and rotary harvesters in accordance with motion modes of energy generators; the former is a linear generator in shape of a shock absorber to generate electricity due to relative linear motion between magnets and coils. An active damper including a linear motor for changing very rapidly the damping ratio was developed in Bose Corp; and measured results show that the suspension unit equipped with an active damper give rise to smoother ride [11]. Zuo et al. [12] designed a linear electromagnetic energy harvester to efficiently recover the vibration energy in a compact space. The prototype test results revealed that the harvester may generate energy (more than 16-64 W) per shock absorber while the RMS suspension velocity is 0.25-0.5 m/s. On the other hand, the latter being made up of hydraulic, ball-screw, and rack-pinion mechanisms as one type of electromagnetic regenerative shock absorbers takes advantages of a better price/performance ratio and smaller sizes; and the linear suspension motion may be converted into the rotary movement in generators.
Kawamoto Y. presented an electromagnetic damper including a DC motor, a ball screw and a nut, in which the linear motion is converted to rotary motion by the ball screw and the nut [13]. Zhang et al. designed a motor actuator prototype including a ball-screw mechanism and an energy-regenerative suspension mechanism [14], whose test results indicated that good shock isolation effects may be achieved under low-frequency road excitation conditions; however, such ball-screw motion converter resulted in poor performances and low efficiency at high frequencies.
Choi developed a rack and pinion mechanism to convert piston’s linear motion to rotary motion to improve the vibration isolation characteristics of the ball-screw harvester at high frequencies [15]. Li presented a regenerative shock absorber including a rack and pinion mechanism [16], in which a gearbox is equipped to increase rotational speed. However, backlash, friction and bevel gears lower its efficiency but increase its cost represents such mechanism.
A hydraulic motor is connected with an electric generator in a hydraulic regenerative shock absorber. A hydraulic rectifier bridge is used to convert reciprocating oil flowing of the damper into the unidirectional rotation of the hydraulic motor so that the vibration energy due to road irregularity may be absorbed represents supply of the damping effect [17]. Fang presented a new kind of shock absorber (namely a hydraulic electromagnetic shock absorber (HESA)) and the detailed analysis was carried out to its damping and energy regeneration characteristics; moreover, its prototype test results indicate that about 200 W may be recovered under the excitation conditions (3 mm and 10 Hz) [18]. Zhang studied the suspension performance effects of HESA and found the most remarkable influencing factor of the energy regenerative suspension unit; however, there is not any result in comparison with those of a traditional suspension unit [19].
A HESA (new energy regenerative suspension unit) is primarily to reduce the vibration disturbance from road roughness, acceleration/deceleration, and cornering to the chassis represents better ride comfort and good tire-ground contact force represents better vehicle handling and mobility, represents replacement of conventional shock absorbers and matching the vehicle perfectly, comparison between HESA and traditional absorbers was carried out in this study. Moreover, HESA was optimized by utilizing the multi-objective optimization method. The experimental verification was carried out to achieve better compromise between the ride comfort and the energy regeneration characteristics.
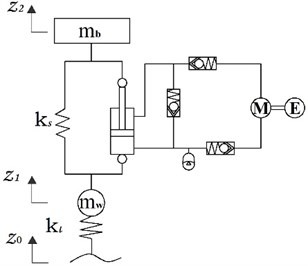
2. Modeling HERS
2.1. HESA model
HESA as a new kind of rotary regenerative shock absorbers may not only isolate vibration but also recover a part of energy dissipation, whose operating principle was presented in detail by Fang [18]; moreover, there is no significant difference in damping effects between the jounce and rebound strokes.
Fig. 1Schematic diagram of a HESA unit
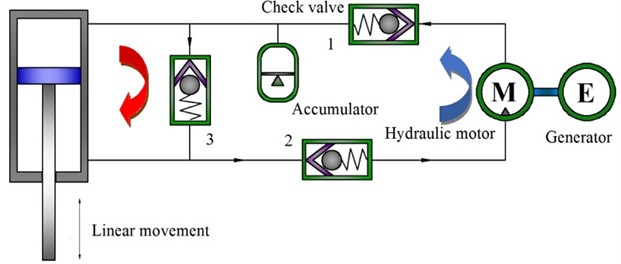
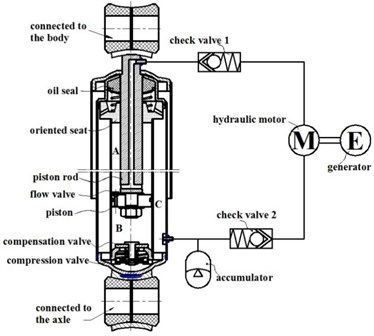
Thus, improvement was carried out to meet the vehicle shock absorption requirement. The new structure of HESA is shown in Fig. 1, which is composed of a hydraulic cylinder, check valves, accumulator, a hydraulic motor, a generator, and pipelines and so on and Where: the red and blue arrows indicate fluid flows in jounce and rebound strokes, respectively. The compression damping force should be smaller than the expansion one according to the vehicle shock absorption demand. The current HESA structure contributes to satisfy the demand based on various hydraulic circuits. The target vehicle’s shock absorber was reprocessed based on the operating principle of HESA, whose schematic diagram is shown in Fig. 2 and whose rebound valve (on the piston) rather than other valves is removed. The original piston rod is replaced with a hollow bar whose lower end is connected with the upper operating chamber to transfer oil from the upper operating chamber. In addition, the connecting holes are designed in the bottom of the storage tank and the upper end of the piston rod, to connect any external motor-generator system.
When the body moves downwards, the lower operating chamber B is pressurized so that a part of oil may flow into the upper operating chamber through the flow valve on the piston. Due to there being a piston rod in the operating chamber A, other oil flows into the compensation chamber C through the compression valve and the same oil flowing path as the that during the compression process represents a traditional shock absorber.
The compression damping force occurs in the compression stroke, when upper operating chamber A is pressurized while the body moves upwards so that oil may flow into the external energy recovery system through the hollow piston rod and the hydraulic motor may be driven from the compensation chamber C to the lower operating chamber B. Due to there being no rebound valve, the damping force is chiefly provided by the external motor-generator system during rebound stroke.
In conclusion, HESA works as a traditional shock absorber when its piston moves downwards; on the other hand, the damping force is not only similar to that of an ordinary damper in this process but also provide the damping force represents isolating vibration and recycling a part of vibration energy while the piston moves upwards.
It is found that the rebound damping force dominate major differences in major mechanical differences based on the previous analysis; however, the damping force is primarily from hydraulic pipelines, check valves and the motor-generator system in a HESA while the local pressure loss is neglected. While ignoring the internal leakage of the oil cylinder and the pressure of the compensation valve, the following pressure balance equation may be obtained to the upper operating chamber under high pressure in expansion stroke:
where: represents the pressure of the upper operating chamber; represents the pressure of the lower operating chamber, represents the pressure drop of the check valve (1, 2); represents the pressure drop of a hydraulic motor; and represents the pressure drop of a hydraulic pipe.
Fig. 2Plane diagram of a HESA prototype
While ignoring the fiction force between the piston and the cylinder wall, the damping force may be expressed by:
where: represents the damping force in the expansion stroke; represents the piston ring area on the side of the upper operating chamber; and represents the piston cross-sectional area.
While neglecting the pressure drop of any compensation valve, the following equation comes into existence for and :
where: represents the pressure of an accumulator.
Thus, the following equation may be obtained:
where: represents the cross-sectional area of a piston rod, .
While simplifying a check valve as a thin wall orifice, the pressure drop of a check valve may be calculated by:
where: represents the oil flowrate of the check valve (1, 2), represents the orifice area of the check valve ; represents the oil flow coefficient (0. 6); and represents the oil density.
Then, the pressure drop of a check valve may be expressed as follows:
As an energy conversion unit, a hydraulic motor converts the oil pressure in the hydraulic system to the mechanical energy so that the expansion pressure energy may be turned into the torque to the generator. The hydraulic motor rotary speed and output torque may be calculated by the following equations:
where: represents the hydraulic motor rotary speed; represents the flux of hydraulic motor; represents the displacement of the hydraulic motor; represents the volume efficiency of the hydraulic motor; represents the output torque of the hydraulic motor; and represents the mechanical efficiency of the hydraulic motor.
The generator is driven by a hydraulic motor so that its voltage and torque shall meet the following equations:
where: represents the induction electromotive force; represents the back electromotive force constant; represents the rotate speed of the generating rotor (; represents the output torque of the hydraulic motor; represents the rotary inertia of the generating rotor; represents the torque constant of the generator; and represents the inductive current.
The induction electromotive force may be expressed as , where represents the total resistance of the circuit. While ignoring the rotary inertia of the generating rotor, the following equation may be obtained:
As above, the accumulator is primarily to absorb redundant oil due to contraction of the rod cylinder. By taking the initial and final charging states into account and ignoring any middle course, the compression pressure of the accumulator may be calculated based on the Boyle’s law:
where: represents the gas polytrophic index; and represent the initial pressure and volume of the accumulator, respectively; and represents the displacement of the piston at the time (). When the input is sinusoidal wave (, denotes the maximum distance of piston), the linear friction loss of a hydraulic circuit during the expansion stroke may be expressed as:
where: and represent the length and inner diameter of the oil pipe, respectively; represents the fluid kinematic viscosity; and represents the flowrate of a hydraulic circuit.
While assuming the same flowrate in each hydraulic circuit during the expansion stroke, namely, , then:
From Eqs. (1)-(12), the expansion damping force may be calculated by:
For verifying the accuracy of the mathematical model, the measured and simulated results in Fig. 3 were compared under the sinusoidal frequency and amplitude (1.67 Hz and 50 mm).
Owing to the oil transportation characteristics, there exists oil loss travel distortion in actual tests so that the damping force may be distorted locally as shown in the lower right corner of Fig. 3. However, performances of the damper may not be influenced distinctly. It is found based on the verification experiments that the actual maximum damping force is 4516 N and the simulated one is 4370 N with the difference of only 3.23 %; thus, the simulated and measured damping forces are in good agreement and the proposed HESA as a damper is reliable in the vehicle suspension system.
Fig. 3Comparison of test and simulation results
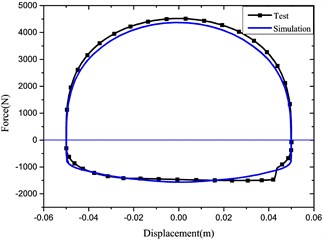
a) Force vs. displacement
b) Force vs. velocity
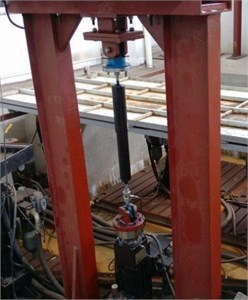
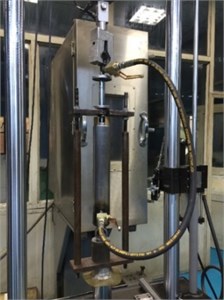
Fig. 4Traditional shock absorber and HESA test rig
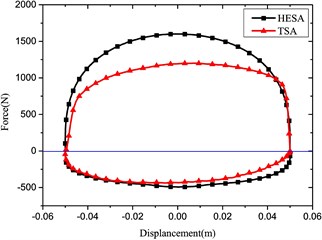
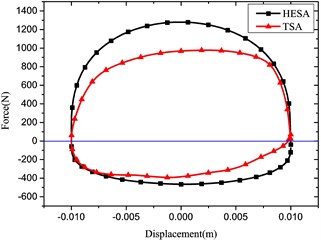
Based on experiments of the HESA prototype without battery load, the compression damping force was obtained, which is shown in Fig. 4. By combining the expansion damping force, the indicator diagram of HESA was presented. In comparison with those of the traditional shock absorber (TSA) under the same parameters, the results are shown in Fig. 5.
The comparison compression damping force results are in good agreement for the HESA and traditional shock absorber. On the other hand, the expansion damping forces are different under the same battery load.
Fig. 5Comparison of indicator diagrams of HESA and TSA
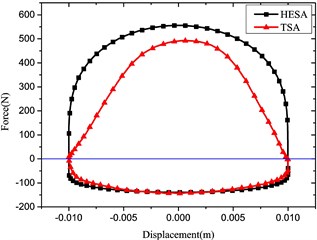
a) Frequency: 1 Hz, Amplitude: 10 mm
b) Frequency: 1 Hz, Amplitude: 50 mm
c) Frequency: 5 Hz, Amplitude: 10 mm
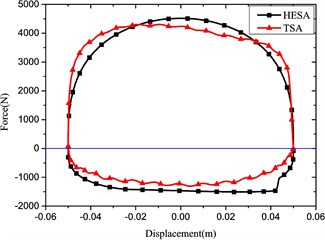
d) Frequency: 1. 67 Hz, Amplitude: 50 mm
2.2. HERS model
When the sprung mass allocation proportion is close to 1, the front and rear suspension systems are almost under independent vibration conditions. A quarter car was modeled to analyze the vehicle dynamics under certain road excitation conditions. As shown in Fig. 6, while the damping force of HESA is represented by , the modeling dynamics may be easily written as:
where: and represent the sprung and unsprung masses, respectively; and represent the vertical displacements of sprung and unsprung masses, respectively; represents the road input displacement; and represent the suspension stiffness and the tire stiffness, respectively.
In comparison with a traditional suspension unit, a HESA includes an energy-harvesting shock absorber so that the vehicle ride comfort and the recovery of suspension vibration energy may be achieved.
3. Optimization of HERS
As above, a hydraulic-electricity energy regenerative suspension may recover energy as that of a traditional damper. Therefore, it is of great significance to study the equilibration between energy-recovery and dynamic performances. The ride comfort and energy-recovery were optimized to achieve the optimal performances for the energy regenerative suspension unit.
Fig. 6Schematic diagram of a quarter car with a HESA
3.1. Optimization constraints
The hydraulic-electricity energy regenerative suspension unit shall ensure the satisfactory characteristics of comfort and handling performances so that the following constraints shall be satisfied.
3.1.1. Offset frequency
The sprung mass of a commercial vehicle is very large at full load so that the suspension offset frequency shall be relatively low and the operation stability of the vehicle may be reduced; therefore, the offset frequency should be restricted as:
3.1.2. Suspension dynamic displacement
A suspension system is equipped between the frame and the axles, between which a safe distance primarily dependent on the reasonable parameters of HESA should be maintained to tolerate any vibration due to driving pavement excitation. Thus, the suspension dynamic displacement is closely related to parameters of HESA and it is defined as:
3.1.3. Dynamic load of wheels
The dynamic load of wheels impacts the adhesion force between wheels and the road and is associated with the grip of the tires, which is vital to the handing stability and driving safety. When the RMS value of the tire dynamic load is constrained to 3, the probability of wheel jumping off the ground is less than 0.15 %. Thus, the dynamic load of wheels should be constrained and the dynamic load coefficient is expressed by:
where: represents the dynamic load coefficient; represents the vibration time; represents the dynamic loads of wheels; and represents the static load of wheels.
3.2. Optimization objectives
The vibration acceleration of the sprung mass is broken into the vertical, longitudinal and lateral components at the centroid of the whole vehicle for studying the vehicle ride comfort, among which the vertical vibration acceleration in the center of the sprung mass is taken as the objective function , whose RMS value is expressed by:
where: represents the RMS value of vertical vibration acceleration in the center of the sprung mass; represents the acceleration power spectral density function; and represents the frequency weighting function, which is expressed by:
Besides, the ride performance, the recovered power should also be regarded as representation of the hydraulic-electricity energy regenerative suspension. The more recovered power is desired on the premise that the ride comfort may be guaranteed. The RMS value of the recovered power is taken as another objective function , which is defined as:
where: represents the RMS value of the recovered power; and represents the function of recovered power time with time, which may be determined based on testing results.
3.3. Analysis of influencing factors
HESA dominate performances of a hydraulic-electricity energy regenerative suspension unit. As for HESA in Fig. 2, the primary influencing factors are listed in Table 1.
Table 1Primary influencing factors
Factor | Default value |
Diameter of piston, (mm) | 50 |
Diameter of piston rod, (mm) | 20 |
Initial pressure of accumulator, (Pa) | 2×10⁶ |
Volume of accumulator, (L) | 0.16 |
Hydraulic motor displacement, (cc/rev) | 5 |
Generator rotor resistance, (Ω) | 2 |
Load current, (A) | 3 |
Because the HESA prototype is manufactured based on the traditional shock absorber of the target vehicle, diameters of the piston and the piston rod is taken into account in this study. Moreover, the initial pressure of accumulator , the volume of accumulator , the load current , the internal resistance of the generator and the hydraulic motor displacement are regarded as primary influencing factors. The orthogonal tests were carried out to analyze their sensitivities.
For rational assessment of the level interval of each factor, the constraints were set up hereby in light of: (1) 1.3 1.8; (2) 65; and (3) 1/3; Class D road and the speed of 36 km/h are taken for calculation; and the standardized orthogonal table is applied. By combining the characteristics of the hydraulic-electricity energy regenerative suspension unit, those influencing of factors were analyzed for the ride comfort and recovered suspension energy, whose orthogonal experiment design and results are listed in Table 2.
Based on the above orthogonal experiment results, the ranges of various factors were calculated, as in Tables 3 and 4, where represents the arithmetic average of the evaluation index in level test for each factor. The impact degree of any factor on the test evaluation index is reflected by its range; and the larger the range is, the greater the impact is.
Table 2Design and results of orthogonal experiments
Test No. | (Bar) | (L) | (A) | (Ω) | (cc/rev) | Results | |
(m/s2) | (W) | ||||||
1 | 10 | 0.12 | 1 | 0.5 | 3 | 0.8002 | 50.2437 |
2 | 10 | 0.16 | 3 | 1 | 5 | 0.9435 | 40.0227 |
3 | 10 | 0.2 | 4 | 1.5 | 7 | 0.8833 | 27.236 |
4 | 10 | 0.24 | 5 | 2 | 9 | 0.8155 | 38.3218 |
5 | 20 | 0.12 | 3 | 1.5 | 9 | 0.7953 | 48.4565 |
6 | 20 | 0.16 | 1 | 2 | 7 | 0.7582 | 26.4632 |
7 | 20 | 0.2 | 5 | 0.5 | 5 | 0.9797 | 113.0685 |
8 | 20 | 0.24 | 4 | 1 | 3 | 1.1382 | 61.9949 |
9 | 30 | 0.12 | 4 | 2 | 5 | 0.9211 | 97.8645 |
10 | 30 | 0.16 | 5 | 1.5 | 3 | 1.1972 | 140.1889 |
11 | 30 | 0.2 | 1 | 1 | 9 | 0.7522 | 20.7837 |
12 | 30 | 0.24 | 3 | 0.5 | 7 | 0.8207 | 66.7374 |
13 | 40 | 0.12 | 5 | 1 | 7 | 0.8855 | 87.4213 |
14 | 40 | 0.16 | 4 | 0.5 | 9 | 0.8198 | 64.0196 |
15 | 40 | 0.2 | 3 | 2 | 3 | 0.9979 | 127.5257 |
16 | 40 | 0.24 | 1 | 1.5 | 5 | 0.7713 | 40.0761 |
Table 3Orthogonal experiment analysis of aw
0.861 | 0.851 | 0.77 | 0.855 | 1.033 | |
0.918 | 0.93 | 0.889 | 0.93 | 0.904 | |
0.923 | 0.903 | 0.941 | 0.912 | 0.837 | |
0.869 | 0.886 | 0.969 | 0.873 | 0.796 | |
Max | 0.923 | 0.93 | 0.969 | 0.93 | 1.033 |
Min | 0.861 | 0.851 | 0.77 | 0.855 | 0.796 |
Range | 0.062 | 0.079 | 0.199 | 0.075 | 0.237 |
Table 4Orthogonal experiment analysis of Prms
38.956 | 71.072 | 34.392 | 73.517 | 94.988 | |
62.496 | 67.674 | 70.686 | 52.631 | 72.758 | |
81.394 | 72.153 | 62.779 | 63.989 | 52.039 | |
79.836 | 51.783 | 94.825 | 72.544 | 42.895 | |
Max | 81.394 | 72.153 | 94.825 | 73.517 | 94.988 |
Min | 38.956 | 51.783 | 34.392 | 52.631 | 42.895 |
Range | 42.438 | 20.37 | 60.433 | 20.886 | 52.093 |
The influencing tendency of performances of the reclaiming energy suspension unit may be obtained for each influencing factor based on above analysis results, as in Fig. 7.
Fig. 7Diagrams of influencing factors
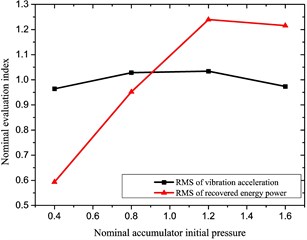
a) Accumulator initial pressure
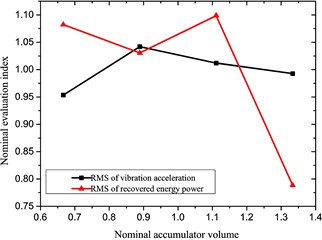
b) Accumulator volume
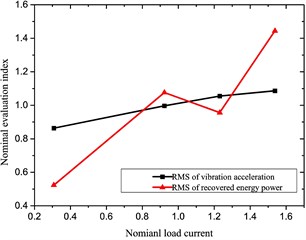
c) Load current
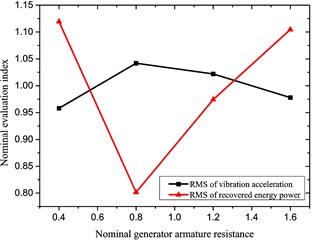
d) Generator rotor resistance
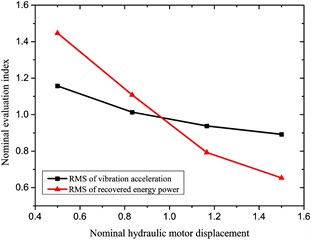
e) Hydraulic motor displacement
It is found from the above diagrams that those selected factors significantly impact the characteristics (especially the recovered power) of the reclaiming energy suspension unit; thus, they shall be taken into account to optimize performances of the hydraulic-electricity energy regenerative suspension unit, whose variable ranges are shown in Table 5.
Table 5The range of variables value
Initial | Minimum | Maximum | |
Accumulator initial pressure, (Pa) | 2×10⁶ | 1x10⁶ | 5×10⁶ |
Accumulator volume, (L) | 0.16 | 0.12 | 0.24 |
Load current, (A) | 3 | 1 | 10 |
Generator rotor resistance, (Ω) | 2 | 0. 5 | 5 |
Hydraulic motor displacement, (cc/rev) | 5 | 3 | 15 |
The optimization model may be expressed by:
where: and represent the minimum and maximum of each design variable, respectively.
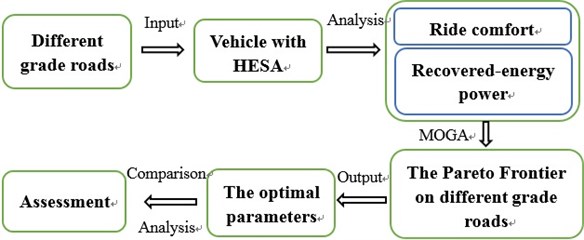
4. Optimization and result analysis
For optimizing comprehensive performances of the hydraulic-electricity energy regenerative suspension unit, analysis was carried out according to the following procedures in Fig. 8.
Fig. 8Analysis process diagram
4.1. Road excitation input
The road excitation is a primary external input for any suspension system. The random road profile is generated by Gaussian white noise passing through a first order filter [20] in this study:
where: is the vehicle speed; is the zero-mean Gaussian white noise input with intensity 1 in time domain; is the low cut-off frequency, 0.1 Hz hereby; and is the road roughness coefficient, whose geometric mean values are listed in Table 6.
It is known from Eq. (22) that correlates closely with the vehicle velocity. The velocity varies from 10 m/s to 30 m/s in this study.
Table 6Classification of road roughness
Road level | Geometric mean value of) / (10-6 m3) |
16 | |
64 | |
256 | |
1024 |
4.2. Optimal design
Based on our optimization model, the sobol sequence was selected to 30 initial points in the variable range. An improved non-dominated ranking based MOGA (MOGA-II) was used to perform the optimization process [21]. Since the design evaluation is very fast, a high number of generations was taken as 300 in this study. According to the recommended range, the probabilities of directional cross-over, selection and mutation were taken as 0.5, 0.05 and 0.1, respectively. DNA string mutation ratio was taken as 0.05. Thus, optimization results are shown in Fig. 9.
Fig. 9Optimization results for different grade roads
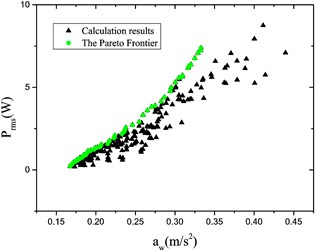
a) Road level:
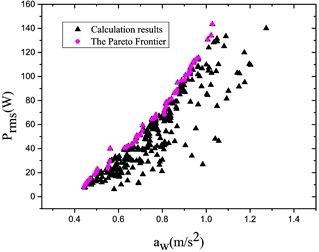
b) Road level:
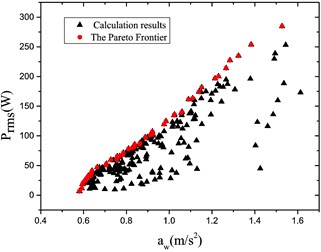
c) Road level:
d) Road level:
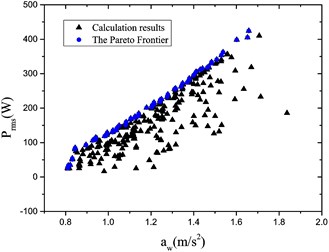
It is found from Fig. 9 that the Pareto Frontier occurs for various grade roads; and the relationship ( vs. ) may be obtained; in addition, the greater the acceleration RMS value is the more energy may be recycled within the same velocity context.
Fig. 10Optimized Pareto frontier
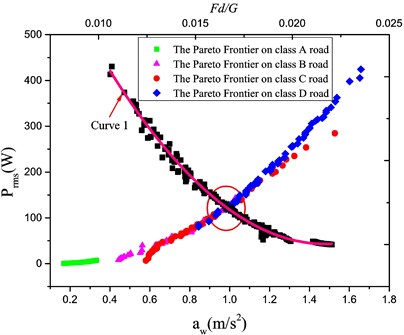
The relationship ( vs. ) in Fig. 10 reflect the monotone effect so that the tire dynamic load shall be introduced in the optimal design, in which the fitted curve 1 characterize the relation ( vs. ); moreover, the intersection area was taken as the optimal solution range to tolerate a small dynamic load. The optimal design was in Table 7.
Table 7The main influencing factors
Factors | Optimal design |
Initial pressure of accumulator, (Pa) | 3.4×10⁶ |
Volume of accumulator, (L) | 0.18 |
Hydraulic motor displacement, (cc/rev) | 5 |
Generator rotor resistance, (Ω) | 2.5 |
Load current, (A) | 2 |
4.3. Comparative analysis
In view of the above optimal solution, comparison and analysis were carried out to ride comfort effects for the energy regenerative suspension unit and the traditional one under different random pavements, whose results are shown in Table 8.
Table 8Comparative analysis results
Road level | Velocity (m/s) | Energy regenerative suspension | Traditional suspension | |
(W) | (m/s2) | (m/s2) | ||
10 | 4.671 | 0.188 | 0.298 | |
20 | 8.351 | 0.266 | 0.371 | |
30 | 11.562 | 0.326 | 0.422 | |
10 | 14.433 | 0.376 | 0.467 | |
20 | 24.180 | 0.532 | 0.605 | |
30 | 33.862 | 0.651 | 0.715 | |
10 | 24.323 | 0.532 | 0.603 | |
20 | 44.657 | 0.752 | 0.810 | |
30 | 69.098 | 0.921 | 0.972 | |
10 | 44.880 | 0.752 | 0.810 | |
20 | 96.899 | 1.063 | 1.119 | |
30 | 159.207 | 1.303 | 1.367 | |
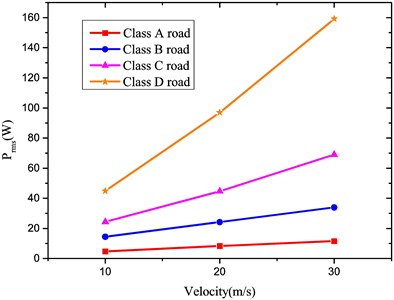
In comparison with that of the traditional suspension unit, the optimized reclaiming energy suspension unit brings about marginally improved ride comfort. Moreover, a part of vibration energy is recovered by HESA, as in Fig. 11.
Fig. 11Recovery power vs. velocity
For performance of ride comfort of the energy regenerative suspension unit, the amplitude-frequency characteristic was analyzed under a step excitation including the body acceleration, the suspension dynamic displacement and the relative dynamic load of wheels, whose results are given in Figs. 12, 13 and 14.
It may be known based on the amplitude-frequency characteristic of the body acceleration that their acceleration responses are basically the same within the range Hz; whereas, the acceleration response is smaller for the energy regenerative suspension unit while the excited frequency is more than . Especially, it is of great significance to improve the ride comfort under high frequency excitation conditions.
Fig. 12Amplitude-frequency characteristic of z¨2/z0
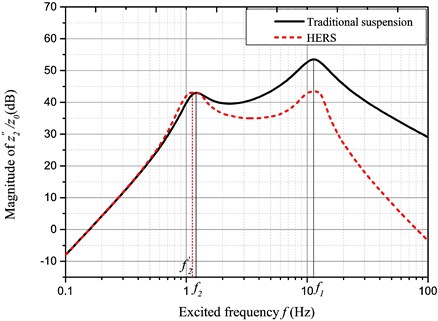
Fig. 13Amplitude-frequency characteristic of fd/z0
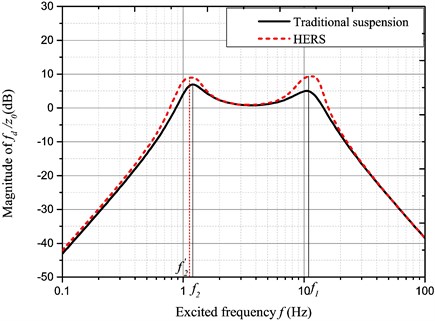
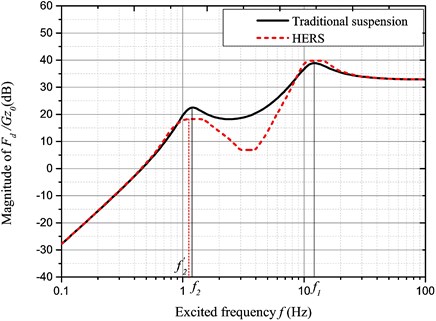
Fig. 14Amplitude-frequency characteristic of Fd/Gz0
Their amplitude-frequency characteristics include almost the consistent suspension dynamic displacement responses; on the other hand, the dynamic deflection response is intensified to a certain extent around two peak frequencies.
The tire dynamic load is dominant for choice of the optimal solution. It may be seen from Fig. 14 that the dynamic load response is improved between the two peak frequencies, which are very important for improving the driving stability.
The two peak frequencies represent the resonance frequencies of the sprung mass and the unsprung mass frequencies, respectively. The HESA energy recovery system may relieve the suspension effect so that the resonance frequency of the sprung mass shall be decreased correspondingly. Since the tire stiffness is much more than the suspension stiffness, the resonance frequency of the unsprung mass does not change significantly.
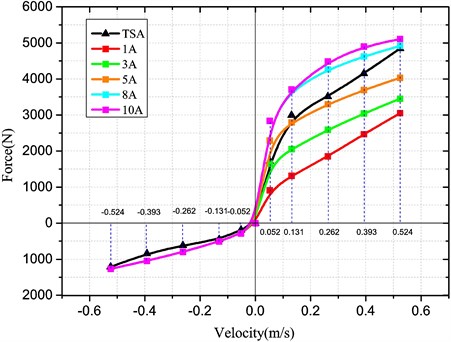
In contrast, the damping characteristics of a traditional shock absorber are given in Table 9. Based on the optimal parameters, different damping characteristic curves may be obtained under various battery load currents, as in Fig. 15. In comparison with the traditional shock absorber, the HESA may be utilized to control the recovery resistance by adjusting the load current, which is an important measure to perform control of the HERS.
Table 9Damping characteristics of shock absorber
Speed (m/s) | Recovery resistance (N) | Compression resistance (N) |
0.052 | 1722±374 | 191±78 |
0.131 | 2995±629 | 448±130 |
0.262 | 3511±557 | 620±149 |
0.393 | 4155±647 | 843±187 |
0.524 | 4847±757 | 1212±252 |
Fig. 15Damping characteristic curves of HESA
5. Conclusions
The characteristics (including ride performance and energy-recovery) of the hydraulic-electricity energy regenerative suspension unit were analyzed to compromise between the energy-recovery and dynamic performances. The RMS value of the sprung mass vibration acceleration and the recovered power were optimized under constraints (such as natural frequency, dynamic displacement, and dynamic load of wheels) and different road excitation conditions. The dynamic loads are taken into account to determine the optimal solution of HESA. The analysis results indicate that the ride comfort of the optimized reclaiming energy suspension unit may be improved remarkably so that it shall be quite suitable for the vehicle driving. In addition, it may be used to control the suspension effect since a part of vibration energy is recycled.
In summary, multi-objective optimization was carried out to optimized parameters of HESA and compromise between the energy-recovery and dynamic performances; thus, the HERS may be put into optimal operation; moreover, this study lays a firm foundation for control of energy regenerative suspension units.
References
-
Energy Information Administration Basic Petroleum Statistics, http://www.eia.doe.gov/basics/.
-
Economic Report of the President, http://www.whitehouse.gov/cea/ch6-erp07.pdf.
-
Advanced Technologies and Energy Efficiency, http://www.fueleconomy.gov/FEG/atv.shtml.
-
Karnopp D. Permanent magnet linear motors used as variable mechanical dampers for vehicle suspensions. Vehicle System Dynamics, Vol. 18, Issue 4, 1989, p. 187-200.
-
Hsu P. Power recovery property of electrical active suspension systems. Energy Conversion Engineering Conference, Proceedings of the 31st Intersociety, Vol. 3, 1996, p. 1899-1904.
-
Suda Y., Nakadai S., Nakano K. Hybrid suspension system with skyhook control and energy regeneration (development of self-powered active suspension). Vehicle System Dynamics, Vol. 29, Issue 1, 1998, p. 619-634.
-
Nakano K., Suda Y., Nakadai S., Koike Y. Anti-rolling system for ships with self-powered active control. JSME International Journal Series C Mechanical Systems, Machine Elements and Manufacturing, Vol. 44, Issue 3, 2001, p. 587-593.
-
Nakano K., Suda Y., Nakadai S. Self-powered active vibration control using a single electric actuator. Journal of Sound and Vibration, Vol. 260, Issue 2, 2003, p. 213-235.
-
Kawamoto Y., Suda Y., Inoue H., Kondo T. Electro-mechanical suspension system considering energy consumption and vehicle manoeuvre. Vehicle System Dynamics, Vol. 46, Issue 1, 2008, p. 1053-1063.
-
Chen C., Liao W. H. A self-sensing magnet orheological damper with power generation. Smart Materials and Structures, Vol. 21, Issue 2, 2012, p. 025014.
-
Jones W. D. Easy ride: Bose Corp. uses speaker technology to give cars adaptive suspension. IEEE Spectrum, Vol. 42, Issue 5, 2005, p. 12-14.
-
Zuo L., Scully B., Shestani J., Zhou Y. Design and characterization of an electromagnetic energy harvester for vehicle suspensions. Smart Materials and Structures, Vol. 19, Issue 4, 2010, p. 045003.
-
Kawamoto Y., Suda Y., Inoue H., Kondo T. Modeling of electromagnetic damper for automobile suspension. Journal of System Design and Dynamics, Vol. 1, Issue 3, 2007, p. 524-535.
-
Zhang Y., Huang K., Yu F., Gu Y., Li D. Experimental verification of energy-regenerative feasibility for an automotive electrical suspension system. IEEE International Conference on Vehicular Electronics and Safety, 2007, p. 1-5.
-
Choi S. B., Seong M. S., Kim K. S. Vibration control of an electrorheological fluid-based suspension system with an energy regenerative mechanism. Proceedings of the Institution of Mechanical Engineers, Part D: Journal of Automobile Engineering, Vol. 223, Issue 4, 2009, p. 459-469.
-
Li Z., Brindak Z., Zuo L. Modeling of an electromagnetic vibration energy harvester with motion magnification. ASME International Mechanical Engineering Congress and Exposition, 2011, p. 285-293.
-
Liu S., Wei H., Wang W. Investigation on some key issues of regenerative damper with rotary motor for automobile suspension. International Conference on Electronic and Mechanical Engineering and Information Technology, Vol. 3, 2011, p. 1435-1439.
-
Fang Z., Guo X., Xu L., Zhang H. Experimental study of damping and energy regeneration characteristics of a hydraulic electromagnetic shock absorber. Advances in Mechanical Engineering, Vol. 5, 2013, p. 943528.
-
Zhang H., Guo X., Xu L., Hu S., Fang Z. Parameters analysis of hydraulic-electrical energy regenerative absorber on suspension performance. Advances in Mechanical Engineering, Vol. 6, 2014, p. 836502.
-
Kaldas M., Henze R., Küçükay F. Improvement of heavy vehicles ride and braking performance via combined suspension and braking systems control. SAE International Journal of Materials and Manufacturing, Vol. 4, Issue 1, 2011, p. 535-552.
-
Fonseca C. M., Fleming P. J. Genetic algorithms for multi-objective optimization: formulation discussion and generalization. ICGA, Vol. 93, 1993, p. 416-423.
Cited by
About this article

The authors gratefully acknowledge the National Natural Science Foundation of China (General Programs: Grant No. 51075312 and Grant No. 51305314), and Wanxiang Group Technology Center.
