Abstract
The approach used to calculate structure surface vibration velocity and sound pressure level (SPL) is provided. Then structural vibration model and panels acoustic contribution are combined to investigate sound radiation from a vibrating structure. As for the shipboard cabin where the mariners work with high level requirement of the SPL, it’s necessary to build the boundary element model of shipboard cabin by obtaining the structural mode information and finding out characteristics of vibration velocity. Considering the effect of thin-shell-structure consoles and switchboards, the acoustic field inside the shipboard cabin and the panel contribution to the cabin are analyzed. The peak frequencies in the sound pressure spectrum at the field points and their corresponding panels with larger contributions to the cabin are found. Based on the modal shape analysis, damping is adopted to inhibit the predominant modes. In front of the console and the switchboard where the engineer on watch operate, at the height of one’s head with sitting posture and standing posture, four field points are laid out respectively. Then, the most obvious peak frequency is picked out as the frequency of attention. Vibration reducing measures like laying damping coatings and modular floating floors and so on are adopted to reduce the noise radiation of the plate in the ship cabin. Through the deck vibration transmission experiment, the damping performance of the modular floating floor is ascertained. A comprehensive assessment of the noise label in the cabin is needed to ensure that the sound pressure level meet the relevant requirements of the ship general rules.
1. Introduction
The fact that vibration affects the comfort of the personnel, reliability of equipment and the safety of the structure sparks the marine industry’s growing concern towards the prediction on Vibro-acoustic environment and ship’s vibration and noise reduction. With the constantly updated “Evaluation of Vibration in Merchant Ships” made by International Standardization Organization(ISO) and “Code on Noise Levels on Board Ships” and with more strict standards issued by International Maritime Organization (IMO), the performance design of noise and vibration (NV) on board is facing new challenges. Modal analysis is a mature approach of vibration and sound radiation prediction. By dispersing the structure, it can make a continuous infinite degree freedom question into a discrete finite freedom issue. What’s more, by using computer program, it can analyze the complex structure of the acoustic problems [1-3]. Document 4 proposes an operational modal analysis method for helicopter cockpit, which has been put into practice in the real helicopter. Through the plate contribution of the sound power which affects the cab wall, document 5 and 6 obtain the noise levels inside the cab of the excavator. Considering the self-structural model of the target vehicle, document 7 establishes the joint calculating model of finite element model and boundary element acoustic prediction model. According to occupants head position in the vehicle, noise level of acoustic field points is set, and analysis of the acoustic contribution of acoustics composition board is made. Targeted damping measures are adopted to reduce the vibration and noise processing, and verification is made through experiment. As for the cylindrical shell structure, the vibration and sound radiation of multiple-cabin finite cylindrical shell is studied, the effects of bulkheads on resonance radiation are analyzed by numerical calculations; the influences of the bulkhead numbers, the thickness and the location of exciting force on the radiated sound power are discussed and the effect mechanism is analyzed [4]. Numerical analysis of the 3-D ship acoustic model is built. The result is about the effect of different fire rating deck covering on vibration and acoustic performance of the ship cabin [5]. Document 10 is about the analysis of the deck structure of laying damping coatings which is based on the classical lamination theory of modal vibration characteristics, and the comparison of it and the equivalent model results of structural dressing quality. Document 11 is about studying floating floor structure by experimental tests and numerical analysis to address the low frequency noise issues of the ship engine control room. Taking a shipboard cabin as the research object, with sound pressure in 0-200 Hz as the research goal, corresponding numerical models are established concerning its structure and interior vocal tune. Through the simulating calculation, several points’ acoustic pressure spectrograms are received; after obtaining the peak acoustic pressure frequency, the contribution of acoustic plate is analyzed to obtain the main contribution plate. The modal shape is employed to locate the specific stickup location that partly prevents the damping. As for the model that strikes with damping, simulating calculation and real ship experiment will be needed. When all that mentioned above has been done, it’s necessary to check out the result of noise-reducing program after the optimized layout.
2. Sound radiation from vibrating structures analyzed based on structural vibration mode and acoustic radiation
The key point of calculating the power of the structural radiated frequency, the sound pressure and sound intensity of the acoustic field is to work out the normal velocity of the surface structure. As for any elastic structure when acted by external force, it’s normal velocity of the surface structure can be worked out by mode superposition method, as following:
is the normal velocity of the surface structure. is the Circular frequency. The is the coordinate of any point in the structure. is the modal number. is the maximum number of the modal number in the interesting range. is the modal amplitude which is determined by structure parameter and external excitation. For convenience, the following example is about the flexural vibration of the thin elastic plate with the shape of rectangle. When the rectangular plate is acted by the external excitation , it’s bending vibration equation is as following:
is the elasticity modulus. is the flexural rigidity of the plate. , are respectively the density and the thickness. is the vibration displacement of the plate. is time.
Assuming that the length of direction and the direction of the rectangular plate are respectively , and it’s left bottom is the origin of coordinates. Because of the simply supported boundary, the following equations come into being:
According to the boundary condition and the method of separation of variables, the equation of Eq. (2) can be obtained as following:
Working out the derivation of , the normal velocity of the surface structure is as following:
where and are the ordinal numbers of the normal modes of the and direction in the flat, which can also be called modality. is the modal number, is the modal amplitudes based on the . is the imaginary unity. is the modal amplitude of the order mode, is modal function. Modal Shape is shape formed in space of Modal function, which represents the distribution of the normal velocity of the surface structure under this mode of vibration:
where is the inherent frequency of the . , is damping ratio. is the generalized modal force, and is the area of the plate.
The boundary element method is used to calculate the structural acoustic radiation of the basic idea of replacing a regional integral by the boundary integral of it, the boundary equations after discretization contains the equations of unknown variables of boundary nodes only, and then on the basis of the finite element dynamic theory, the structural vibration and acoustical radiation are solved by the calculation of the structure vibration velocity responses. And according to the theory of acoustics, the Helmholtz boundary integral equation with green equation can be simplified to Rayleigh integral form when calculating the acoustical radiation from a plate which can be directly obtained the relationship between pressure and particle velocity as shown:
where is the observation point, is the point on the vibration plate, represents the distance between them, and are respectively the density and sound speed of the air, is wave number, .
Numerical method solves the sound field sound pressure, by dividing the elastic palate into several element surface that have the same area , which can be regarded as doing piston vibration. Assuming that the normal velocity of the th element surface center is , then discrete the Eq. (12), the sound pressure of any acoustic field can be acquired:
where is the distance of observation point and the th element surface center.
Assuming that is the coordinate of the th element surface center, according to Eq. (6), there is:
Then put Eq. (14) into Eq. (13), numerical solution of individual vibration modes radiated sound pressure can be worked out.
3. The vibration energy diffusion and noise radiation in shipboard cabin
3.1. The generic acoustics model of the ship cabins
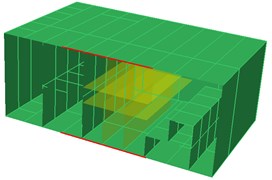
Analysis steps of the interior noise are proposed. This analysis can be used for preliminary design, constituted by four steps: modeling, vibration analysis, acoustic analysis and the overall analysis of interior noise. The shipboard cabin studied in this section is at the target ship’s cabin portside cabin deck level two frame (#) position: #43-#55, with all the decks and outer panels arranged longitudinally. Main engine room is framed transversely, side transverse with framing structure, counting the switchboard and console device into the model, to study the influence of acoustic and vibration performance of the shipboard cabin. Considering accuracy of calculation and the existing conditions, frame of space frame model acoustic and vibration characteristics is built. The plates that form the cabin are grouped into the boat deck, cabin trunks group and side structure unit, should all be defined by SHELL unit. The whole cabin reinforcing structure and local reinforcement of the cabin are grouped into transom unit and longitudinal girders which should be defined by BEAM unit. Even for the same types of units for different forms of structure, definitions of real constants are different. Size and quality of the unit are controlled by the long side of the control unit, in accordance with the corresponding physical characteristics of the model network as shown in Fig. 1.
Fig. 1Calculation model of the shipboard cabin
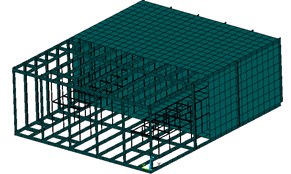
Finite element model coordinate system uses Cartesian coordinate system. The -axis is pointing longitudinally to the bow along the hull, while -axis is pointing molded breadth to the port along the ship. The -axis is pointing molded depth up along the hull, the both sides (H-side and side) are required constraints. Boundary conditions of the model are shown in Table 1. material parameters and real constants: plate: ET, 1, SHELL181 & MP, EX, 1, 2E11 & MP, PRXY, 1,0.3 & MP, DENS, 1,7800 & SECTYPE, 1, SHELL & SECDATA, 0.004,1. The damping materials are rubber, the constraint layer is made of steel plates, Select the ship’s top plate and floor board which make great contributions and constraining damping materials are applied, constrained damping structure: ET, 1, SHELL181 & MP, EX, 1,2E11 & MP, PRXY, 1,0.3 & MP, DENS, 1,7800 & MP, EX, 2,3.4E6 & MP, PRXY, 2,0.49 & MP, DENS, 2980 & SECTYPE, 2, SHELL. The complete method is used to have the harmonic response analysis. The calculation interval of the frequency is set to 0 Hz-200 Hz. The result is used as the input of the boundary element model boundary condition. It also applies Virtual.Lab to make calculation of sound field.
Table 1Boundary conditions of the model
Position | Linear displacement constraints | Angular displacement constraints | ||||
Direction | Longitudinal | Lateral | Vertical | Longitudinal axis | Lateral axis | Vertical axis |
H-side | Fixed | – | Fixed | – | Fixed | Fixed |
S-side | – | – | Fixed | – | Fixed | Fixed |
In the Virtual.Lab Acoustics, the calculated frequency ranged (1-200) Hz, taking steps to 1 Hz is found out, and the distribution of indoor acoustic field is calculated. The selection of the acoustics fields points to the following principles: forecast point should be as close as to the workman’s working position. In the meantime, it should be located with the height between 1.2 m (simulated sitting staff) and 1.6 m (simulated standing staff) above the deck. The settings of cabin acoustics field point are shown in Fig. 2, and Fig. 3. Boundary element model is shown in Fig. 4.
Fig. 2Schematic layout of the microphones inside the shipboard cabin
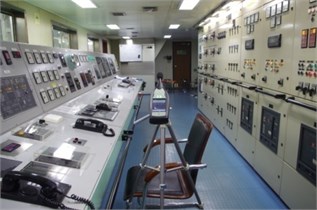
a) Simulated sitting posture
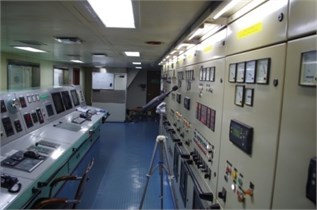
b) Simulated standing posture
Fig. 3field point selection
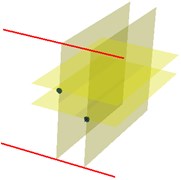
Fig. 4Calculation model of the shipboard cabin
After the analysis of acoustic frequency response, the sound pressure response spectrum can be obtained, from which it can be seen that, in the frequency response analysis bands, the frequency section 60-90 Hz and 170-190 Hz show significant response peak which is much higher than other corresponding peaks. Generally, the main response spectrum peaks in lower overall SPL cabin will be taken to reduce the overall sound pressure, from which it can be determined that there’s some potential noise and vibration problems with the target shipboard cabin in 60-90 Hz and 170-190 Hz band, which is main question-some frequency that needs to be paid a lot of attention to improve plate structure in the shipboard cabin and the noise response in field point.
3.2. The comparative analysis of the structural vibration model and panels acoustic nephogram
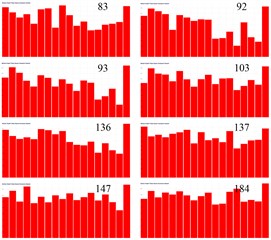
Vibration signal and noise signal of cabin’s components are closely related, which demonstrate the noise is mainly caused by the vibration of the shell. And the energy distribution of the noise signal and the vibration signal has the same rule. Thus, it can be seen that the energy of noises is bigger in the certain frequency sections. Frequency sections are the main target of reducing noises. As can be seen from the chart, the energy vibration and noise close to 183 Hz and 83 Hz are bigger and there is an apparent peak. Thus, these two frequency sections will be regarded as the key to reducing noise.
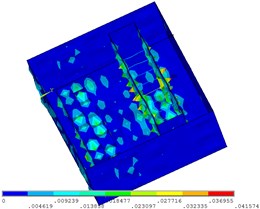
Fig. 5Sound pressure color nephogram and mode shape of the machinery control room (83 Hz)
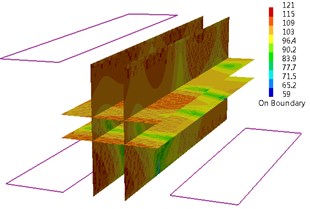
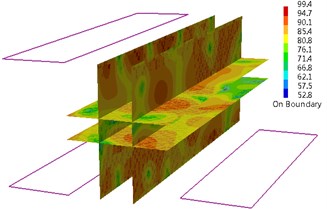
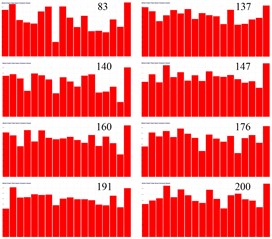
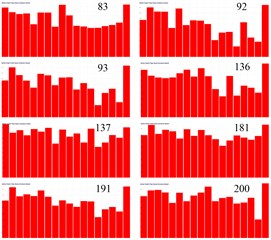
When in 83 Hz, the sound pressure level (SPL) of field point (FP) 1 is 76.68 dB; the SPL of FP 2 is 87.27 dB; the SPL of FP 3 is 92.44 dB; the SPL of FP 4 is 89.02 dB. As can be seen from the sound pressure color nephogram of field point, higher SPL in cabin appears in the front panel side of switchboard. When Cabin modal shape is in 83 Hz, a little vibration appears in the front panel side of switchboard as shown in Fig. 5. When in 92 Hz, the sound pressure level (SPL) of field point (FP) 1 is 78.51 dB; the SPL of FP 3 is 74.22 dB; the SPL of FP 4 is 72.37 dB. As can be seen from the sound pressure color nephogram of field point, higher SPL in cabin appears in the central control room engineers’ sitting position and higher sound pressure level appears in the field point 1 position. When Cabin modal shape is in 92 Hz, a little vibration appears in the front panel side of switchboard and a little vibration appears on the right of local vibration floor between the switchboard and console. Both of them are reflected in the sound pressure color nephogram as shown in Fig. 6. When in 137 Hz, the whole noise level in cabin is higher, especially in the field point 4 of control room engineer sitting position. The sound pressure level (SPL) of field point (FP) 4 is 91.95 dB. When in 137 Hz, the performance of cabin modal shape is the local vibration in cabin forward bulkhead and the right side of the switchboard panel and console panel as shown in Fig. 7. When in 147 Hz, higher SPL in cabin appears above the top of the console panel and higher SPL appears in field point 2. The sound pressure level (SPL) of field point (FP) 2 is 83.33 dB. The performance of cabin modal shape is the local vibration in front side panels of the console as shown in Fig. 8. When in 191 Hz, higher SPL in cabin appears in the front panel sides of switchboard and higher SPL emerges in field point 2. When in 191 Hz, the performance of cabin modal shape is the local vibration in the front side panel of switchboard and console. 1 SPL is 77.03 dB, compared with 76.8 dB of 2SPLand 78.85 dB of 3 SPL. Field point 3 has higher SPL. As can be seen from the SPL cloud, cabin higher SPL appears in the switchboard front panel side and higher SPL appears in field point 3 positions. The sound pressure level (SPL) of field point (FP) 3 is 78.85 dB as shown in Fig. 9. When in 200 Hz, cabin modal shape shows the local vibration in switchboard front side panel as shown in Fig. 10.
Fig. 6Sound pressure color nephogram and mode shape of the machinery control room (92 Hz)
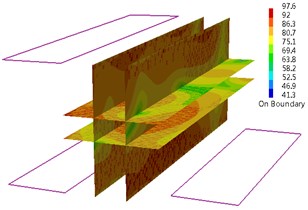
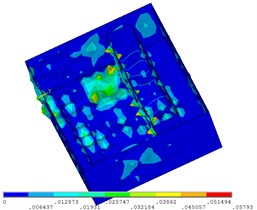
Fig. 7Sound pressure color nephogram and mode shape of the machinery control room (137 Hz)
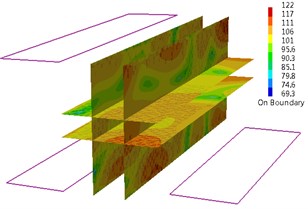
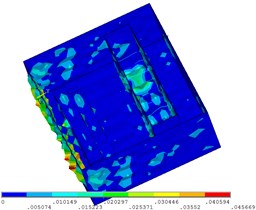
Fig. 8Sound pressure color nephogram and mode shape of the machinery control room (147 Hz)
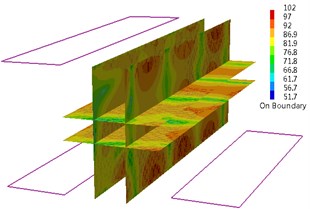
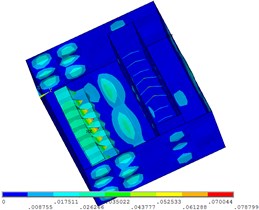
Fig. 9Sound pressure color nephogram and mode shape of the machinery control room (191 Hz)
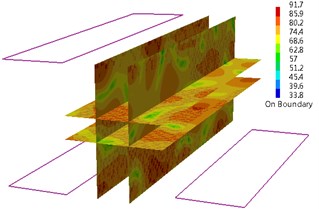
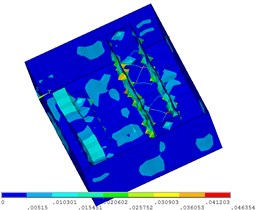
Fig. 10Sound pressure color nephogram and mode shape of the machinery control room (200 Hz)
4. The recognition of acoustic contribution of shipboard cabin panels
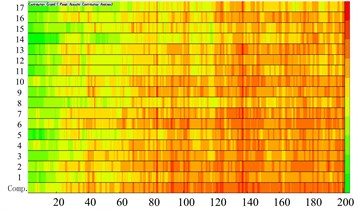
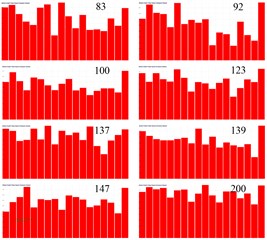
In order to analyze the acoustic characteristics of the compartment tunes, a field point needs to be arranged in front of engineer officer on duty at the console before sitting posture and head position corresponding to the distribution panel at the height of the layout of a standing posture field point, and four excitations of these field points under sound pressure response need to be calculated. The chart is the sound pressure spectrum of two field point of the curve under four Inspiring Conditions and the step is 1 Hz. From the chart, the peak frequency of the sound pressure field point remains unchanged. Corresponding to each excitation condition, the most obvious 6-7 peak frequency as the concerned frequency is picked out. This is the cabin interior noise energy which is concentrated in the frequency by controlling the cabin wall structure in the vibration energy of these frequencies which can effectively reduce interior cabin noise.
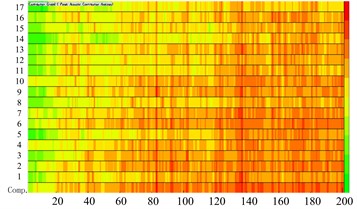
Cabin noise in 0-200 Hz is the structural noise mainly caused by the vibration of components in cabin. Field sound pressure at a point can be considered as the superposition of sound pressure caused by vibration of each component. To further analyze the composition of the chamber board member of the influence of the peak frequency of sound pressure at the field point, the acoustic boundary element mesh is divided into 17 groups to analyze the acoustics contribution of each component. 1 represents the left side of the cabin wall; 2 represents the cabin floor; 3 is on the behalf of the rear cabin wall; 4 represents the switchboard front panel; 5 represents the rear side of the bottom of the console panel; 6 represents cabin ceiling; 7 represents the front cabin sidewall panels; 8 represents the right panel switchboard; 9 represents the right side of the chamber wall; 10 represents the rear panel switchboard; 11 represents the upper rear console panel; 12 represents the console roof; 13 represents the console front side panels; 14 represents the left side of the console panel; 15 represents the distribution panel on the left panel; 16 represents the console desktop panel; 17 represents the console on the right side panel.
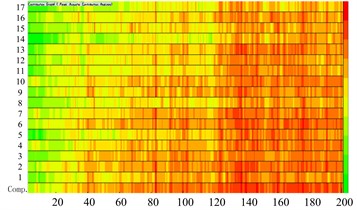
The components of acoustic contribution of the main peak compartments field point 1 include the floor cabin, cabin roof, cabin front wall, the rear panel on the console, roof console, and the console desktop panel as shown in Fig. 11 and Fig. 12.
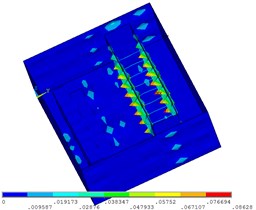
Fig. 11Panel color bars contribution display of cabin
a) Bars contribution of field point 1
b) Bars contribution of field point 2
Fig. 12Panel color bars contribution display of cabin
a) Bars contribution of field point 1
b) Bars contribution of field point 2
The components of acoustic contribution of the main peak compartments field point 3 include cabin floor, switchboard front panel, the top compartment panel, cabin front wall, and right wall of the chamber. As Figs. 9(b) and 10(b) show, the components of acoustic contribution of the main peak compartments field point 4 include left side compartment panel, cabin floor, switchboard front panel, cabin roof, cabin front wall, and a rear panel switchboard. As shown in Fig. 13 and Fig. 14.
The main peak response for each of the feature points is calculated for each plate corresponding to the acoustic characteristics of the contribution of each field point. The acoustic contributions of field points are judged by the nature of the plate for each feature point of the acoustic field contributions. Through the analysis of acoustic contributions and main peak acoustic contributions in shipboard cabin for the engineer on duty ear position the sites for 1-200 Hz frequency domain, the composition of the panel laying cabin constrained damping material can be found. The maximum contribution of four sections from field point 1 to field point 4 are followed by left side compartment panel, cabin floor, switchboard front panel, console the lower rear panel, cabin roof, cabin on the right wall, the console upper rear panel, roof console and the console desktop panel. There are also front cabin wall panel, switchboard rear panel and front console panel. The plate, for different features, has different contribution nature of acoustic field point.
Fig. 13Panel color bars contribution display of cabin
a) Bars contribution of field point 3
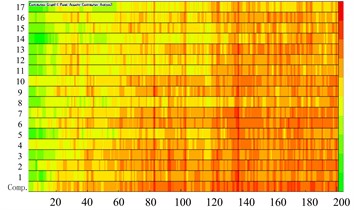
b) Bars contribution of field point 4
Fig. 14Panel color bars contribution display of cabin
a) Bars contribution of field point 3
b) Bars contribution of field point 4
Fig. 15Experimental snapshot of sandwich plate model
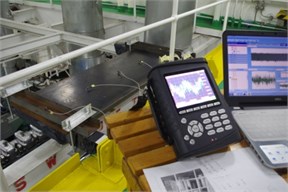
a) CoCo testing system and sensor arrangement
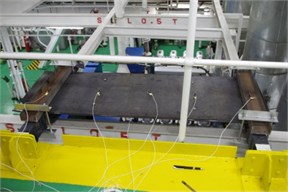
b) Model boundary conditions
5. Dynamic analysis and experiment of viscoelastic damped sandwich plate
In the transom plate between decks of the target ship cabin, 1.5 m×0.5 m single steel deck is fixed as shown in Fig. 15. Acceleration sensors is put in an intermediate position along the longitudinal direction of the deck as shown in Fig. 15 which makes a process of laying damping coating. Fig. 15 shows the CoCo testing system and boundary conditions, and sensor arrangement.
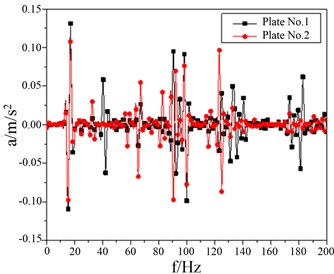
Experiment one: test plate (Plate No. 1) is 6 mm-thick outer hull plate. Experiment two: thick steel test plate (Plate No. 2) of 6 mm + with laying damping coating of 3 mm + galvanized steel of 3 mm. Plate No. 1 and Plate No. 1 sample are simply fixed on the main deck support beam. The diesel generator set as vibration source is stipulated to make an acceleration test for the corresponding point in the sample. The response signal is picked up by the acceleration sensor. According to the test data of plate 1 and plate 2, the energy differential chart can be drawn. As can be seen from the chart, rubber sandwich panel has a good effect on reducing vibration.
In this chapter, under 1/2 of the test plate is picked as a feature point acceleration as the target to make a comparative analysis. Vibration acceleration amplitude in 1/2 single steel vertical direction feature point is concentrated in –0.2m/s2 to 0.2 m/s2. Vibration acceleration amplitude in rubber sandwich panels featuring 1/2 point vertical direction is concentrated in –0.15 m/s2 to 0.15 m/s2. Acceleration peak of rubber sandwich plate is 75 %, which demonstrates that it has a better performance of reducing vibration as shown in Fig. 16(a). The performance of reducing vibration in is 1/2 floor of the frequency domain can’t be seen as clearly as that in the time domain. As can be seen in the chart, apart from a few frequencies magnitude higher than 0.05 m/s2, the acceleration amplitude in the frequency domain is under –0.0025 m/s2 as shown in Fig. 16(b). The changing rules of the vibration-reducing effect of damping material for all cabin deck remain unchanged, and vibration-reducing effect is the best in the low-frequency section. The damping volume has a peak in 20 Hz and 40 Hz. The main reason is damping has an apparent vibration-reducing effect in these two frequency section which emerge a stronger vibration modal as shown in Fig. 16.
Fig. 16Comparison of sandwich plate vibration reduction of experimental results
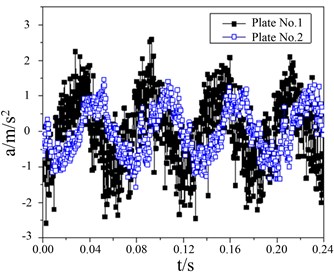
a) Comparison of time domain results
b) Comparison of frequency domain results
6. The identification of acoustic contribution in shipboard cabin panels of cabin and damping’s vibration-reducing effect
With the increase of frequency, the strong coupling tune and cabin structural vibration modes are gradually reducing. Each vibration plate is no longer a structure interaction with the adjacent plate and it usually works alone. Vibration and acoustic tune acoustic radiation field coupling typically use sound radiation coefficient to evaluate structural vibration. The importance of structural acoustic radiation plate is that it makes the structural vibration link with structural noise quantitatively. Suppose there are a lot of cabin plates and vibration velocity gets close, the effective way to reduce cabin structure-borne noise is to firstly control the vibration of that high acoustic radiation efficiency of the structural plate, not to reduce all the vibration plates. The effective way to reduce the vibration of the acoustic radiation efficiency is to add damp in the structural plates.
Calculating the acoustic contribution of working place of engineer on watch through the composition of the panel cabin, the acoustic contributions of field points are judged by the nature of the plate for each feature point of the acoustic field contributions. Through the analysis of acoustic contributions and main peak acoustic contributions in shipboard cabin for the engineer on duty ear position the sites for 1-200 Hz frequency domain, the composition of the panel laying cabin constrained damping material can be found.
The maximum contribution of four sections from field point 1 to field point 4 are followed by left side compartment panel, cabin floor, switchboard front panel, for different features, has different contribution nature of acoustic field point. it can be concluded that the best contributor late affixed damping layer can reduce its vibration speed and then reduce the acoustic response in this area.
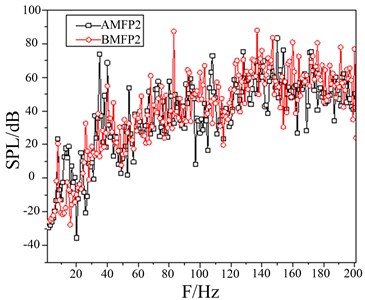
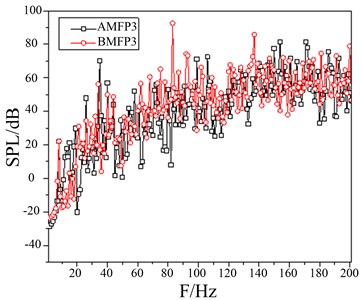
Calculating the acoustic response of 4 field points between 1-200 Hz and changing its structure, the goal of reducing the acoustic response can be achieved. Highest amplitude response peak decreases at above 10 dB. The attached damping layer has an obvious effect of reducing the acoustic response in control room, especially in the frequency section 60-90 Hz and 170-190 Hz.
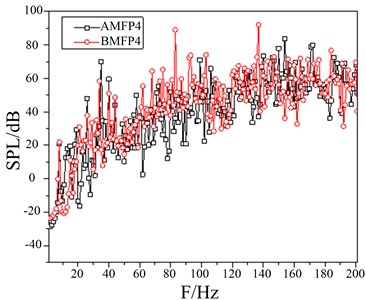
Fig. 17Comparison of SPL of field points
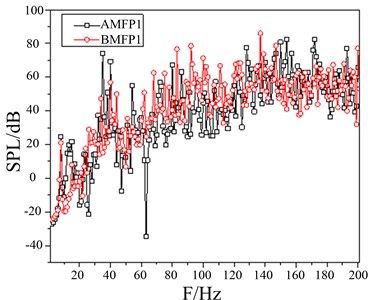
a) SPL of the field point 1
b) SPL of the field point 2
c) SPL of the field point 3
d) SPL of the field point 4
A damping coating design for the components of control room under inner harbor conditions can be made. Comparison of sound pressure level (SPL) between after modification field point 1 (AMFP1) and before modification field point 1 (BMFP1) are as follows: 83 Hz decreases to 31.84 dB; 92 Hz decreases to 52.44 dB; 137 Hz decreases to 32.96 dB; 147 Hz decreases to 41.86 dB; 200 Hz decreases to 11.43 dB as shown in Fig. 17(a). Comparison of sound pressure level (SPL) between after modification field point 2 (AMFP2) and before modification field point 2 (BMFP2) are as follows: 83 Hz decreases from 87.27 dB to 32.58 dB; 137 Hz decreases from 87.78 dB to 50.06 dB; 147 Hz decreases from 83.33 dB to 61.06 dB; 200 Hz decreases from 76.8 dB to 50.27 dB. Comparison of SPL at Field Point 3 shows: 83Hz decreases 45.51 dB; 92 Hz decreases 38.3 dB; 137 Hz decreases 35.72 dB; 200 Hz decreases 27.88 dB as shown in Fig. 17(d). Comparison of SPL at Field Point 4 shows, 83 Hz decreases from 89.02 dB to 36.34 dB; 92 Hz decreases from 73.78 dB to 42.51 dB. 137 Hz decreases from 91.95 dB to 37.27 dB. 147 Hz decreases from 73.05 dB to 70.52 dB as shown in Fig. 17(d).
According to distribution of field points in cabin, SPL at field points in shipboard cabin witnesses a declining trend. On field point position of the ear of engineer on watch, the sound pressure level of field points decreases. Taking the vibration of console and switchboard thin wall into consideration, it can be seen that the low-frequency noise is caused by the composition of the panel cabin and can get the distribution of SPL at field points in cabin. Thus, the main focus, in the preliminary stage of designing cabin, should be put into constructible design of shipboard cabin.
7. Conclusion
New strict standards and codes for noise level specification in ships will be adopted in 2014 by IMO. It is beneficial to control cabin acoustics performance during the ship overall design. This is the so-called cabin acoustic layout optimization design. Analyzing the ship cabin noise level and making it under reasonable limits are of great significance to ship designers. It puts forward the analysis steps for the ship cabin interior noise. It is constituted by four steps: modeling, vibration analysis, acoustic analysis and the overall interior noise analysis. According to the acoustic contribution analysis results based on body structure and the mode shapes plate, the allocation of local constraints damping in the shipboard cabin can be optimized. The structural modal shape body parts directly determine the position of the damping material, which can simplify the damping material optimal allocation calculation process. From overall linear response spectrum, a number of sub-peaks appear in the sound pressure response spectrum. Otherwise, some lower frequency response witnesses a decline and overall spectrum fluctuates violently, which demonstrates that the radiation characteristics of the damping layer attached to the acoustic compartment plates change more. And to the main corresponding peak, the reduction role of selective attached damping layer is prominent, which indicates the major change is characteristic of the local structure, and the improved way targets highly. It also shows the effectiveness of analysis of the acoustic panel contribution. The sound pressure changes of the other feature points are similar to this. Contribution cabin panels and cabin interior acoustic field position and excitation frequency have a close connection. By damping treatment and other ways, the noise of the field point can be reduced effectively. At the same time, noise control should be considered from the perspective of all crew as well as each crew member. Then measures to improve the overall noise level of the ship cabin should be put forward.
References
-
He Z. C., Liu G. R., Zhong Z. H. An edge-based smoothed finite element method (ES-FEM) for analyzing vibro-acoustic analysis. Computer Methods in Applied Mechanics and Engineering, Vol. 199, 2009, p. 20-33.
-
Zhang Jun, Cheng Gengdong, Zhao Wenzhong Acoustic design optimization for vibration of cylinder container coupled with interior acoustic field. Journal of Sound and Vibration, Vol. 328, 2009, p. 607-617.
-
Tong Z., Zhang Y., Zhang Z. Dynamic behavior and sound transmission analysis of a fluid structure coupled system using the direct-BEM/FEM. Journal of Sound and Vibration, Vol. 299, 2009, p. 645-655.
-
Hu Shi-meng, Wang Bin, Tang Wei-lin, Fan Jun Effects of bulkhead on vibration and sound radiation of finite cylindrical shell. Journal of Ship Mechanics, Vol. 17, Issue 7, 2013, p. 819-828, (in Chinese).
-
Yu Da-peng, Zhao De-you, Wang Yu Influence of damped material and the ship model of acoustic on the ship cabin noise. Journal of Ship Mechanics, Vol. 14, Issue 5, 2010, p. 539-548, (in Chinese).
-
Pierro E., Mucchi E., Soria L., Vecchio A. On the vibro-acoustical operational modal analysis of a helicopter cabin. Mechanical Systems and Signal Processing, Vol. 23, 2009, p. 1205-1217.
-
Shin C. W., Park S. Y., Kang Y. J., Kim S. J., Kwon Y. S. Interior noise reduction of wheel loader using boundary element method. Proceedings of 15th International Congress on Sound and Vibration, Daejeon, Korea, 2008, p. 1924-1931.
-
Gujarathi R. N., Kolte K. S., Kshirsagar K. G., Salunke T. S., Rao M. D. Panel contribution study of commercial excavator cab using sound intensity measurements. Proceedings of Noise-Con, Reno, Nevada, USA, 2007.
-
Zhang Yi-lin, Liao Yi, Mo Pin-xi, Zhou Jiang-qi, Yan Li, Jiang Wei-kang Damping optimization noise reduction technique based on modal and panel contribution analysis. Journal of Vibration and Shock, Vol. 34, Issue 4, 2015, p. 153-157, (in Chinese).
-
Hong Ming, Shun Yin-yin Natural vibration char acteristics of stiffened plates and plates with covering layer in ships. Journal of Ship Mechanics, Vol. 12, Issue 2, 2008, p. 311-318, (in Chinese).
-
Tongjun Cho Experimental and numerical analysis of floating floor resonance and its effect on impact sound transmission. Journal of Sound and Vibration, Vol. 332, 2008, p. 6552-6561.
Cited by
About this article

This work was financially supported by the Central University Basic Scientific Research Foundation.
