Abstract
For bridges in seismically active areas, lower horizontal bearing stiffnesses are usually designed to reduce structural seismic responses and protect the piers and foundations against earthquake damage. But lower horizontal bearing stiffnesses are not preferred under normal service conditions. In the seismic designs of Chinese bridges, shear pins are extensively integrated into bearings to resist horizontal force and restrict the relative longitudinal displacement between the superstructure and the substructure under normal service conditions. Shear pins are designed to be sheared off in a certain earthquake to activate the seismic isolation mechanism. For lack of a proper constitutive model for shear pin fractures, effects of shear pin fractures have not been considered in current bridge seismic isolation designs yet. In order to establish a constitutive model of seismic isolation bearings considering shear pin fracture effects, shear fracture tests of shear pins were conducted and an equivalent linear model was established. Ultimate deformation and equivalent stiffness of the equivalent linear model are approximately proportional to the diameter of the shear pin, and load capacity is approximately proportional to the square of the diameter of the shear pin. A series of shaking table tests were conducted, and then test results were compared with numerical results calculated with the equivalent linear model. It was found the equivalent linear model was accurate enough and suggested to simulate the effects of shear pin fractures in bridge seismic designs.
1. Introduction
Seismic isolation technology is a convenient, economic and advanced seismic design method to mitigate earthquake damage to bridges [1]. Generally, seismic isolation devices are used to lengthen structural natural periods and dissipate seismic energy so as to reduce seismic responses of structures [2]. Since the horizontal stiffness and load capacity of seismic isolation devices are usually insufficient, requirements under normal service conditions cannot be satisfied. Therefore, shear pins are integrated into seismic isolation devices extensively in seismic designs of Chinese bridges. They are used to resist horizontal force and restrict the relative displacement between the superstructure and the substructure under normal service conditions. Shear pins will remain intact in the event of a minor earthquake and will be sheared off in the event of a major earthquake. In the commonly used isolation bearings, such as friction pendulum bearing [3], double spherical seismic isolation bearing [4] and the cable-sliding friction seismic bearing [5], shear pins are all integrated and a similar seismic design philosophy is adopted.
Because of insufficient investigation of the mechanism of shear pin fractures, a proper constitutive model for shear pin fractures has not been available, so effects of shear pin fractures have not been considered in bridge seismic design. Up to now, studies of shear pin fractures are scarce in the world. Among them, Filipov et al. introduced an innovative design philosophy, named quasi-isolation. Using this philosophy, typical bridge bearing systems can be designed and detailed such that they act as fuses to limit the forces transmitted from the superstructure to the substructure [6]. The seismic performances of two typical configurations currently used in the state of Illinois were investigated. Type I bearings are steel-reinforced elastomeric bearings. Type II bearings are elastomeric bearings with Polytetrafluoroethylene plates and stainless steel sliding plates. It is found that bridges with Type I bearings showed reliable behavior in preventing system collapse, and bridges with Type II bearings were shown to be more prone to unseating because Type II bearings have poorer capacities for energy dissipation.
Steelman et al. took steel fixed bearings as fusing elements to achieve the quasi-isolated bridge response [7]. The steel pins or anchor rods are designed to rupture, and the fixed bearing plates will be released to slide on the supporting pier cap in earthquakes. Experiments were carried out in longitudinal and transverse directions, for two fusing mechanisms: weak anchors at the connection of the bottom plate to the pier cap, and weak pins at the connection of the top and bottom steel bearing plates. The cyclic responses of prototype steel fixed bearings demonstrate predictable sliding behavior. A parametric study of global bridge response demonstrated that the quasi-isolation design philosophy could limit the damage to the supporting substructure.
Xia et al. investigated the seismic behavior of a continuous girder bridge considering the effects of shear pin fractures [8]. The model was achieved by combining the initial hysteresis loop of friction pendulum bearing with a linear force-displacement curve using the finite element software ANSYS. It was found the load capacity of shear pins had a great impact on the bending moment of the pier and the impact should be considered in the seismic design. However, the parameters of the model are not proved and there is some doubt about the accuracy of the model.
A large 2/5 scale curved bridge model was tested on the four shake tables in the University of Nevada, Reno Large Scale Structures Laboratory [9, 10]. In the test, a kind of sacrificial shear key was used, which was composed of the shear pin, the “dog-bone”, and the trough. The performance of the columns and seat-type bridge abutments during the experiment were discussed and simulated by analytical approaches. The shear keys were modeled with a series of springs in the analytical simulation using OpenSees. However, the details of the model and its parameters were not discussed.
In this paper, shear fracture tests of shear pins were performed firstly, and an equivalent linear model for shear pin fractures was established. Then shaking table tests were conducted to investigate the effects of shear pin fractures. At last numerical results of seismic responses with the model were compared with shaking table test results and the equivalent linear model was verified.
2. Shear fracture tests of shear pins
To achieve the constitutive model for shear pin fractures, shear fracture tests of shear pins were conducted in the State Key Laboratory of Disaster Reduction in Civil Engineering, Tongji University. The test setup consisted of a bottom plate anchored on the ground, a top plate on the bottom plate, and a 50 ton actuator anchored on the reaction wall to pull the top plate, as shown in Fig. 1.
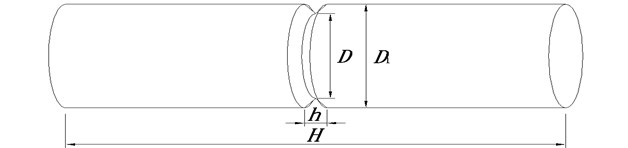
All the shear pins are made of steel, and the actual yield and ultimate strength of the material are 360 MPa and 525 MPa, respectively. Each shear pin is a cylinder with a V-shape groove in the center, as shown in Fig. 2. For all the shear pins, 200 mm, 10 mm and 10 mm, where represents the diameter of the central section. Therefore, the minimum sectional area and the weakness of each shear pin are in the center, and the central section is designed to be sheared off in earthquakes. The kind of design is helpful to isolate the location of the shear fracture. Four kinds of shear pins numbered from A1 to A4 are manufactured with 10, 15, 20, 30 mm, respectively.
Before a test for A1, A2 and A3, two same shear pins were inserted in the holes of the same diameter in the top and bottom plates. Before a test for A4, just one shear pin was inserted because the 50 ton actuator was not able to shear off two A4 shear pins simultaneously. The central sections of the shear pins were located at the interface between the top and bottom plates. In the test, the bottom plate was anchored on the ground and the actuator was controlled to pull the top plate. Then the shear pins between the two plates would be sheared off by the shift of the top plate. Force-control loading mode was selected to operate the actuator. The loading rates were 50 kN/s, 250 kN/s, 1000 kN/s, 1500 kN/s, 2000 kN/s, and numbered as Rate 1 to Rate 5 respectively.
Shear forces and deformations of shear pins during shearing off processes were measured. Shear forces were measured by the load transducer in the actuator and deformations were measured by a displacement transducer installed between the top and bottom plates. It was found that each shear pin was sheared off when the shear force reached the maximum value.
Fig. 1Test setup of shear fracture tests
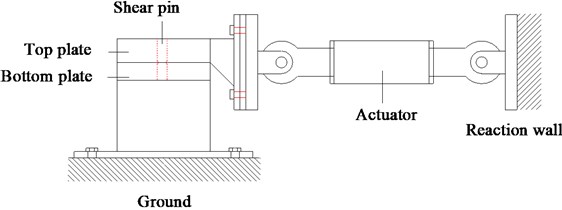
a) Schematic diagram of the test setup
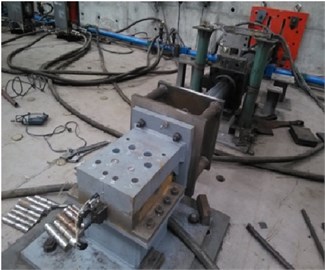
b) Photo of the test setup
Fig. 2A shear pin in the test
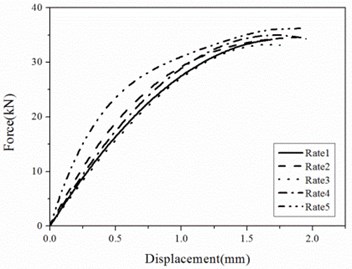
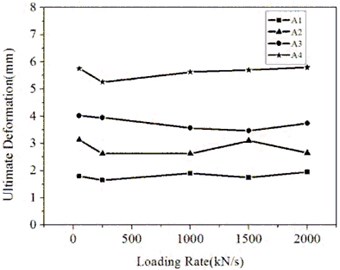
The maximum shear force during a test is defined as the load capacity and represented by . The deformation corresponding to the load capacity is defined as ultimate deformation and represented by . Relations of shear forces to shear deformations for different shear pins are shown in Fig. 3. Relations of load capacities and ultimate deformations to loading rates are shown in Figs. 4 and 5. The following observations can be made:
(1) Since the increase of the loading rate leads to insufficient development of cracks, there is a little increase of load capacity when the loading rate increases from Rate 1 to Rate 2. However, the incremental value of load capacities are less than 5 percent and load capacities are almost the same for the loading rate greater than Rate 2. So, the influence of the loading rate on the load capacity can be neglected for simplicity.
(2) There are some fluctuations of the ultimate deformation along with the increase of the loading rate because of the variances of manufacturing and material, but the difference is less than 5 percent.
(3) The relation of the force to the deformation is not linear and the stiffness decreases with the increase of the displacement.
Fig. 3Relations of shear forces to shear deformations
a) A1
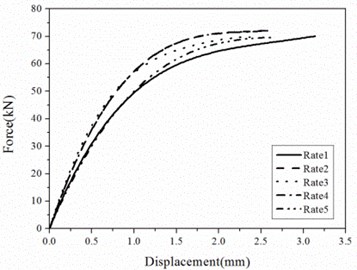
b) A2
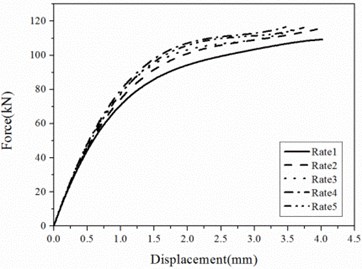
c) A3
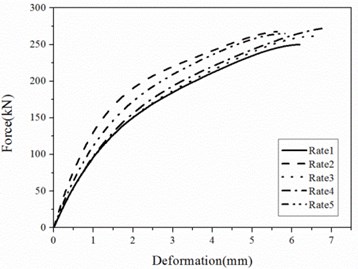
d) A4
Fig. 4Relations of load capacities to loading rates
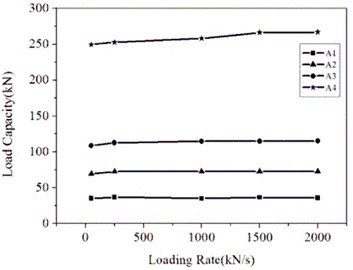
Fig. 5Relations of ultimate deformations to loading rates
3. The equivalent linear model
Although the relation of the force to the deformation is nonlinear, an equivalent linear model of shear pins can be established for simplicity. The model is determined by the origin and the fracture point. Three parameters are included in the model: the ultimate deformation, the load capacity and the equivalent stiffness which is defined as the ratio of to . Relations of to and to are shown in Fig. 6.
As shown, relations of to and to are almost linear. Empirical formulae for (mm), (kN), (kN/mm) and (mm) are fitted by the least squares method and can be described as:
It should be noted that the equations above were only applicable for the material investigated. For other materials, different models may be derived.
Fig. 6Parameters of the linear model
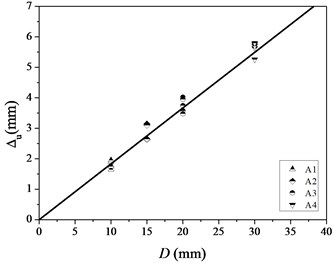
a) The ultimate deformation
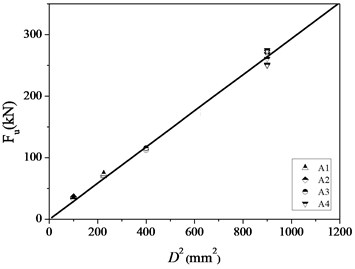
b) The load capacity
4. Shaking table tests
A series of shaking table tests were conducted in the Multifunctional Shake Tables Laboratory, Tongji University to verify the equivalent linear model for shear pin fractures. Two shaking tables, named Table B and C, were used to simulate ground motions. The performance specifications of the two shake tables are listed in Table 1. Test setup is shown in Fig. 7 and a simply supported bridge was used as the test specimen and consists of two piers, four bearings and a girder with an additional mass of 100 tons. The two piers were installed on Table B and C respectively. Piers were fixed on the table, and two same bearings were placed on each pier. The two bearings on Table B were double spherical seismic isolation bearings (DSSI bearings) with shear pins and the two on Table C were common DSSI bearings without shear pins. The DSSI bearing was developed by substituting the flat sliding surface of an ordinary spherical sliding bearing with a modified spherical sliding surface. Its working mechanism in earthquakes was similar to a Friction Pendulum Sliding bearing. Therefore, the pier on Table B was used as the fixed pier and the bearings on Table B were used as fixed bearings. The girder was supported on the four bearings and the additional masses are bolted on it.
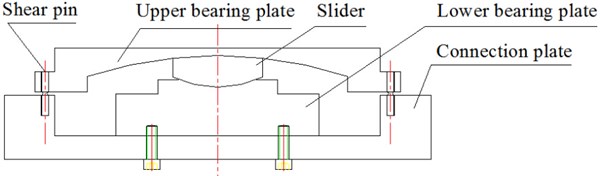
The material of shear pins used in shaking table tests was the same as that in shear fracture tests and 5 mm for all the shear pins. The shear pins were installed between the upper and lower bearing plates of fixed bearings as shown in Fig. 8. As shown, a DSSI bearing without shear pins was composed of upper and lower bearing plates and a slider. For a DSSI bearing with shear pins, a connection plate was mounted under the lower bearing plate and four shear pins were installed to restrict the horizontal displacement between the upper bearing plate and the connection plate. So DSSI bearings with shear pins were used as fixed bearings.
The seismic wave recorded in the 1940 El Centro earthquake was selected in the tests. Three shaking table test cases were arranged with peak accelerations varying from 0.20 g, 0.25 g and 0.30 g, which were numbered as Case 1 to Case 3 in the paper.
Responses of the bridge model were measured by 33 transducers collecting data from the bridge model with a sampling frequency of 512 Hz. Bearing displacements were measured by 8 displacement transducers, bearing forces were measured by 4 load transducers and accelerations of the tables, decks and piers were measured by 21 accelerometers.
Table 1The performance specifications
Item | Table B and C |
Table size | 6 m×4 m |
Payload | 70 ton |
Degree of freedom in control | 3 dof (longitudinal, lateral, yaw) |
Stroke | ±500 mm ( axis, axis) |
Velocity | ±1000 mm/s ( axis, axis) |
Acceleration | ±1.5 g ( axis, axis) |
Fig. 7Test setup and specimen
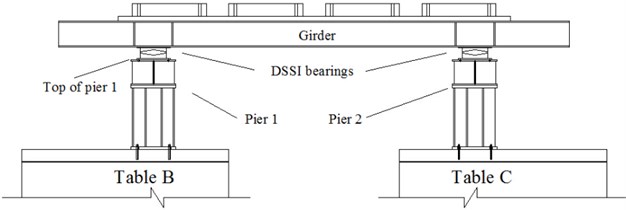
a) Schematic diagram of the test setup and specimen
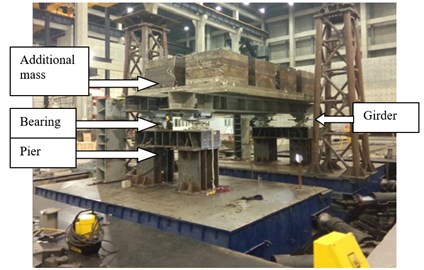
b) Photo of the test setup and specimen
Fig. 8A DSSI bearing with shear pins used as a fixed bearing
In Fig. 9, time histories of accelerations at the top of pier 1 and at Table B in Case 1 are shown. In these figures, solid lines represent those at the top of pier 1 and broken lines represent those at Table B. As shown, a whole time history can be divided into three phases. Phase I is before the shearing off of shear pins, phase II is a transitional period after shearing off of shear pins and phase III is after the disappearing of effects of shear pin fractures.
As shown, in phase I the girder and pier are connected by shear pins, so the accelerations at the top of pier 1 and Table B have the same vibration frequency. Acceleration amplitudes at the top of pier 1 are larger than those at Table B.
In phase II, shear pins are sheared off and the fixed connection between the girder and piers disappear suddenly, so acceleration amplitudes at the top of pier 1 increase quickly and suddenly. The motion at the top of pier 1 is a combination of the free vibration of the pier and the ground motion. The free vibration of the pier will be damped after several cycles in less than one second.
In phase III, the girder and piers are connected by DSSI bearings, so the relative horizontal displacement between the girder and the pier is much larger than the other two phases. Accelerations at the top of pier 1 and Table B have the same vibration frequency and approximate amplitudes.
Load capacities of shear pins measured in the Cases are listed in Table 2. The average load capacity of a single shear pin is 7.30 kN. The load capacity estimated with Eq. (2) is 7.34 kN, and the difference is less than 1 %.
Fig. 9Acceleration time histories at the top of pier 1 and at Table B in Case 2
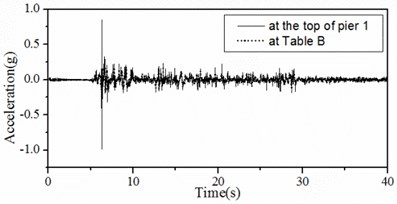
a) The whole time history
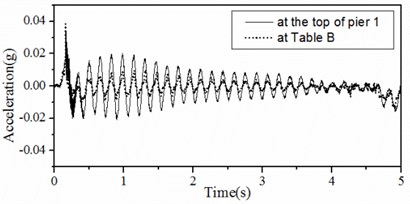
b) Phase I
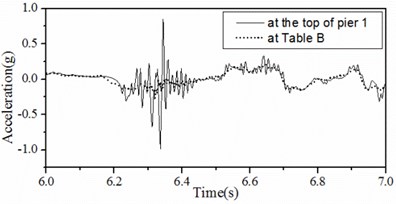
c) Phase II
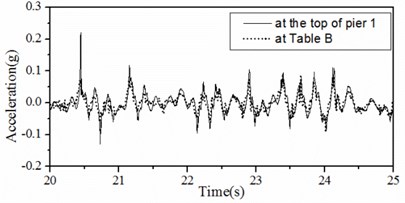
d) Phase III
Table 2Load capacities measured in the Cases
Cases | Max horizontal force of the fixed bearings (kN) | Load capacity of all the shear pins (kN) | Load capacity of a single shear pin (kN) |
1 | 45.84 | 29.50 | 7.38 |
2 | 44.19 | 28.80 | 7.20 |
3 | 43.73 | 29.25 | 7.31 |
Average | – | – | 7.30 |
5. Verification of the equivalent linear model
The finite element software ANSYS is used to establish the numerical model of the shaking table test model. The parameters of the linear model for shear pin fractures can be calculated with Eqs. (1)-(3) and are listed in Table 3. The parameters are calculated for four shear pins. The parameters of DSSI bearings are obtained from the test results.
The main girder, crossbeams and columns are simulated by the Beam 189 element of ANSYS. Beam 189 is based on Timoshenko beam theory and shear deformation effects are included. The element is a quadratic beam element and has six degrees of freedom at each node, including translations in the , , and directions and rotations about the three axes. The actual material, section areas and area moments of inertia of all the components are simulated in the model. The additional masses are simulated by four mass points.
A shear pin can be simulated by a Combin 40 element. A complete Combin 40 element has six parameters, including , C, M, GAP, FSLIDE and . For shear pins, only and FSLIDE are used. is the equivalent shear stiffness and equals . FSLIDE is the load capacity and equals . The hysteresis curve of a shear pin is shown in Fig. 11.
An ordinary DSSI bearing without shear pins can be simulated by a Combin40 element too. For a DSSI bearing, , and FSLIDE are used. is the Pre-sliding stiffness and equals . is the Post-sliding stiffness and equals . FSLIDE is the maximum static friction force and equals . The hysteresis curve of a DSSI bearing is shown in Fig. 12.
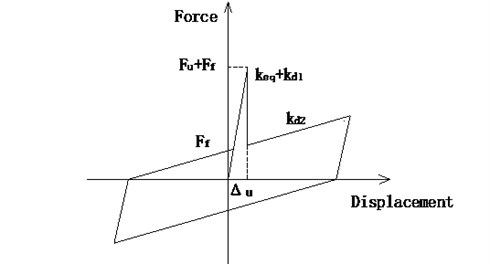
The model of a DSSI bearing with shear pins can be combined with models of shear pins and an ordinary DSSI bearing. The hysteresis curve of a DSSI bearing with shear pins is shown in Fig. 13.
Fig. 11Hysteresis relation of a shear pin
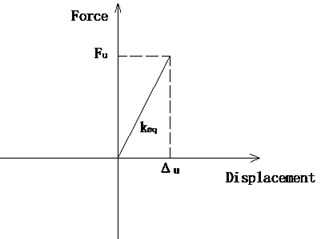
Fig. 12Hysteresis relation of a DSSI bearing without shear pins
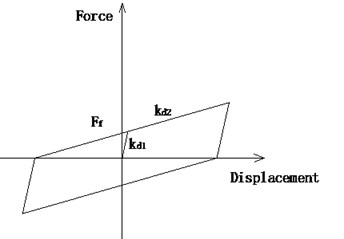
Fig. 13Hysteresis relation of a DSSI bearing with shear pins
The shaking table test and numerical results of all the three cases are compared. The displacement histories, force histories and hysteresis curves of fixed DSSI bearings of Case 2 are shown in Fig. 14. As shown, the numerical results match shaking table test results very well. The maximum bearing displacements and forces of all the three cases are calculated and listed in Table 4. The maximum error is less than 20 %. So the equivalent linear model for shear pin fractures is verified.
It should be noted that the diameter of the central section of each shear pin is 5mm in the test. As shown in Fig. 3, the relation of the force to the deformation is nonlinear and the degree of nonlinearity gets higher along with the diameter. For 10 mm, the equivalent linear model is very accurate. For 10 mm, a more complex model, such as a bilinear model, may be more appropriate.
Fig. 14Comparisons of test and numerical results of Case 2
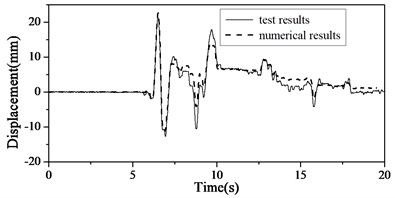
a) Displacement of bearing
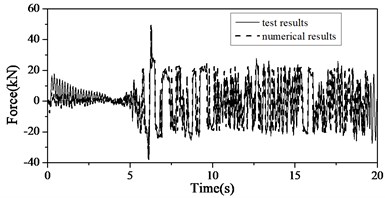
b) Force of bearing
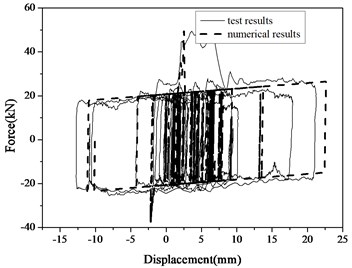
c) Hysteresis curve
Table 3Parameters of the numerical model
Components | Elements | Parameters | Value |
Shear pins | Combin 40 | (kN/m) | 32052 |
(kN) | 29.36 | ||
DSSI bearings | Combin 40 | (kN/m) | 2.996×10⁴ |
(kN/m) | 277.67 | ||
(kN) | 19.71 |
Table 4Comparisons of maximum bearing displacements and forces
Cases | Test results | Numerical results | ||
Maximum bearing displacements (mm) | Maximum bearing forces (kN) | Maximum bearing displacements (mm) | Maximum bearing forces (kN) | |
1 | 14.3 | 50.7 | 16.7 | 48.0 |
2 | 21.3 | 49.4 | 22.7 | 49.5 |
3 | 35.9 | 46.7 | 37.2 | 45.5 |
6. Conclusions
Shear fracture tests of shear pins were performed firstly to achieve an equivalent linear model for shear pin fractures. Then the numerical results with the linear model were compared with shaking table test results. The following conclusions were drawn from the investigations.
(1) The influence of the loading rate on the load capacity and ultimate deformation can be neglected.
(2) Ultimate deformation and equivalent stiffness are approximately proportional to the diameter of the shear pin. Load capacity is approximately proportional to the square of the diameter of the shear pin.
(3) The shearing fracture condition of shear pins can be controlled by the shear deformation and the relation of was achieved from the test.
(4) The equivalent linear model can simulate the effects of shear pin fractures accurately enough in bridge seismic isolation designs.
References
-
Avşar Ö., Özdemir G. Response of seismic isolated bridges in relation to intensity measures of ordinary and pulse-like ground motions. Journal of Bridge Engineering, Vol. 18, Issue 3, 2013, p. 250-260.
-
Ismail M., Rodellar J., Ikhouane F. An innovative isolation device for aseismic design. Engineering Structures, Vol. 32, Issue 4, 2010, p. 1168-1183.
-
Wang Y., Chung L., Liao W. Seismic response analysis of bridges isolated with friction pendulum bearings. Earthquake Engineering and Structural Dynamics, Vol. 27, Issue 10, 1998, p. 1069-1093.
-
Peng T., Li J., Fan L. Study on the seismic performance of a double spherical seismic isolation bearing. Earthquake Engineering and Engineering Vibration, Vol. 7, Issue 4, 2008, p. 439-446.
-
Yuan W., Wang B., et al. Seismic performance of cable-sliding friction bearing system for isolated bridges. Earthquake Engineering and Engineering Vibration, Vol. 11, Issue 2, 2012, p. 173-183.
-
Filipov E., Revell J., et al. Seismic performance of highway bridges with fusing bearing components for quasi-isolation. Earthquake Engineering and Structural Dynamics, Vol. 42, Issue 9, 2013, p. 1375-1394.
-
Steelman J., Filipov E., et al. Experimental behavior of steel fixed bearings and implications for seismic bridge response. Journal of Bridge Engineering, Vol. 19, Issue 8, 2014, p. 1-14.
-
Xia X., Cheng X., Wang X. Effect of shear key on seismic response of bridge using isolation bearing. Journal of Earthquake Engineering and Engineering Vibration, Vol. 32, Issue 6, 2012, p. 104-109, (in Chinese).
-
Levi M., Sanders D., Buckle I. Seismic response of columns in horizontally curved bridges. 15th WCEE, Lisbon, Portugal, 2012.
-
Wieser J., Maragakis E., Buckle I. Experimental evaluation of seismic performance of seat-type abutments in a curved highway bridge. 10th U.S. National Conference on Earthquake Engineering, Alaska, U.S., 2014.
Cited by
About this article

This work was supported in part by the National Natural Science Foundation of China (No. 51278372) and the Ministry of Science and Technology of China, Grant No. SLDRCE 14-B-15.
