Abstract
Aimed at the problem that the ultrasonic testing is applied in defect of LY12 aluminum alloy by using liquid or semi-solid coupling agent, transfer matrix method and gas-solid boundary conditions of ultrasonic wave propagation is used for establishing mathematic model in LY12 aluminum alloy, and this model is solved to obtain the propagation characteristic curve. When cut-off frequency is less than 2 MHz·mm, it has only modal. The simulation result provides proper parameters for ultrasonic testing, in which the incidence angle is 30° and the center frequency is 1 MHz. The different circuit defect for LY12 aluminum alloy is made and detected, and time domain waveform is obtained. The experimental results show that the diameter of the defects has a little influence on the amplitude of the direct wave, defect wave amplitude decreases gradually with the increase of the defect diameter.
1. Introduction
Due to the strict requirements of aviation and aerospace, precision machinery, defense technology and other fields on the weight, cost and reliability of manufacturing materials, LY12 aluminum alloy featured with high strength, wear resistance and high chemical stability becomes key material which replaces steel [1-4]. As one of widely used alloy materials in the industry, LY12 aluminum alloy has high strength and toughness, and it is not easy to break. As the most consumable aluminum alloy material among aluminum alloys, LY12 aluminum alloy is usually used to make planes, the skin of rockets, sidings, bulkheads and ribs [5, 6]. Due to the complicated working environment in the process of the actual application, the generation of defects of aluminum alloy leads to the decrease of its strength and performance in the application process. These changes have a direct influence on the security and reliability of aluminum alloy and create a great threat to the safe service of key components of planes [7, 8]. Therefore, research on the non-destructive testing technology of LY12 aluminum alloy is very important.
Currently, a number of methods are used for the non-destructive testing and evaluation of material defects, but ultrasonic testing technology is one of the most effective and safest methods [9]. Currently, this technology is widely used to detect defects. Traditional ultrasonic testing usually uses longitudinal ultrasonic method, transverse wave ultrasonic method, phased array ultrasonic testing method and so on [10]. Featured with long propagation distance and fast detection speed, Lamb wave has a good application prospect in detecting the defect of LY12 aluminum alloy [11, 12]. However, Lamb wave has very complicated transmission mechanism in LY12 aluminum alloy material and fails to clearly show the rule of interacting with defects [13]. As a result, it is quite necessary to learn about the frequency dispersion curve, phase velocity curve and group velocity curve in LY12 aluminum alloy material and select appropriate modes to detect defects. This paper adopted the dichotomy method to draw the relationship between the propagation dispersion characteristics of Lamb wave in LY12 aluminum alloy material and the incident angle and frequency of acoustic wave of various modes, obtained the optimal ancient angle and corresponding frequency of stimulating acoustic wave of various modes, finally established ultrasonic testing methods, obtained time domain waveforms in the case of circular defect and zero defect with the diameter of 1 mm, 2 mm,…, and 10mm, and analyzed the sensibility of acoustic wave to the circular defect with different diameters.
2. Mathematical model for the frequency dispersion characteristic of acoustic wave in the propagation of single layer plate
This paper took LY12 aluminum alloy as the simulation and experiment material, adopted the dichotomy method to draw the frequency dispersion curve of acoustic wave in single layer plate, gave the range of modal and frequency-thickness product selected for defects of ultrasonic testing and provided a theoretical basis for practically detecting the defects of layered medium materials.
2.1. Basic theories of frequency dispersion characteristic of acoustic wave
Acoustic wave constantly transformed the waveform in the free surface of thin layer through reflection. In the propagation process of LY12 aluminum alloy, acoustic waves interfered with each other and generated multiple modes, like symmetric modes including , , , …, and anti-symmetric modes including , , ,…. Moreover, the main basis of applying acoustic wave to the non-destructive testing of materials was its frequency dispersion characteristic in the propagation process. Therefore, the mathematical model for the propagation of acoustic wave in isotropic aluminum alloy was established.
Fig. 1Schematic diagram for the cross section of single layer thin plate

According to the reference [13], the wave equation of describing symmetric Lamb wave was characteristic equation which was expressed as follows:
where in, and , was half of thickness of aluminum plate and stood for wave number. According to Eq. (1), wave velocity of acoustic wave of symmetric mode was the function of frequency-thickness product. The equation had countless solutions, including , , ,…. Namely, the particle did symmetric motion, relative to the middle layer.
The characteristic equation for acoustic wave of anti-symmetric mode was:
Eq. (2) also reflected that wave velocity of acoustic wave of anti-symmetric mode was the function of frequency-thickness product. The equation had countless solutions, including , , ,…. Namely, the particle did anti-symmetric motion, relative to the middle layer.
2.2. Propagation velocity of acoustic wave
The phase velocity and group velocity curves of acoustic wave in single layer thin plate are two main parameters of studying frequency dispersion characteristic. Phase velocity refers to the propagation distance of same-phase points in unit time and group velocity refers to points with certain properties on the envelop of wave and the traveling velocity of points with similar frequencies. According to the reference [14], the relationship between phase velocity and frequency-thickness product used to compute acoustic wave was as follows.
Symmetric mode:
Anti-symmetric mode:
Equations of the relationship between group velocity and frequency-thickness product:
where in, was frequency-thickness product; stood for longitudinal wave velocity; referred to transverse wave velocity; was phase velocity; represented group velocity.
2.3. Numerical solution of frequency dispersion equation
Through experiments, longitudinal wave velocity and transverse wave velocity of LY12 aluminum alloy were 6320 m/s and 3080 m/s, respectively. Other acoustic parameters were shown in Table 1 specifically.
Table 1Acoustic parameters of LY12 aluminum alloy and air[7]
Material | Density / (kg/m3) | Velocity of P-Wave / (m/s) | Velocity of S-Wave / (m/s) | Impendence / MRayl |
Aluminum | 2700 | 6320 | 3080 | 17 |
Air | 1.29 | 340 | – | 0.0042 |
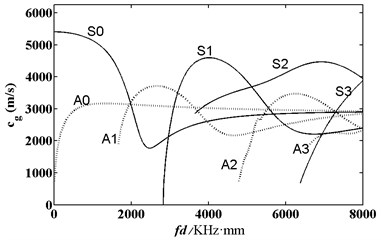
As shown in Eqs. (3), (4) and (5), the frequency dispersion equation of acoustic wave in LY12 aluminum alloy was transcendental equation. The relationship between frequency-thickness product and velocity was obtained through numerical solution. As shown in Fig. 2 and Fig. 3, any frequency-thickness product certainly had two or more kinds of modes. Group velocities of some modes were very approximate at the same frequency-thickness product. Acoustic wave might transform into other modes close to group velocity in the process of propagation. Therefore, it was necessary to try to avoid using frequency-thickness product which would encounter mode transformation easily as the test parameter of defect detection. Except for and modes, other modes had a cut-off frequency. Lowering excitation frequency to a certain range could help motivation modes to reduce modes with high energy, difficult mode transformation and good state of energy distribution.
Fig. 2Frequency dispersion curve of phase velocity of acoustic wave in aluminum plate
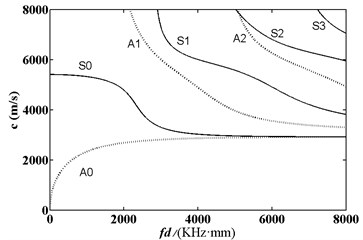
Fig. 3Frequency dispersion curve of group velocity of acoustic wave in aluminum plate
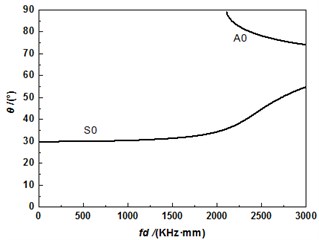
According to formula ( was incident angle; stood for longitudinal wave velocity; represented phase velocity), the relationship between incident angle and frequency-thickness product of acoustic wave of various modes could be obtained and shown in Fig. 4. Fig. 4 listed the relationship between incident angle and frequency of two kinds of modes including and in aluminum plate respectively. From the figure, it could be found that only mode existed when frequency-thickness product was less than 2000 KHz·mm and mode would be generated when frequency-thickness product was more than 2000 KHz·mm. In addition, acoustic wave of mode was excited more easily, with a large out-of-plane displacement in the propagation of single layer plate. Thus, mode was used to detect different diameter defects of aluminum plate. As shown in Fig. 4, the corresponding incident angle was 30° in the case of exciting mode when frequency-thickness product was 1000 KHz·mm. This group of parameters could be taken as appropriate parameters of air-coupled ultrasonic testing.
Fig. 4Relationship between frequency-thickness product and incident angle
3. Experimental research on ultrasonic testing
3.1. Experimental equipment
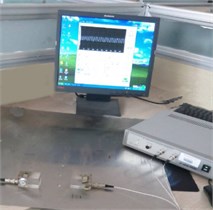
Fig. 5 presented the system and composition of contact-type ultrasonic testing of aluminum materials. The system was composed of computer, receiver card with ultra-high power and ultrasonic excitation, variable-angle ultrasonic transducer and pre-amplifier. Receiver card of ultrasonic emission was produced by Japan Probe. The model was JPR-10CN; collection frequency was 10 MHz; emission voltage of transducer in the experiment was 600 V; received signal amplified 6.8 dB. Variable-angle ultrasonic transducer was produced by SIUI. Its center frequency was 1 MHz.
Fig. 5System diagrams of ultrasonic testing experiments
a) Object diagram
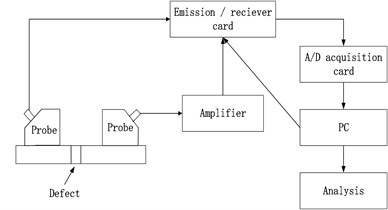
b) Schematic diagram
3.2. Experimental material
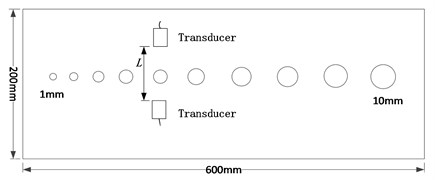
Fig. 6 showed the distribution of prefabricated defects of experimental aluminum plate. 10 circular holes were respectively processed on the aluminum plate with the size of 600 mm*, 200 mm*, 1 mm*, 600 mm*, 200 mm*, 2 mm. Diameters of 10 circular holes were 1 mm, 2 mm, …, 10 mm in sequence. Ultrasonic emission and receiving transducer were set on either side of defect of circular holes. Distances were 80 mm and 100 mm respectively.
Fig. 6Distribution diagram for the defect of experimental material
3.3. Selection of guided wave modes in layer medium
Analysis on the frequency dispersion curve of phase velocity and group velocity in Fig. 2 and Fig. 3 could be used to select frequency and incident angle. Longitudinal wave velocity and transverse wave velocity of aluminum plate were 6320 m/s and 3080 m/s respectively. When frequency-thickness product was more than 2000 KHz.mm, there were 4 modes at least, including , , and . At this time, multi-mode acoustic signals overlapped, which increased the difficulty of signal analysis. On the contrary, only mode and mode could be excited when frequency-thick kness product was less than 2000 KHz∙mm, reducing signal superposition caused by frequency dispersion. As mode could be excited by the inclined wedge of organic glass easily under the condition of low frequency-thickness product in single layer plate, the angle of variable-angle ultrasonic transducer was set at 30° to excite mode.
3.4. Analysis and research on the experimental result of guided wave
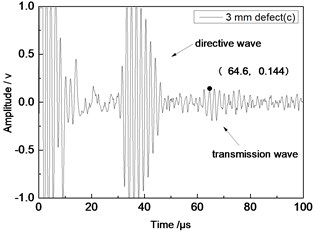
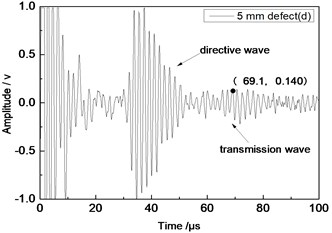
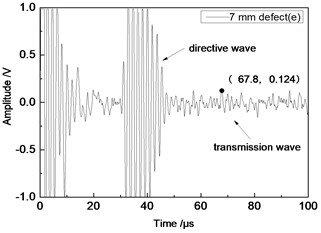
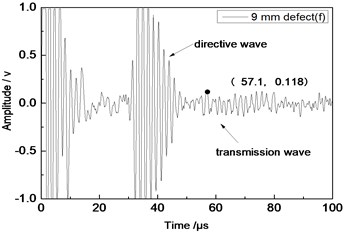
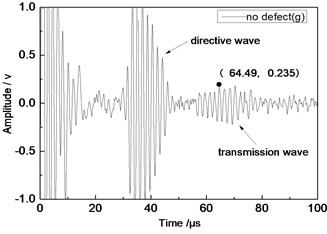
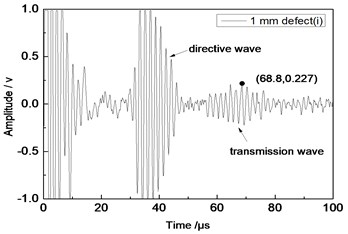
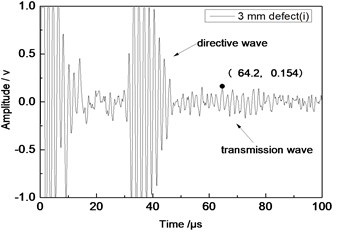
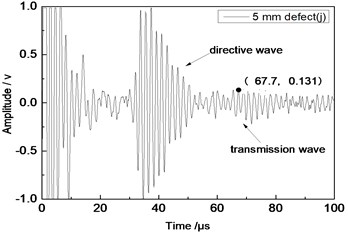
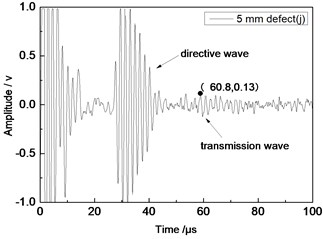
Center frequency of the ultrasonic transducer was 1 MHz; distance was 80 mm; thicknesses of the aluminum plates were 1 mm and 2 mm respectively. Time domain waveforms were obtained respectively at circular defects with diameters of 1 mm, 2 mm, …, 10 mm as well as the non-defect. Due to the limitation of the length of this paper, Fig. 7(a) to Fig. 7(f) showed time domain waveforms at the non-defect as well as the defects with diameters of 1 mm, 3 mm, 5 mm, 7 mm and 9 mm respectively in 1 mm aluminum plate. Fig. 8(a) to Fig. 8(f) showed time domain waveforms at the non-defect as well as the defects with diameters of 1 mm, 3 mm, 5 mm, 7 mm and 9 mm respectively in 2 mm aluminum plate. As shown in the figure, received signals contained the signal of directive wave in plate which directly passed through aluminum plate and reached the receiving probe and the signal of transmission wave which was propagated to the receiving probe after interaction between acoustic wave and defects. In addition, different diameter defects had different amplitudes of directive wave and transmission wave in plate. On the whole, directive wave and transmission wave in plate gradually decreased with the increase of defects.
Fig. 7Time domain waveforms of different defects when the thickness was 1 mm and distance was 80 mm
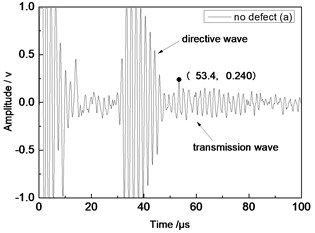
a) No defect
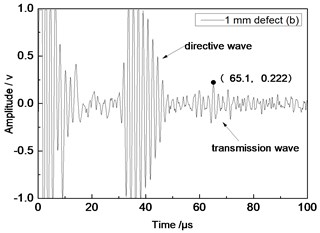
b) 1 mm defect
c) 3 mm defect
d) 5 mm defect
e) 7 mm defect
f) 9 mm defect
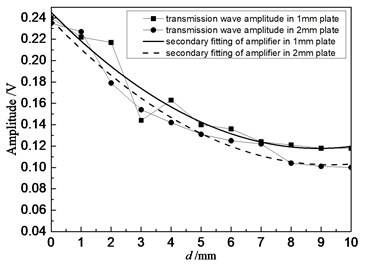
Fig. 9 showed the relationship between the amplitude of directive wave and transmission wave in plate and defect diameter when the distance of 1.0 MHz transducer was 80 mm. Specifically, the fine solid line and square blocks represented relations between defects in 1 mm plate and the transmission wave, as well as their secondary fitting respectively; the fine dotted line and circle centers represented relations between defects in 2 mm plate and the transmission wave, as well as their secondary fitting, respectively. As shown in the figure, the amplitude of transmission wave gradually decreased with the increase of defect diameter. It was because defects caused more energy loss of passed transmission wave with the increase of defect diameter. Therefore, the diameter of defects could be evaluated according to the amplitude of transmission wave. Experimental results had a small error, and differences were in experimental values due to human factors of equipment, ultrasonic testing equipment, as well as many uncertainties in experimental process, etc. However, as a whole, amplitudes of the defect wave and the transmission wave gradually decreased with the increase of the defects.
Fig. 8Time domain waveforms of different defects when the thickness was 2 mm and distance was 80 mm
a) No defect
b) 1 mm defect
c) 3 mm defect
d) 5 mm defect
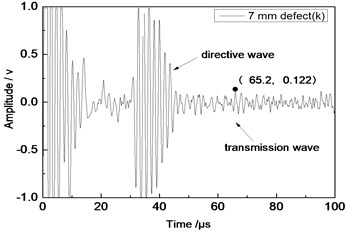
e) 7 mm defect
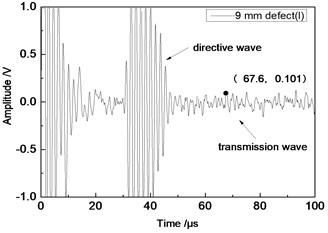
f) 9 mm defect
Fig. 9Relationship between the amplitude of transmission wave and defect diameter when the distance was 80 mm
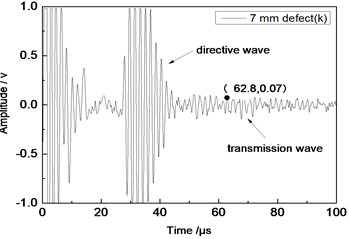
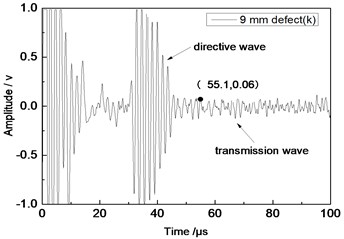
Center frequency of the ultrasonic transducer was 1 MHz; distance was 100 mm; thicknesses of the aluminum plates were 1 mm and 2 mm respectively. Time domain waveforms were obtained respectively at circular defects with diameters of 1 mm, 2 mm,…, 10 mm as well as the non-defect. Similarly, Fig. 10(a) to Fig. 10(f) showed time domain waveforms at the non-defect as well as the defects with diameters of 1 mm, 3 mm, 5 mm, 7 mm and 9 mm respectively in 1 mm aluminum plate. Fig. 11(a) to Fig. 11(f) showed time domain waveforms at the non-defect as well as the defects with diameters of 1 mm, 3 mm, 5 mm, 7 mm and 9 mm respectively in 2 mm aluminum plate. As shown in the figure, there were signals of directive wave, acoustic wave and transmission wave in plate in received signals. In addition, the amplitudes of directive wave and transmission wave in plate were different for different diameter defects. On the whole, directive wave and transmission wave in plate gradually decreased with the increase of defect. Compared with transducer with the distance 80 mm, the amplitudes of directive wave and transmission wave in plate were relatively smaller because the propagation distance of acoustic wave was larger and more acoustic energy consumed and decreased in the process of propagation.
Fig. 10Time domain waveforms of different defects when the thickness was 1 mm and distance was 100 mm
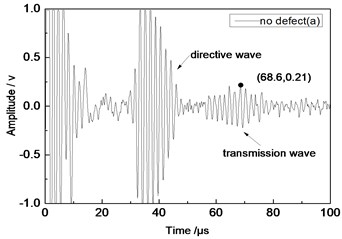
a) No defect
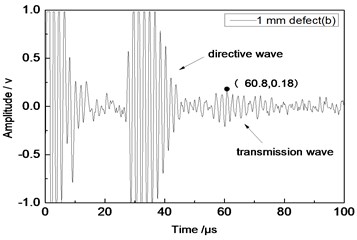
b) 1 mm defect
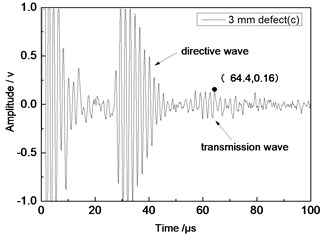
c) 3 mm defect
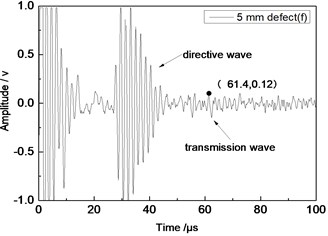
d) 5 mm defect
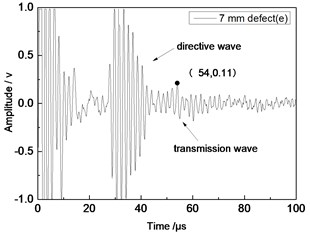
e) 7 mm defect
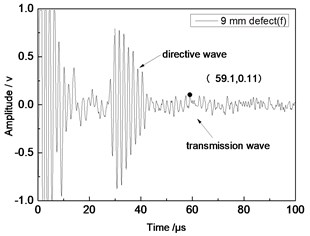
f) 9 mm defect
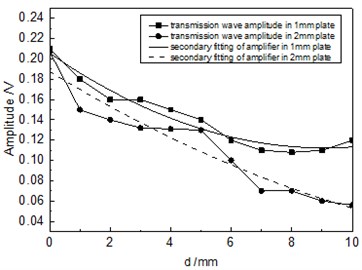
Fig. 12 showed the relationship between the amplitude of acoustic wave and defect diameter when the distance of 1.0 MHz transducer was 100 mm. Specifically, the fine solid line and square blocks represented relations between defects in 1 mm plate and the transmission wave, as well as their secondary fitting respectively; the fine dotted line and circle centers represented relations between defects in 2 mm plate and the transmission wave, as well as their secondary fitting, respectively. As shown in the figure, the amplitude of transmission wave gradually decreased with the increase of defect diameter,the amplitude decreased quickly when the defect diameter was small, and the amplitude decreased gently when the defect diameter was big. The amplitude of defect wave would be steady when the diameter was greater than 7 mm.
Fig. 11Time domain waveforms of different defects when the thickness was 2 mm and distance was 100 mm
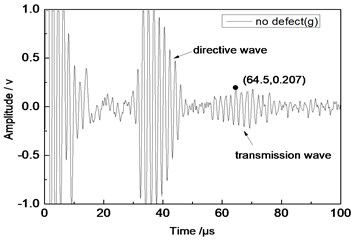
a) No defect
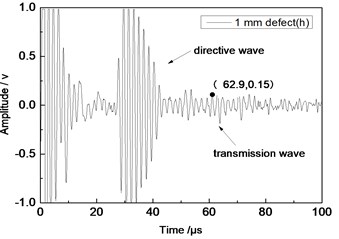
b) 1 mm defect
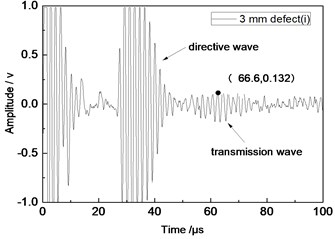
c) 3 mm defect
d) 5 mm defect
e) 7 mm defect
f) 9 mm defect
From Fig. 7 to Fig. 12, the appropriate incident angle of acoustic wave could be selected based on theory to excite acoustic wave of single mode. However, received echo signals still presented the phenomenon of frequency dispersion and acoustic wave of other modes were generated due to the wide frequency band of the probe in practical testing. When the distance of ultrasonic transducer increased from 80 mm to 100 mm, received signals moved to the right at the horizontal axis of time. Therefore, the group velocity of signals could be computed according to equation and the corresponding modal of signals could be inferred according to group velocity curve.
Fig. 12Relationship between the amplitude of transmission wave and defect diameter when the distance was 100 mm
4. Conclusions
1) Time domain waveforms were obtained at the circular defect with the diameter of 1 mm, 2 mm, …, 10 mm when the distance of ultrasonic transducer was 80 mm or 100 mm. It’s received signals contained the signals of directive wave and transmission wave in plate. In addition, the amplitudes of directive wave and transmission wave in plate were different for different diameter defects. From the relationship between the amplitude of acoustic wave and defect diameter, it could be seen that defect diameter had a little influence on the amplitude of directive wave in plate and the amplitude of transmission wave gradually decreased with the increase of defect diameter.
2) Ultrasonic wave excited single mode from a certain incident angle. In the practical testing, it was found that received echo signals would show the phenomenon of frequency dispersion. When the distance of ultrasonic transducer increased from 80 mm to 100 mm, received signals moved to the right at the horizontal axis of time. The group velocity of signals could be calculated according to equation ( was the distance difference between transducers and stood for the time difference of corresponding back wave at the horizontal axis) and the modal of signals could be inferred according to group velocity curve. In the meanwhile, it could be noticed that the amplitude of time domain waveforms was larger in the case of no defect no matter how much the distance of transducer changed. Corresponding amplitude gradually decreased with the increase of defect diameter of circular hole.
References
-
Gao G. L., Li D. Y., Dong J. W., et al. Identifying cracks in Ly12 aluminum alloy plates based on nonlinear time reversal acoustics. Journal of Harbin Engineering University, Vol. 31, Issue 3, 2010, p. 395-399.
-
Yang D. M., Pan J., Zhuo Y., et al. Preparation and structural stiffness of hybrid sic reinforced aluminum composite hatch cover plate. Journal of Astronautics, Vol. 1, 1999, p. 99-103.
-
Huang G. G., Zhang Z. J., Wang Y. L., et al. Microstructure and mechanical properties of domestic Ly12 and foreign 2024 aluminum alloy. Transactions of Materials and Heat Treatment, Vol. 35, Issue 1, 2014, p. 160-165.
-
Yan B. S., Zhang S. X. Using nonlinear ultrasonic test for fatigue damage of Ly12 aluminum alloy. Journal of Aeronautical Materials, Vol. 32, Issue 2, 2012, p. 93-98.
-
Li Z. Research on in-Situ Ultrasonic Non-Destructive Test Used for Common Structures of Aircraft. National University of Defense Technology, 2010.
-
Li L. Research on the Crack Defects Detection Algorithm of Aircraft Skin. Northeast Dianli University, 2010.
-
Lin C., Cai J., Zeng F. G., et al. Chemical milling technology and influence factors of processing quality of Ly12 aluminum alloy failure analysis and prevention. Failure Analysis and Prevention, Vol. 1, 2010, p. 8-12.
-
Zeng W., Wang H. T., Tian G. Y., et al. Research on laser ultrasonic defect signal detection technology based on energy analysis. Chinese Journal of Scientific Instrument, Vol. 35, Issue 3, 2014, p. 650-655.
-
Xu X. D. Application Study of Ultrasonic Nondestructive Testing Technique in Bridge Health Condition Assessment. Jilin University, 2008, p. 56-60.
-
Sun C. M. Calculation and analysis of ultrasonic transverse wave testing with angle probe by finite element method. Piezoelectrics and Acoustooptics, Vol. 36, Issue 5, 2014, p. 1019-1021.
-
Wang X. G., Chang J. J., Shan Y. C., et al. Measurement of attenuation of ultrasonic propagating through the thin layer media with time delay spectrum. Chinese Journal of Mechanical Engineering, Vol. 23, Issue 1, 2010, p. 129-134.
-
Dong Z. H., Wang Y. Q., Li J. Application and research on air-coupled ultrasonic testing for aerospace composite materials. Journal of the Academy of Equipment Command and Technology, Vol. 2, 2007, p. 79-84.
-
Wu B., Cui C. Y., Zhang Y. C., et al. Propagation characteristics of lamb wave and affected factors in butt welds. Journal of Basic Science and Engineering, Vol. 22, Issue 4, 2014, p. 818-829.
-
Wu Nanxing, Chen Zhenglin, Liao Dahai Based on the lamb wave research for propagation characteristics in the silicon nitride ceramic blade and its friction material coating. Journal of Ceramics, Vol. 36, Issue 1, 2015, p. 1-3.
