Abstract
The cross section of circular cylinder in their dynamic model is always considered as a perfect circle, which means radii at every point on the circle are the same. In real engineering structure, there are slight fluctuations in shape of the circular cylinder which is different from those in ideal model. Meanwhile, effects of structural fluctuations on its dynamic characteristic are rarely analyzed before. To study problem mentioned above, the geometric shape of a typical, apparently symmetrical cylinder is examined experimentally to demonstrate that a small variation in diameter and thickness indeed exists in practice firstly. Because fluctuations in diameter and thickness of the cylinder are related to each other, we need to separate effects of a slight variation in its diameter and thickness on structural dynamic characteristics to search the key factor of influence. Then, two simplified modes, which are modeled by finite element method, are used to study the effects of diameter or thickness variation alone on the natural frequencies and modal shapes of the free cylinder. It is revealed that the diameter variation described by the simplified model captures the key influencing elements which affect the modal characteristics of the free cylinder. Finally, a free cylinder with both variations is analyzed numerically and the results are verified experimentally. This work illustrates that significant discrepancies inevitably exist between the measured results of an actual free cylinder and an assumed symmetrical model even if there is only a very slight variation in its geometric shape.
1. Introduction
The vibration characteristics of many symmetrical structures, such as circular cylinders [1, 2] and box-like structures [3], are well studied. In reality, however slight variations in shape, material properties or boundary conditions always exist in these “seemingly” symmetrical structures [4] and they are usually ignored during modeling process of the structural vibration without adequate justification.
In this paper, the diameter and thickness variations in a circular cylinder are examined together with their effects on the vibration characteristics of the cylinder. Although the effects of cross-sectional variation and thickness variation on the natural frequencies of the structure have been studied by several authors [5-11] rare work was found concerning the effects of the variation in both the tangential and axial directions of the cylinder (which happened to be the case in the selected cylinder) on the free natural frequencies and mode shapes. Since, mode shapes are important for estimating structural vibration at individual points and sound radiation efficiency of the mode. The focus of this study is to examine the extent and sensitivity of changes in mode shapes with respect to the diameter and thickness variations determined from measurements of an actual cylinder.
Various methods have been used over the last decade to analyze the vibration characteristics of a cylinder with asymmetrical properties [12-15]. Koumousis [12] described the radial displacement of a non-circular cylinder with a Fourier series and the axial displacement with a power series. The natural frequencies were obtained by solving the characteristic equation of the cylinder using a recursive scheme in conjunction with the method of successive approximations. Based on Kirchhoff-Love theory, Kumar and Singh [14] derived the dynamic governing function of a non-circular cylinder. They then constructed the function by a combination of eigen-functions for beams and quantic Bezier functions, and calculated the natural frequencies by the Ritz method. Hasheminejad [16] used the finite element method (FEM) to analyze the free vibration of an eccentric hollow cylinder, in order to verify results derived from an exact 3D elasticity theory. He examined both the natural frequencies and 3D mode shapes of the hollow cylinder as functions of the size of the eccentric hole. For prediction of vibration in complex structure, Xiaolin Tang [17] have provided qualitative methods to simulate tensional vibration of a series-parallel hybrid electric vehicle.
Among the methods used in the previous work, FEM appears to be more flexible for modeling structures with complex geometries and material distributions. Accordingly, in this paper, FEM is utilized to build the vibration model of an asymmetric cylinder. The model will take account of the internal shear stress and moment when describing the cylinder vibration. Diameter and thickness variations are introduced in the model based on data measured from an actual cylinder. The stability, convergence, and accuracy of the method are firstly checked against the numerical results for a free circular cylinder with or without slight fluctuations in diameter and thickness. Then, the effects of simplified diameter and thickness variations in the free cylinder on its natural frequencies and mode shapes are examined to determine the sensitivity of the modal characteristics to variation. Furthermore, a more realistic variation is used in the free cylinder model so that the numerical results can be compared with those measured from the actual free cylinder.
2. Examination and modeling of a cylinder
2.1. Asymmetry examination of a typical cylinder
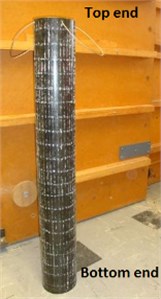
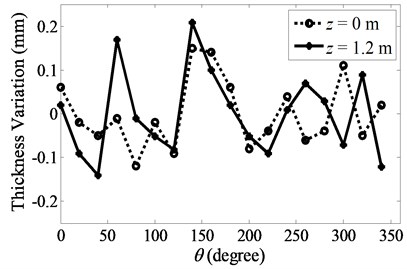
Fig. 1 shows a typical circular cylinder used for this study. The length, maximum inner and outer diameters, and wall thickness of the cylinder are, respectively, 1.2 m, 0.156 m, 0.170 m and 7 mm. The inner and outer diameters are not constant. The diameters were measured using a pair of Vernier scale calipers from 0° (defined at the welding line) of the cylinder coordinates to 170°, with a 10° angular interval. Their diameter variations around the average values are plotted in Fig. 2. These are within ±0.6 mm, which is about 0.4 % of the average diameter. The different variations of the inner and outer diameters at the same angular positions indicate a variation in the cylinder’s wall thickness. The measured wall thickness variations at the top and bottom ends are shown in Fig. 3. They are within ±0.22 mm, which is about 3 % of the average thickness.
Fig. 1The cylinder used for the FEM and the experimental study, and its coordinates
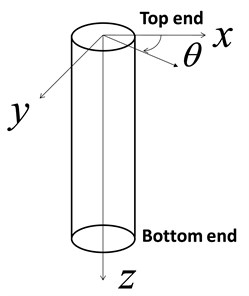
Another important observation from Fig. 2 is that the maximum diameter variation at the top end (0 m) occurs at a different angular location from that at the bottom end (1.2 m). At the bottom end, it leads by approximately 20°. Based on this observation, we postulate that the diameter variation pattern gradually shifts, along the negative direction, from the bottom end of the cylinder to the top end, and that the angle of shift per unit length along the axial direction is 20/1.2°/m. Although this assumption could be justified by a direct diameter measurement after cutting the cylinder at many cross sections along its length, as will be shown, the angular shift of measured axial nodal lines of some mode shapes supports this assumption.
Fig. 2Measured variation of diameters at a) the top end, z= 0 m, and b) the bottom end (z= 1.2 m) of the cylinder
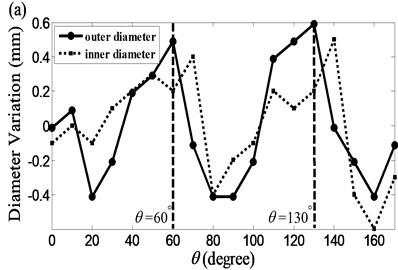
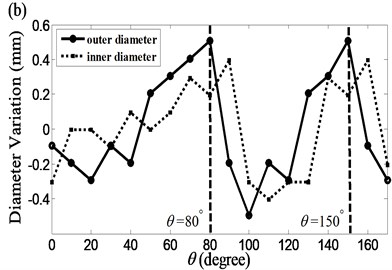
Fig. 3Measured variations of the cylinder wall thickness
2.2. Modeling of cylinder vibration
Although the vibration of a cylinder with slight variations has no general analytical solution, it can be readily modeled and solved by numerical schemes such as the FEM. In the FEM, the cylinder is divided into a number of elements. Each element is connected to adjacent elements at its corners, known as nodal points. The displacement vector of the element is described by the nodal displacements and a set of coefficients using a shape function [18, 19]:
where, , and are nodal displacement of node in the Cartesian coordinate system, the relationship between stress and strain in the element can be written as [19]:
where, is stress vector , is elasticity or elastic stiffness matrix, is total strain vector , which is described as[19]:
The element stiffness matrix can be derived and written as [19]:
where [] is Jacobian matrix, other definitions of matrix can be found in reference [19]. Accordingly, the mass matrix is calculated and shown as:
The element stiffness and mass matrices are assembled in to get global matrices. The equation of motion of the cylinder can be written as:
To calculate the vibration characteristics of the cylinder, 10 nodes tetrahedral element is selected for meshing the geometry. For exist of the middle nodes in every edge of element, internal shear stress can be calculated by Eq. (2) and Eq. (3). Internal moment is also achieved by the follow equation:
Fig. 4FEM model of the free cylinder
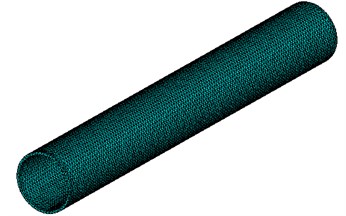
In this paper, the geometric model of a cylinder with slight thickness and diameter variation is established in SOLIDWORKS by data of Fig. 2 and 3 with consideration of assumptions in Section 2.1. Then, it is imported into FEM software ANSYS and meshed by 10 nodes tetrahedral element. The finite element model of the cylinder with free boundary condition is obtained and shown in Fig. 4. Through mode analysis module in the software, the natural frequencies and mode shapes of the free cylinder are calculated by solving eigenvalue problem of Eq. (6).
3. Results and discussion
3.1. Characteristics of simplified models
To study the sensitivity of the vibration characteristics of the cylinder to each variation, the diameter and thickness variations are studied separately using two simplified models.
For the first simplified model, the cross-section profile at the axial coordinate of the cylinder is described by an ellipse with a constant wall thickness. The inner and outer radii are expressed by:
where is the maximum diameter variation from the average diameter () of the cylinder and is the angular shift of the cross-section profiles along the axial direction. is common function to express or . If the variation profile at the top end shifts with respect to that at the bottom end by a twist angle (as determined experimentally) and the shift is linear along the -direction, then is expressed as:
where is an initial phase angle at the top end.
Based on the measured inner and outer diameters shown in Fig. 2, the major and minor axes of the outer ellipse are selected, respectively, as 0.085 m and 0.0845 m. Those of the inner ellipse are 0.078 m and 0.0775 m. For this case, the wall thickness is 7 mm. Fig. 5 shows the diameter variations at the bottom and top ends of the cylinder.
The second simplified model describes the wall thickness variation by a slight shift of the inner circular wall from the center. The thickness of the cylinder is then expressed by:
where is the maximum thickness variation, and are the outer and inner radii and defines the shift angle of the thickness variation profile along the -direction. If the maximum thickness variation at the top end leads that at the bottom by a twist angle and the twist of the thickness variation profile is linear along the -direction, then:
where is an initial angle of the thickness variation at the top end.
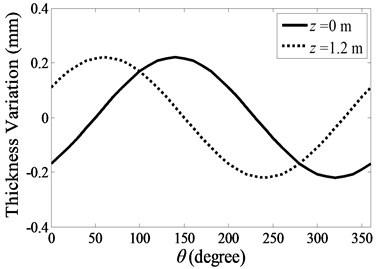
Based on the measured wall thickness, the maximum thickness variation from the average value is 0.22 mm. For this model the inner and outer diameters are 0.156 m and 0.170 m respectively. Using the angular positions of the first peaks in the thickness variation curves in Fig. 3, we obtained and . Fig. 6 shows the thickness variations used in the second simplified model.
Fig. 5Diameter variation used by the first simplified model
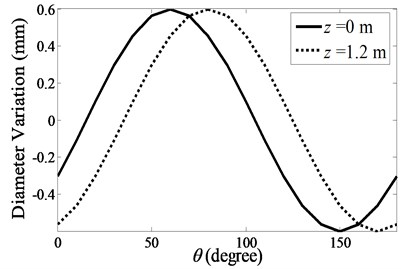
Fig. 6Thickness variation used by the second simplified model
For comparison purposes, the model characteristics of a circular free cylinder without diameter and thickness variation are also analyzed. The length, inner and outer diameters, and wall thickness of this cylinder are, respectively, 1.2 m, 0.156 m, 0.170 m and 7 mm.
The first ten natural frequencies of the free cylinder described by the two simplified models are obtained using FEM and listed in Table 1, along with those of the circular cylinder without any variation. The free-free boundary conditions are assumed for all of the models. The corresponding modal shapes are described by circumferential (m: number of node pairs) and axial (n: number of nodes) node numbers [20] in an ascending order of the natural frequencies. Also, the mode shape of the free cylinder is expended in planar style [20] to show their changes clearly.
Table 1The first ten natural frequencies and mode numbers of the two simplified models and the model without any variation
Mode order (free-free) | No variation | Thickness variation | Diameter variation | |||
(Hz) | (, ) | (Hz) | (, ) | (Hz) | (, ) | |
1 | 666 | (1, 2) | 665 | (1, 2) | 663 | (1, 2) |
2 | 666 | (1, 2) | 666 | (1, 2) | 665 | (1, 2) |
3 | 711 | (2, 0) | 713 | (2, 0) | 719 | (2, 0) |
4 | 711 | (2, 0) | 713 | (2, 0) | 723 | (2, 1) |
5 | 715 | (2, 1) | 717 | (2, 1) | 725 | (2, 0) |
6 | 715 | (2, 1) | 717 | (2, 1) | 728 | (2, 1) |
7 | 770 | (2, 2) | 772 | (2, 2) | 778 | (2, 2) |
8 | 770 | (2, 2) | 772 | (2, 2) | 782 | (2, 2) |
9 | 980 | (2, 3) | 982 | (2, 3) | 986 | (2, 3) |
10 | 980 | (2, 3) | 982 | (2, 3) | 990 | (2, 3) |
It is well known that the modes of the cylinders exist in pairs, in which each pair has the same node numbers and two spatially orthogonal mode shapes. In the Table 1, the natural frequencies of the modal pairs of the cylinder with the specified thickness variation are identical except for a small difference existing in the (1, 2) mode pair.
On the other hand, the natural frequencies of the mode pairs of the free cylinder with diameter variation can be quite different from each other. In comparison with the natural frequency of the circular cylinder, one mode in the pair shifts to the lower frequency and the other shifts to the higher frequency. The shift of some natural frequencies of the mode pairs is so significant that the mode orders change. For example, the second natural frequency of the (2, 0) mode pair becomes higher than the first natural frequency of the (2, 1) mode pair. As a result, the mode order of the latter is ahead of that of the former.
Table 1 demonstrates that different variation affects the natural frequencies of the free cylinder differently. For the selected cylinder, the diameter variation seems to be responsible for the large split of the natural frequencies in the modal pairs. Accordingly, the mode shapes of the first ten modes of the free cylinders with diameter or thickness variations are plotted in Table 3, together with those of the cylinder without variation. Compared with the mode shapes of the free cylinder without variation, the changes of the mode shapes of the cylinders with variations can be summarized as follows.
Table 2Starting and ending angles of the first node lines of the first ten modes.
Mode order (free-free) | No variation | Thickness variation | Diameter variation | |||
1 | 0 | 0 | 12 | 12 | 75 | 75 |
2 | 90 | 90 | 102 | 102 | 165 | 165 |
3 | 0 | 0 | 6 | 0 | 24 | 36 |
4 | 45 | 45 | 42 | 48 | 108 | 42 |
5 | 0 | 0 | 54 | 48 | 54 | 96 |
6 | 45 | 45 | 6 | 6 | 162 | 78 |
7 | 0 | 0 | 42 | 42 | 30 | 30 |
8 | 45 | 45 | 87 | 87 | 75 | 75 |
9 | 0 | 0 | 42 | 42 | 30 | 30 |
10 | 45 | 45 | 87 | 87 | 75 | 75 |
Table 3The first10 mode shapes of the two simplified models compared with that with no variation.
Mode order (free-free) | (, ) | No Variation | Thickness Variation | Diameter Variation |
1 | (1,2) | 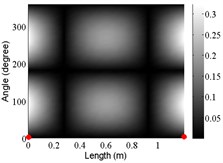 | 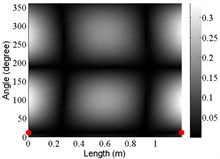 | 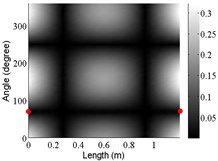 |
2 | (1,2) | 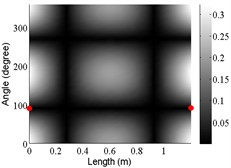 | 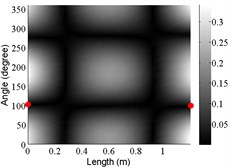 | 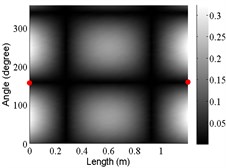 |
3 | (2,0) | 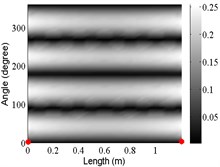 | 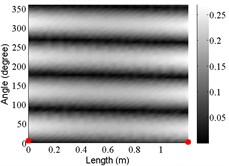 | 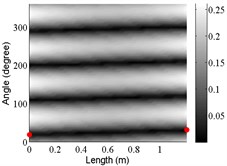 |
4 | (2,0) | 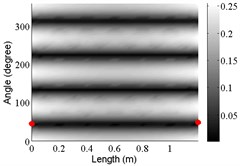 | 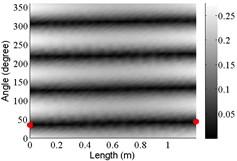 | 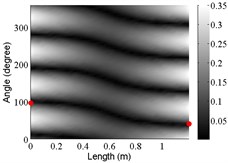 |
5 | (2,1) | 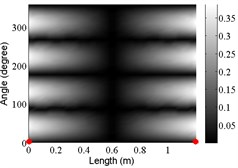 | 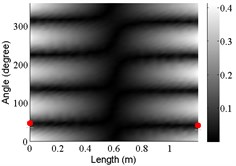 | 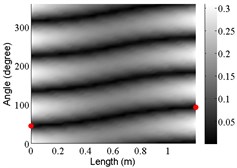 |
6 | (2,1) | 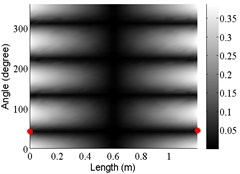 | 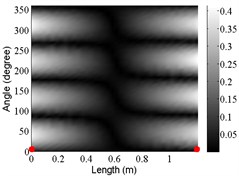 | 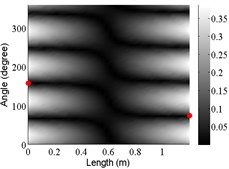 |
7 | (2,2) | 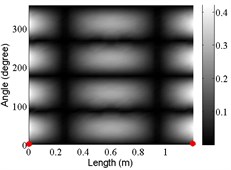 | 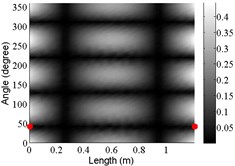 | 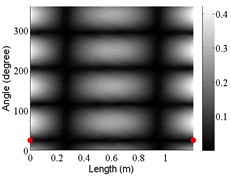 |
8 | (2,2) | 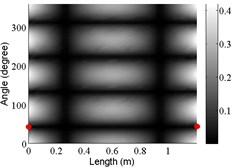 | 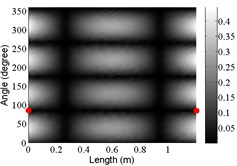 | 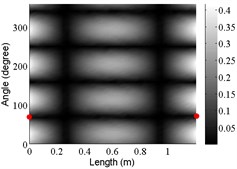 |
9 | (2,3) | 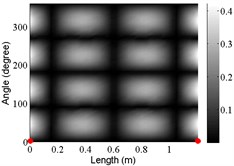 | 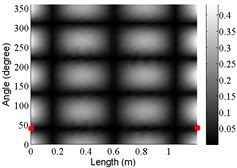 | 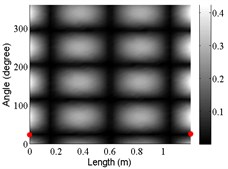 |
10 | (2,3) | 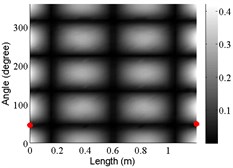 | 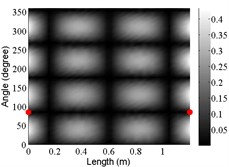 | 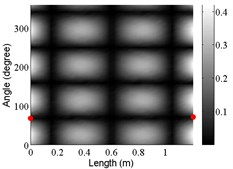 |
The angular locations of the axial nodal lines shift from that of the free cylinder without variation; and the axial nodal lines of some modes are twisted. In which the angular shift of the axial nodal lines is measured by the difference between the angular position of the first nodal line of the mode of the free cylinder with variation and that of the cylinder without variation. The positions of the two ends of the first nodal lines are marked by red dots on model shapes in Table 3. The twist angle () of each axial nodal line is measured by the difference of the angular position of the first axial nodal line at (the ending angle ) and that at 0 (the starting angle ). For the three cylinder models, the starting and ending angles of the first axial node lines of the first ten modes are listed in Table 2. This illustrates that the mode shapes of the cylinders are sensitive to both thickness and diameter variations.
Clearly, the asymmetry created by the variations causes the shift and twist of the angular positions of the axial nodal lines from that of the cylinder without variations in Table 3. It is also revealed from Table 3 that angular shift or twist of the axial nodal lines appear more obviously in diameter variation model, especially at third ,4th, 5th mode shape. It is seem that the diameter variation described by the simplified model captures the key influencing elements that affect the modal characteristics of the cylinder. To validate above conclusion and reveal the relationship between initial angle Φ0 or the twist angle and thickness or diameter variations, the effects of a slight variation in its diameter and thickness on structural dynamic properties are studied as follows.
To demonstrate the dependence of the shift and twist of the axial nodal lines on , , and , four cases of parameter study are carried out using the two simplified variation models.
3.1.1. Case 1: 90° 180° and –80° with thickness variation
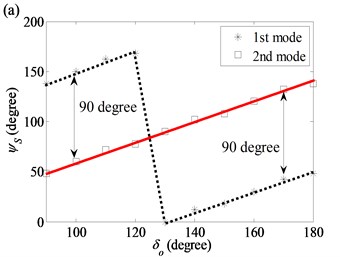
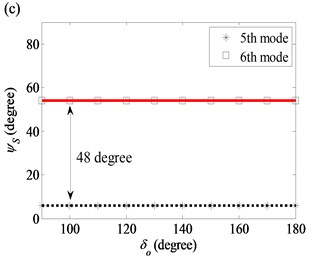
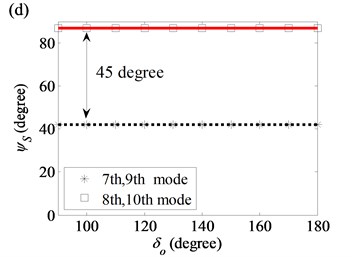
Fig. 7 shows the starting angle of the first ten modes as a function of the initial angle in the thickness variation. For this case, the twist angle of the thickness profile is kept as a constant. Results for the same circumferential and axial node numbers are grouped together for comparison. A simple linear relationship between and is found except for a 180° jump in for the first mode in Fig. 7(a). There are two axial nodal lines for each of the (1, 2) modes and they are 180° apart. An increase of increases both angular positions of the two axial nodal lines at 0. When the angular position of the first axial nodal line exceeds 180o, the starting angle of the second axial nodal line passes 360° and becomes , which therefore results in the jump.
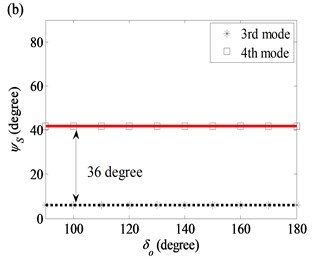
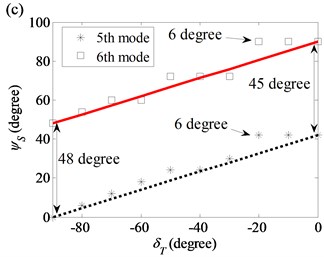
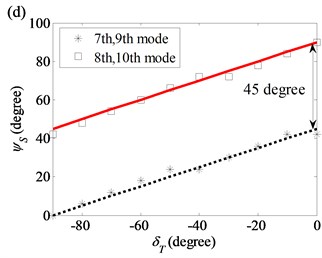
Table 2 shows that the difference between the first node lines of the modes in the modal pair is either 90° (1) or 45° (2). However, Fig. 7 shows that, due to thickness variation, the difference for the modes in the (2, 1) modal pair is 48° (see Fig. 7(c)), while the difference for the modes in (2, 0) pair is 36° (see Fig. 7(b)).
Fig. 7Starting angles of the first ten modes as functions of initial angle in the thickness variation model: a) (1, 2) modal pair; b) (2, 0) modal pair; c) (2, 1) modal pair; d) (2, 2) and (2, 3) modal pairs
3.1.2. Case 2: 140° and –90°0° with thickness variation
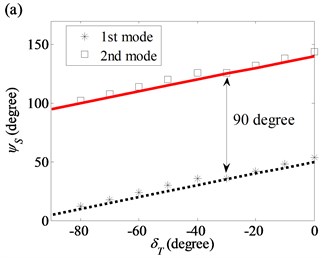
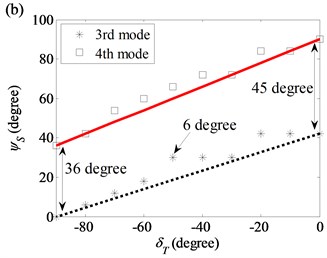
Fig. 8 shows the starting angle of the modes as a function of , while is kept as a constant. For the (1, 2), (2, 2) and (2, 3) modes, and are linearly related. For the other modes, fluctuates around a straight line of best fit. The maximum fluctuation angle is 6°. As , varies from 0° to –90°, the difference in the starting angles between the two modes in the (2, 0) mode pair decreases from 45° to 36°, and that of the (2, 1) mode pair increase from 45° to 48°.
Fig. 8Starting angles of the first ten modes as functions of twist angle in the thickness variation model: a) (1, 2) modal pair; b) (2, 0) modal pair; c) (2, 1) modal pair; d) (2, 2) and (2, 3) modal pairs
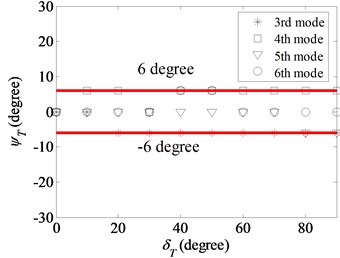
For thickness variation, the axial nodal lines of the 3rd, 4th, 5th and 6th modes in the (2, 0) and (2, 1) modal pairs are twisted slightly. Depending on , the magnitudes of the twist angles are less than or equal to 6° as shown in Fig. 9.
Fig. 9Twist angles of the 3rd, 4th, 5th and 6th modes as a function of twist angle in the thickness variation model
3.1.3. Case 3: 90°180° and 20° with diameter variation
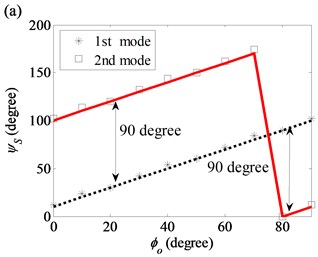
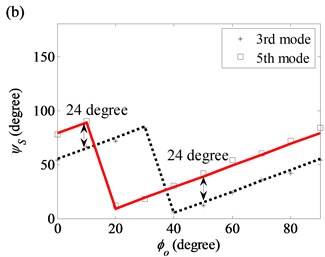
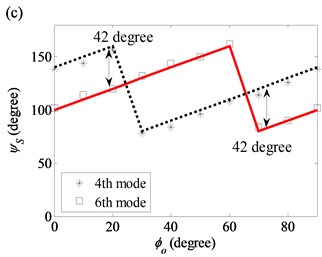
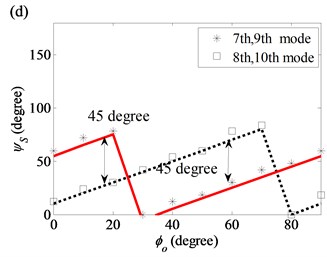
Fig. 10 illustrates as a function of the initial angular position of the diameter variation and when 20°. A linear relationship exists between and . The differences between the starting angles of the modes in the (2, 0) and (2, 1) modal pairs become 24° and 42°, respectively.
Fig. 10Starting angles of the first ten modes as functions of initial angle in the diameter variation model: (a) (1, 2) modal pair; (b) (2, 0) modal pair; (c) (2, 1) modal pair; (d) (2, 2) and (2, 3) modal pairs
3.1.4. Case 4: 60° and 0°90° with diameter variation
Fig. 11 shows that is linearly related to of the modes in the (1, 2), (2, 2) and (2, 3) modal pairs. However, no exact linear relation between and can be found for the (2, 0) and (2, 1) modal pairs.
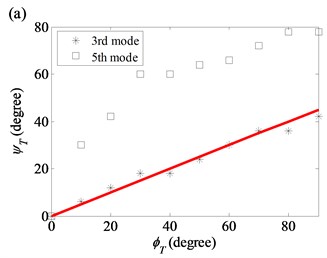
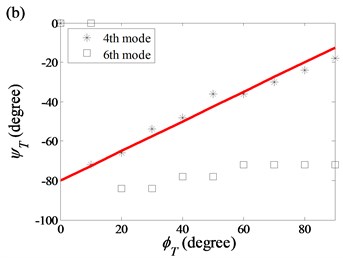
For diameter variation, the twist of the axial nodal lines of the 3rd, 4th, 5th and 6th modes in the (2, 0) and (2, 1) modal pairs are significantly affected by the twisted angle in the diameter variation model. The of the 3rd and 4th modes increases linearly while increases from 0° to 90° and are summarized by the following expressions:
For the 3rd mode:
For the 4th mode:
However, and for the 5th and 6th modes in Fig. 12 are not linearly related. Comparing the twist angles in Fig. 8 with those in Fig. 12, a value of caused by of diameter variation can be much larger than that caused by of thickness variation. Thus, when both thickness and diameter variations are present, the large twist of the mode shape is caused by the twist in diameter variation.
Even though the curve-fitted relationships, shown in Figs. 7 to 12, between the changes in mode shapes (in terms of starting and twist angles of the nodal lines) diameter and thickness variations (in terms of initial angles , and twist angles , of the variation) are obtained from the two simplified models, a simple and linear dependence of the changes in mode shapes on the characteristic angles of the variation is observed for most of the modes in the free cylinder. They are useful for an estimate of the effect of variations on the magnitude and direction of the changes in free mode shapes.
Fig. 11Starting angles of the first ten modes as functions of twist angle in the diameter variation model: a) (1, 2) modal pair; b) (2, 0) modal pair; c) (2, 1) modal pair; d) (2, 2) and (2, 3) modal pairs
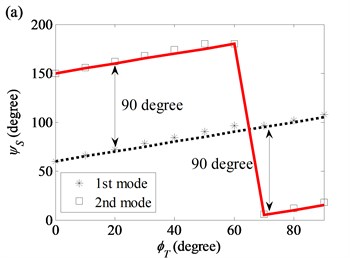
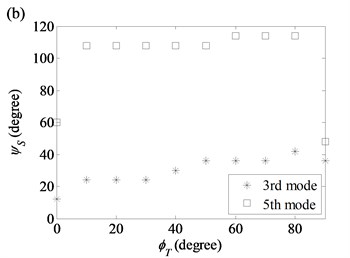
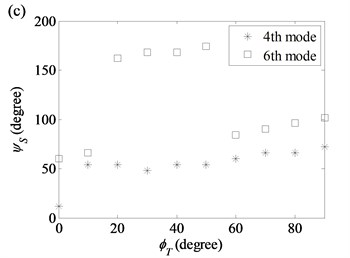
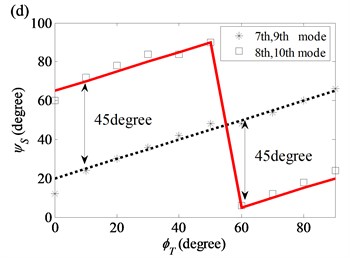
Fig. 12Twist angles of the 3rd, 4th, 5th and 6th modes as a function of twist angle in the diameter variation model: a) (2, 0) modal pair; b) (2, 1) modal pair
3.2. Characteristics of a realistic model
In this section, a realistic model of the variation profiles of the cylinder is used in FEM simulations so that the predicted free modal characteristics of the cylinder shown in Fig. 1 can be compared with measured results. Fig. 2 shows two positive peaks in the measured diameter variation. In subsection above, only the first peak was described by Eq. (8) for simplification purposes. To include both peaks in the diameter variation profile, the inner and outer radii are expressed as follows:
For :
For :
where is the maximum variation in the diameters from that of the circular cylinder and and are the relative angular shifts of the elliptical profiles along the axial direction. If the diameter variation profile at the top end shifts with respect to that at the bottom end by a twist angle and the shift is linear along the -direction, then and are expressed as:
where and are the initial phase angles of the diameter profiles. According to the experimental data on the external profiles of the cross section, , and . The major and minor axes of the external ellipses are, respectively, 0.085 m and 0.0845 m. Fig. 13 shows the diameter variation at the bottom and top ends of the external profiles of the cylinder.
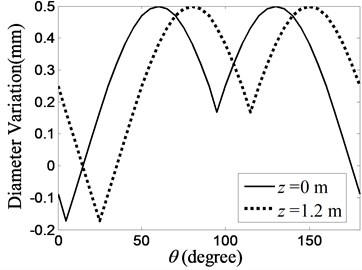
For the internal profile of the cross section, , and . The major and minor axes of the external ellipses are 0.078 m and 0.0775 m respectively. The diameter variation of the internal profile is plotted in Fig. 14. The 10° shift of the initial phase angles between the internal and external diameter variations describes the variation in wall thickness of this model.
Fig. 13Diameter variation of the external profile of a realistic cylinder model
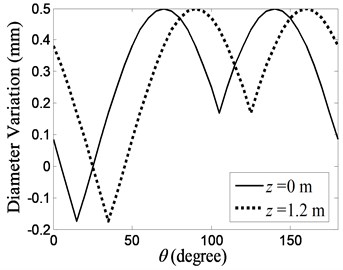
Fig. 14Diameter variation of the internal profile of a realistic cylinder model
The natural frequencies, starting and ending angles of the first axial nodal line of each mode are listed in Table 4, together with the measured results. The corresponding FEA and measured mode shapes are plotted in Table 5. Although the realistic model includes more complex diameter variation and thickness variation, the general trends in the shift of natural frequencies and changes in starting and ending angles of the first nodal lines of the free modes are similar to those due to diameter variation in the simplified model. In summary:
Diameter variation plays a major role in generating large frequency shifts and large changes in the starting and ending angles. It is also responsible for the large twist angles of the first nodal lines of some modes. So, the diameter variation described by the simplified model captures the key influencing elements that affect the modal characteristics of the cylinder.
Table 4The FEM and measured natural frequencies and starting and ending angles of the first ten modes
Mode order (free-free) | (Hz) | (, ) | |||||||
FEA | Test | FEA | Test | FEA | Test | FEA | Test | ||
1 | 664 | 655 | 90 | 90 | 90 | 90 | 0 | 0 | (1, 2) |
2 | 666 | 657 | 0 | 0 | 0 | 0 | 0 | 0 | (1, 2) |
3 | 709 | 713 | 36 | 20 | 48 | 30 | 12 | 10 | (2, 0) |
4 | 713 | 715 | 126 | 120 | 54 | 50 | –72 | –70 | (2, 1) |
5 | 718 | 717 | 72 | 50 | 102 | 80 | 30 | 30 | (2, 0) |
6 | 721 | 724 | 84 | 80 | 84 | 80 | 0 | 0 | (2, 1) |
7 | 768 | 771 | 42 | 40 | 42 | 40 | 0 | 0 | (2, 2) |
8 | 775 | 777 | 84 | 80 | 84 | 80 | 0 | 0 | (2, 2) |
9 | 979 | 973 | 54 | 50 | 54 | 50 | 0 | 0 | (2, 3) |
10 | 984 | 982 | 12 | 10 | 12 | 10 | 0 | 0 | (2, 3) |
4. Experimental verification
The cylinder shown in Fig. 1 was suspended on a rigid steel frame by two steel cables through four holes near the top end to simulate free-free boundary condition. The cylinder surface was uniformly divided into 36×20 sub-areas as shown in Fig. 15. The top and bottom sub-areas were respectively 0.04 m away from their nearest ends. The vertices of the sub-areas were chosen as test points. There was 36 and 21 measurement points distributed uniformly in the radial and axial directions respectively. The total number of measurement points was 756. The number sequence is noted in Fig. 15 and it increased clockwise around each cross section and from top to bottom.
Table 5The FEM and measured first ten mode shapes of the cylinder with realistic diameter and thickness variation
Mode order (free-free) | (, ) | FEM results | Measured results |
1 | (1, 2) | 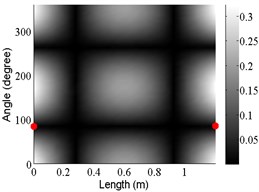 | 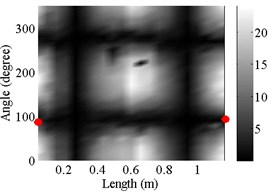 |
2 | (1, 2) | 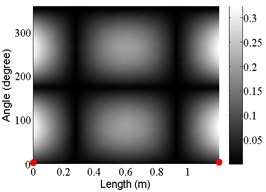 | 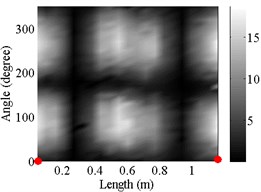 |
3 | (2, 0) | 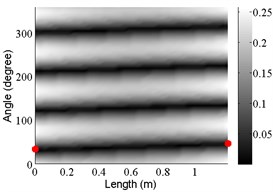 | 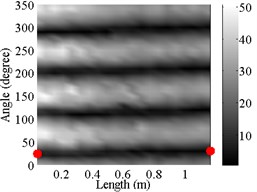 |
4 | (2, 1) | 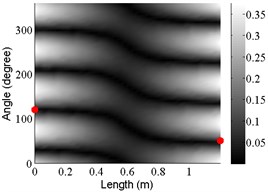 | 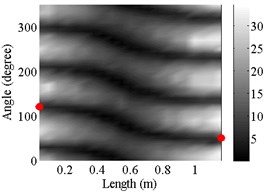 |
5 | (2, 0) | 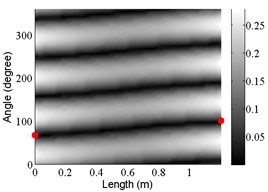 | 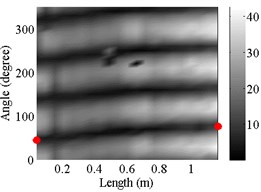 |
6 | (2, 1) | 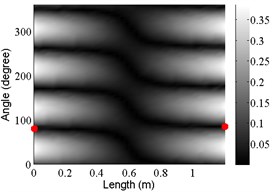 | 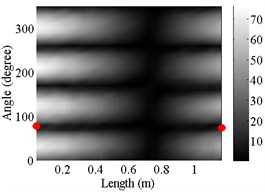 |
7 | (2, 2) | 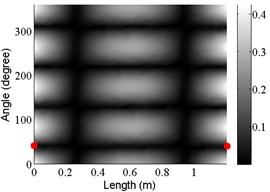 | 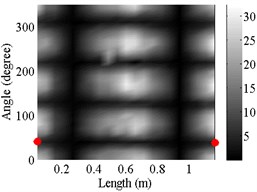 |
8 | (2, 2) | 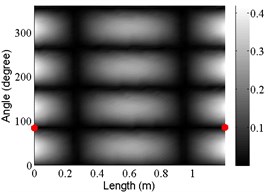 | 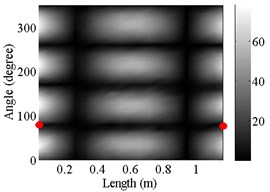 |
9 | (2, 3) | 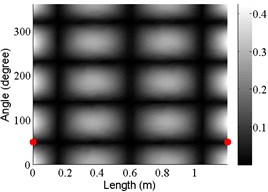 | 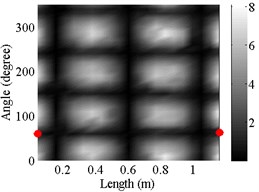 |
10 | (2, 3) | 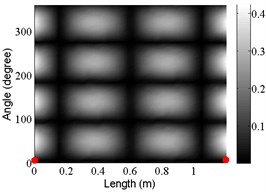 | 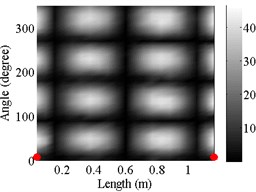 |
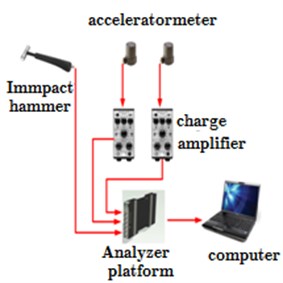
The impulse responses of the cylinder were measured by using an B&K 8203 impact hammer and two B&K4384 accelerometers. An impact force was produced by the impact hammer, which excited the vibration of the cylinder in a wide frequency range. The vibration responses at the measurement points were picked up by the accelerometers and transferred to B&K data acquisition and analysis software through charge amplifiers B&K2635. all the relationships of experimental instrument can be seen in Fig. 16. Then, frequency response function at each measurement point was calculated by the measured acceleration and force, which are shown as follows [21]:
where, is frequency response function between acceleration and input force. is cross spectrum between acceleration and force signal, is auto spectrum of input force. is circular frequency.
In the test, the position of the driving point was fixed and the two accelerometers were shifted over all of the measurement points. The sampling frequency of the collecting system was set at 6000 Hz and the frequency range of interest was below 1000 Hz. It is essential to add exponential window and time dominate average in sets of analysis software to improve the force signal to noise ratio and data precision. Also, a measurement at every test point was repeated six times and averaged linearly to decrease the effect of noise. Three drive points were selected at the 41th, 364th and 267th test points so that all of the modes in the frequency range could be clearly examined.
Fig. 15Distribution of test points around the experimental cylinder
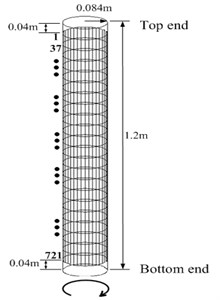
Fig. 16Sketch map of instrument’s relationship in the experiment
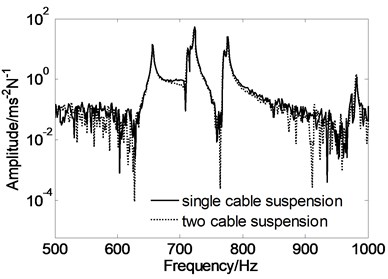
To check if the steel cable suspension affects the free boundary conditions of the cylinder, the frequency response functions of the cylinder for the same testing and driving points were compared for two cable suspension configurations. The first configuration was the cylinder suspended by a single steel cable at approximately the 1st and 9th test points of the cylinder. The second configuration was suspension by two cables at approximately the 1st, 9th, 18th and 27th test points. For both configurations, the drive point was located at the 41st test point and the measuring points were at the 90th ,198th, 306th ,414th, 522th and 630th test points, which formed one line along the axial direction. Fig. 17 shows a comparison of example results at the 90th measurement point. These comparisons showed that the cable suspension boundary conditions have very little influence on the test results in the frequency range of interest.
Fig. 17Frequency response functions of the cylinder at the 90th measurement point for two different suspension configurations and simulation
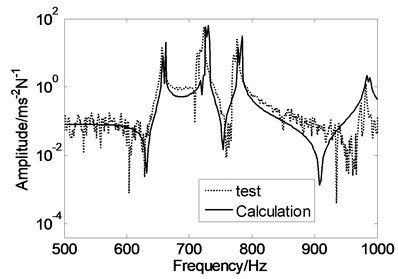
Furthermore, the harmonic responses were calculated in FEM model at the same deriving point of measurement. The frequency response functions can be derived by below equation:
where, is displacement response at selected location and is harmonic deriving force. The simulated response function at same location of 90th measurement points is selected as an example to compare with that in test, which is also shown in Fig. 17. The comparison shows that response functions derived from test and calculations are agreed with each other. It is proved that the FEM model used for analyzing the asymmetric characteristic of the free cylinder with slight thickness and diameter variation is reasonable.
Using the frequency response functions measured at all test points, the natural frequencies of the modes are determined by the peak of function’s amplitude and change of its phase change in the responses. Then, the mode shapes are constructed by amplitude of all response functions at the peak frequencies. The natural frequencies of the first ten modes have already been listed in Table 4, and the corresponding mode shapes are shown in Table 5.
By comparing the predicted and measured natural frequencies listed in Table 4, it can be seen that the measured natural frequencies are in good agreement to the predicted values. The maximum relative difference between the predicted and measured natural frequencies is 1.2 %.
Indeed, the experimental data in Table 4 confirms the large shift of the natural frequencies of the modes in the mode pairs. Furthermore, twists of the nodal lines in the (2, 0) and (2, 1) mode shapes were observed experimentally, which supports the predictions made by FEM.
For the tested cylinder, the twist angles of the 3rd to 5th modes are 10°, –70° and 30° respectively. For other modes, the starting angles of the axial node lines of mode shapes vary from mode to mode. As shown in Table 4, the node lines of the 1st and 2nd modes are located at 0°. Meanwhile, for the 6th to 8th modes and the 9th and 10th modes, they are located at 40° and 10° respectively and there is little difference between the starting and ending angles. However, for the 3rd to 5th modes, the differences between the starting and ending angles become obvious and results in twisted nodal lines. Although the tested and predicted twist angles of the 5th mode are very close, some discrepancies are found between the tested and predicted starting and ending angles. These discrepancies may be due to errors in the measured diameters and the 10° resolution between the test points in the angular direction of the cylinder.
5. Conclusions
Perfect diameter and thickness symmetries cannot be found in actual structures as slight variations in the structures’ shape, thickness and material distribution will always exist. A study of the effects of this slight variation on the vibration characteristics of a structure is therefore necessary. In this paper, a free circular cylinder is selected as an example for such a study. Some important conclusions derived from the results of simulations and tests are listed below:
1) A slight variation in the diameter and thickness of the cylinder (in both tangential and axial directions) changes the natural frequencies and mode shapes of the free cylinder. The changes in mode shapes can be categorized by as shift and twist angles of the axial nodal lines with respect to those of a symmetrical cylinder.
2) For those modes with only shift in axial nodal lines, the starting angles of their mode shapes are linearly proportional to the initial angle (, ) and twist angle (, ) of the variations in the simplified models respectively.
3) The axial nodal lines of all modes are shifted away from those of a symmetrical cylinder. For the simplified thickness variation, the starting angles of the modes are determined by the initial angle and the twist angle of the variation. Similarly, for the simplified diameter variation, the starting angles of the modes are dependent on the initial angle and twist angle of the diameter variation.
4) In particular, for the (2, 0) and (2, 1) modes, these variations also cause a change in the order of natural frequencies and twist mode shapes along the axial direction. For each kind of variation, the twist angles of the modes are dependent on the twist angles ( and ) of the variation.
5) In general, the changes in the vibration characteristics of the free cylinder are more sensitive to the diameter variation.
6) The predicted natural frequencies and mode shapes using the realistic variation model showed a good agreement with the measured results. The twisted mode shapes and the shifting of nodal/anti-nodal were also observed experimentally.
References
-
Mofakhami M. R., Toudeshky H. H., Hashemi S. H. Finite cylinder vibrations with different end boundary conditions. Journal of Sound and Vibration, Vol. 297, 2006, p. 293-314.
-
Nieves F. J., Gascon F., Bayon A. An analytical, numerical, and experimental study of the ax symmetric vibrations of a short cylinder. Journal of Sound and Vibration, Vol. 313, 2008, p. 617-630.
-
Lin T. R., Pan J. Vibration characteristics of a box-type structure. Journal of Vibration and Acoustics, Vol. 131, Issue 1, 2009, p. 1-13.
-
Soldatos K. P. Mechanics of cylindrical shells with non-circular cross-section: a survey. Applied Mechanics Reviews, Vol. 52, Issue 8, 1999, p. 237-274.
-
McDaniel T. J., Logan J. D. Dynamics of cylindrical shells with variable curvature. Journal of Sound and Vibration, Vol. 19, Issue 1, 1971, p. 39-48.
-
Radhamohan S. K., Maiti M. Vibrations of initially stressed cylinders of variable thickness. Journal of Sound and Vibration, Vol. 53, Issue 2, 1977, p. 267-271.
-
Tonin R. F., Bies D. A. Free Vibration of circular cylinders of variable thickness. Journal of Sound and Vibration, Vol. 62, Issue 2, 1979, p. 165-180.
-
Sivadas K. R., Ganesan N. Free vibration of circular cylindrical shells with axially varying thickness. Journal of Sound and Vibration, Vol. 147, Issue 1, 1991, p. 73-85.
-
Ganesan N., Sivadas K. R. Vibration analysis of orthotropic shells with variable thickness. Computer and Structures, Vol. 35, Issue 3, 1990, p. 239-248.
-
Suzuki K., Leissa A. W. Free vibrations of noncircular cylindrical shells having circumferentially varying thickness. Journal of Applied Mechanics, Vol. 52, 1985, p. 149-154.
-
Yamada G., Irie T., Tagawa Y. Free vibration of non-circular cylindrical shells with variable circumferential profile. Journal of Sound and Vibration, Vol. 95, Issue 1, 1984, p. 117-126.
-
Koumousis V. K. An explicit method for the free vibrations of non-circular cylindrical panels. Journal of Sound and Vibration, Vol. 191, Issue 5, 1996, p. 681-694.
-
Chen Y. N., Kempener J. Modal method for free vibration of oval cylindrical shells with simply supported or clamped ends. Journal of Applied Mechanics, Vol. 45, 1978, p. 142-148.
-
Kumar V., Singh A. V. Vibration analysis of noncircular cylindrical shells using Bezier functions. Journal of Sound and Vibration, Vol. 161, 1993, p. 333-354.
-
Massalas C., Soldatos K., Tzivanidis G. Free vibrations of noncircular cylindrical panels with arbitrary boundary conditions. Journal of Sound and Vibration, Vol. 69, 1980, p. 491-495.
-
Hasheminejad S. M., Mirzaei Y. Free vibration analysis of an eccentric hollow cylinder using exact 3D elasticity theory. Journal of Sound and Vibration, Vol. 326, 2009, p. 687-702.
-
Tang Xiaolin, Yang Wei, Hu Xiaosong, Zhang Dejiu A novel simplified model for tensional vibration analysis of a series-parallel hybrid electric vehicle. Mechanical System and Signal Processing, Vol. 85, 2017, p. 239-338.
-
Zienkiewicz O. C., Freng C. F. The Finite Element Method. Fifth Edition, Butterworth-Heinemann, Oxford, London, 2000.
-
Krishnamoorthy C. S. Finite Element Analysis Theory and Programming. Indian Institute of Technology, Madras, 1987.
-
Liu W., Pan J., Matthews D. Measurement of sound-radiation from a torpedo-shaped structure subjected to an axial excitation. Proceedings of the 20th International Congress on Acoustics, Sydney, Australia, 2010.
-
Rahmatalla Salam, HudsonKyle, Liu Ye, Eun Hee-Chang Finite element modal analysis and vibration- waveforms in health inspection of old bridges. Finite Elements in Analysis and Design, Vol. 78, 2014, p. 40-46.
