Abstract
Regarding the published researches on bicycles, they fail to design fatigue characteristics of the bicycle. In addition, dynamics and fatigue characteristics are not further improved by using advanced optimization algorithms. Aiming at these questions, this paper tries to optimize dynamics and fatigue characteristics of the bicycle through combining finite element model with advanced algorithms. The advanced algorithm applies ideas of cellular automation (CA) to Particle Swarm Optimization (PSO), and then a hybrid CA-PSO algorithm is proposed. Moreover, the finite element model is also validated by experimental test. Computational results show that: the maximum stress of bicycles is mainly distributed on the frame, especially on joints of different round pipes at different moments mainly because a dead corner is at the joint, and the dead corner can easily cause stress concentration. Under alternating forces, the stress concentration at joints will cause fatigue damage. Therefore, the service life of this position will be the shortest. As a result, the dynamics and fatigue characteristics of the joint position are taken as the optimized objective. In order to verify the optimized effectiveness of the proposed CA-PSO algorithm in the paper, the widely used PSO algorithm and PSO-GA algorithm are also used to optimize the bicycle. When the traditional PSO algorithm is used to optimize the bicycle, the root-mean-square value and maximum difference of vibration accelerations are decreased by 11.9 % and 14.3 %. When the PSO-GA algorithm is used to optimize the bicycle, the root-mean-square value and maximum difference of vibration accelerations are decreased by 20.3 % and 12.9 %. When the proposed CA-PSO algorithm is used to optimize the bicycle, the root-mean-square value and maximum difference of vibration accelerations are decreased by 27.1 % and 18.6 %. Compared with other two kinds of PSO algorithms, optimized effects of vibration accelerations are very obvious. In addition, the fatigue life of the original structure is 5 years, while the fatigue life of the optimized bicycle is 7 years. Therefore, the fatigue life is improved obviously.
1. Introduction
With the improvement of people’s material culture life level, bicycles are not only a sports activity instrument, but also a traffic tool [1-6]. A fitness bicycle can simulate force and work of riding in the outdoor, so as to achieve fitness effects similar to highway bicycles. An interactive fitness bicycle integrates multiple technologies such as computer technology, sensing technology and ergonomics, managing to provide riders with omni-sensory stimulation and simulate bicycle riding more vividly. How to provide immersive experience of real scenes during the riding is not only embodied in vision, but more importantly, it aims to achieve consistency between riding loads between the fitness bicycle and field riding. Highway bicycle is an endurance project with physical energy orientation. The riding is characterized by single-cycle continuity, long duration, large riding strength and high strength in sprinting. Because of these characteristics, corresponding requirements are proposed for power output of a rider at different stages. On the other hand, close combination of physical energy consumption and technology is the key to win a match. Riding of the highway bicycle has complicated dynamic principles. While trampling the pedals to drive a bicycle, a rider shall overcome many types of resistance caused by the bicycle body, ground and air. Real-time changes in factors such as acceleration, path and wind direction during riding will comprehensively affect the force and work of the rider. During riding, a bicycle bears large alternating force for a long time. Therefore, it is necessary to study its force bearing process [7-12].
At present, some scholars have made a lot of researches to analyze forces of bicycles. Based on the finite element method, Du [13] conducted modal analysis on a bicycle frame and conducted experimental verification through experimental test, obtaining vibration information of the frame on the top 8 orders. Based on dynamic analysis, Cai [14] established a dynamic mathematic model of highway bicycles, and analyzed characteristics and rules under different riding states through model solution. Chen [15] established a bicycle virtual sample machine, where the frame was processed as a flexible body to make the simulation approach actual situations, and safety of the bicycle under dangerous impact loads was analyzed. Feng [16] designed and analyzed frame materials and pipe thickness using ergonomics and mechanics of materials, so as to make the bicycle achieve function transformation and satisfy dynamic requirements. During bicycle riding, jolt and vibration would be caused easily; frequent braking will generate instant impact effects. When the instant impact force is accumulated to certain times, weak links of the frame will suffer from fatigue damage if the frame does not have sufficient strength. Therefore, above researches failed to design fatigue characteristics of the bicycle. In addition, dynamics and fatigue characteristics were not further improved by optimization algorithms.
Aiming at these problems, the paper tries to optimize dynamics and fatigue characteristics of the bicycle through combining finite element model and advanced algorithms. The paper applies ideas of cellular automation (CA) [17-20] to Particle Swarm Optimization (PSO) [21-24], and proposes a hybrid CA-PSO algorithm to study the communication structure, information transmission and inheritance mechanism of populations in the PSO algorithm. Particle swarm is deemed as a CA model, where each particle only conducts information communication with neighbors determined by a neighbor function. In this way, information can be propagated slowly in the population; population diversity can be kept; search space can be explored; and local information of each particle can be fully excavated. Very obvious effects can be obtained when the algorithm is used to optimize dynamics and fatigue characteristics of the bicycle.
2. Finite element model of bicycles
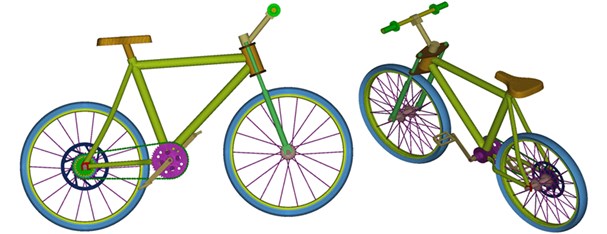
SOLIDWORKS software was used to establish a CAD model according to dimensions provided by a bicycle design drawing. In order to ensure mesh division effects in subsequent work, some chamfers and unimportant structures were neglected during modeling. Finally, a geometric model of the bicycle was obtained, as shown in Fig. 1. The bicycle is made of a frame system, a transmission system and a wheel system. The bicycle frame system is divided into a frame part and a front fork part. The frame is divided into a front triangle part and a rear triangle part. The front triangle is made of an upper pipe, a lower pipe and a seat pipe. The rear triangle is made of a seat stay and a chain stay. The transmission system is made of pedals, a chain wheel, a chain, a flywheel, a transmission, etc. The wheel system is mainly composed of tires and tire beads.
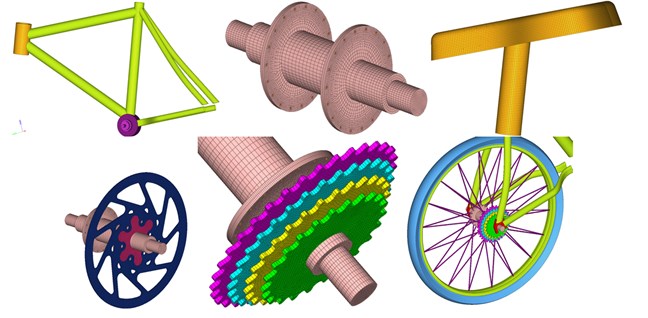
Solid elements were used to conduct mesh division of the bicycle. During mesh division, relations between division accuracy and computational scale should be weighed, and the two factors must be considered comprehensively during determining the mesh quantity. During selecting basic elements of the finite element model, the addressed aspects must be taken into account: (1) The bicycle frame is basically composed of steel pipes with various cross section shapes, while the steel pipes have small cross section size, wall thickness and length. Therefore, these structures could be dispersed by shell elements. Hexahedral solid elements have very high interpolation accuracy, but mesh division will be difficult and computational time will increase if they are used to disperse frame pipes. The computational model based on a shell structure will have a larger pre-processing workload and longer computation time than a rod system structure, but it can accurately simulate actual situations of local parts such as joints and holes. Therefore, high-accuracy stress distribution could be obtained, and stress concentration at local positions could be computed as well. This could not be achieved by the rod system structure. The bicycle frame is made of Q235 with elasticity modulus of 210 GPa, density of 7800 kg/m3 and Poisson’s ratio of 0.3. It is an isotropous linear elastic material. As for the tire rubber material, density is 1.5 kg/m3, elasticity modulus is 7.8 GPa and Poisson’s ratio of 0.47. The bicycle finite element model contains 56902 elements and 69026 nodes. Fig. 2(a) shows a complete finite element model of the bicycle. Fig. 2(b) shows a finite element model of some parts and components of the bicycle.
Fig. 1Simplified geometric model of bicycles
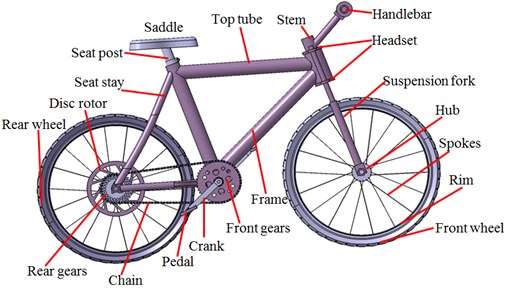
Fig. 2Finite element model of complete bicycles, parts and components
a) Finite element model of the complete bicycle
b) Finite element model of parts and components
3. Computation and verification of vibration characteristics of bicycles
3.1. Numerical computation of vibration characteristics of bicycles
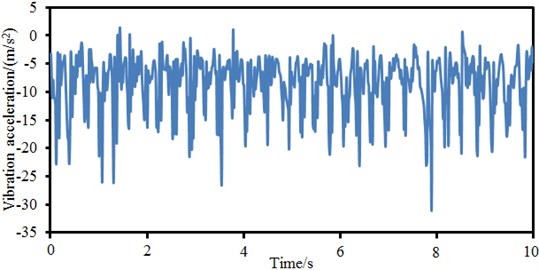
A lot of practices show that damage forms of a material or structure under alternating forces are very different from those under static forces. Under the alternating force, even if the maximum stress of the material or structure is lower than the yield limit, the structure will suffer from sudden fractures at a moment under long-term repeated effects. Even a material with high plasticity does not have obvious macroscopic plastic deformation before the fracture. Therefore, it is necessary to apply real alternating forces as the excitation during studying dynamics and fatigue characteristics of bicycles. With the published references concerning excitation loads as the reference, excitation loads at the bicycle saddle were obtained, as shown in Fig. 3. It is shown in the figure that the excitation loads presented weak periodic features, wherein the maximum absolute value was 31.2 m/s2 and the corresponding times was 8 s. The minimum value was 2.1 m/s2 and corresponding time was 1.7 s.
Fig. 3Excitation loads of bicycles
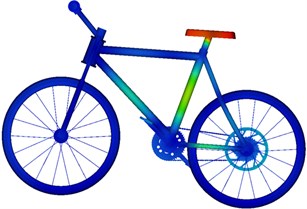
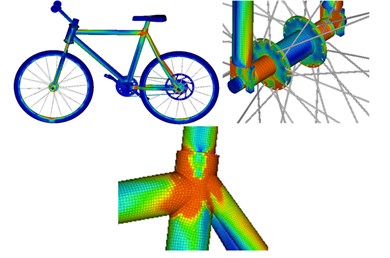
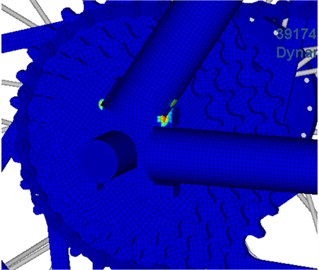
Excitation forces are uniformly applied to the bicycle saddle, and then dynamic responses are computed. Strain distribution contours at different moments are extracted, as shown in Fig. 4. It is shown in the figure that the bicycle saddle suffers from the most serious deformation at different moments as the excitation force is applied at the position. Secondly, the bicycle frame suffers from obvious deformation as the frame is mainly composed of round steel pipes with low stiffness. The bicycle handlebar suffers from the minimum deformation at all the moments because this position is far from the excitation force and has a high stiffness.
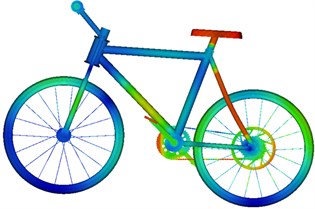
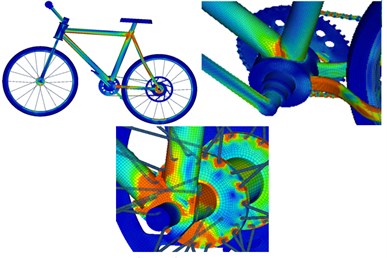
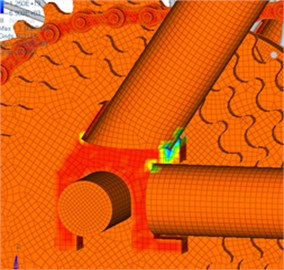
Stress contours at different moments are also extracted, as shown in Fig. 5. It is shown in the figure that the maximum stress of bicycles is mainly distributed on the frame, especially on joints of different round pipes of the frame at different moments. The bicycle frame is composed through welding of hollow round steel pipes with relatively low stiffness. Maximum stress is generated at joints of different round pipes mainly because that a dead corner is at the joint, could easily cause stress concentration and belongs to a dangerous region. Forces are uniform at the bicycle handlebar and tires and do not have obvious stress concentration phenomena. Under alternating forces, the stress concentration at joints will generate fatigue damage.
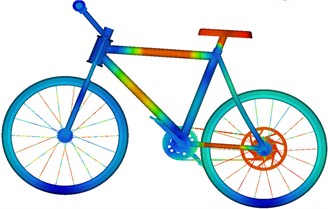
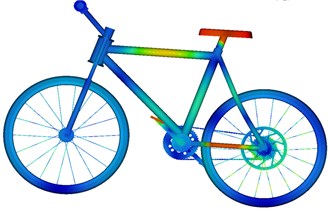
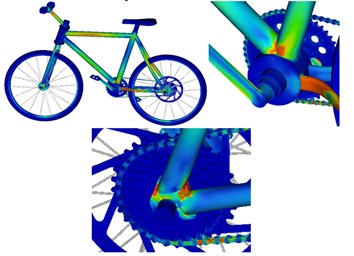
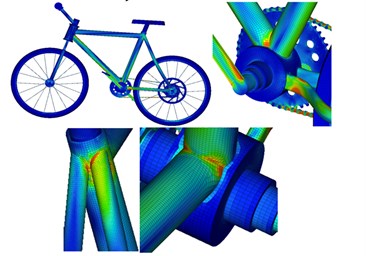
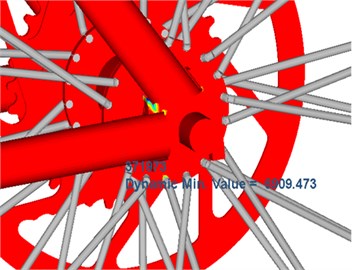
Due to material non-uniformity or geometrical shape of the structure, the structure suffers from very high stress in some regions while bearing external loads. Long-term alternating stress effects amplified the local stress value and gradually formed microscopic cracks in the local regions with high stress. Tips of microscopic cracks suffer from serious stress concentration, so the cracks begin expanding gradually and finally form macroscopic cracks. Joints of different round pipes are stress risky regions as the different round pipes are generally connected by welding. During welding, continuous welding joints are adopted along the rims, so that strength of the cross section is weakened. Fig. 6 and Fig. 7 represent fatigue damage and life of the bicycle respectively. It is shown in Fig. 6 that the round pipe joints suffer from the most serious fatigue damage. Therefore, the service life of this position is the shortest according to the fatigue life distribution in Fig. 7.
Fig. 4Strain contours of bicycles at different moments
a) Time = 1 s
b) Time = 3 s
c) Time = 5 s
d) Time = 7 s
Fig. 5Stress contours of bicycles at different moments
a) Time = 1 s
b) Time = 3 s
c) Time = 5 s
d) Time = 7 s
3.2. Experimental verification of the computational model of bicycles
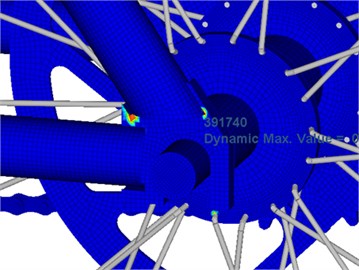
Dynamics and fatigue characteristics of the bicycle are analyzed by the computational model. However, the computational model has very complicated boundary conditions and mesh division. Therefore, the correctness of the computational model must be verified. Before experimental verification, vibration acceleration curves of corresponding positions of the bicycle must be extracted for comparison with experimental data. Fig. 8 shows vibration acceleration values at different positions. It is shown in Fig. 8 that the vibration response curves of the bicycle fluctuated very obviously; the maximum vibration acceleration responses are at the round pipe joints; the minimum vibration acceleration is at the bicycle handle; these distribution results are consistent with rules of stress and strain. In addition, it could be found that the vibration acceleration on the seat stay round pipe presents certain periodicity. At the joints, the maximum vibration acceleration is 8.5 m/s2, and the minimum vibration acceleration is –65 m/s2. Obviously, the maximum difference of vibration accelerations is 73.5 m/s2. Such obvious difference will seriously affect safety performance of the bicycle.
Fig. 6Fatigue damage distribution of bicycles
a)
b)
Fig. 7Fatigue life distribution of bicycles
a)
b)
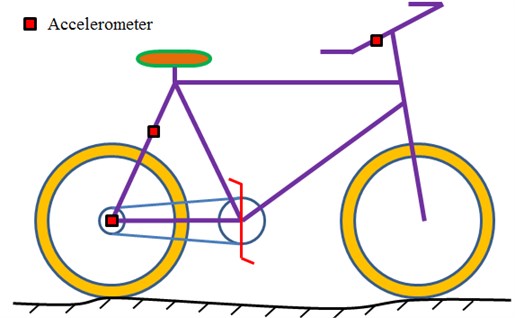
Fig. 9 shows experimental test on the bicycle vibration accelerations. The experiment aims to measure acceleration responses of the handlebar, seat stay and joint position during bicycle riding on the pavement. Experimental results are compared with those of numerical simulation, so the correctness and validity of the established simulation model could be verified. In the experiment, an LMS signal collection system and an ICP acceleration sensor are adopted. During the experiment, the tested sample bicycle is ridden on the pavement, as shown in Fig. 10(a). Sensors are set on the handlebar, seat stay and joint position, as shown in Fig. 10(b). Meanwhile, a small automobile equipped with testing instruments and equipment traveled on the flat pavement side by side with the same speed. In this way, the riding state of the tested bicycle could be ensured, and measurement errors caused by pavement jolt to instruments and equipment used in experimental testing could be avoided. In this way, the key problem in the testing experiment of bicycle riding could be solved.
Fig. 8Vibration acceleration of different positions of bicycles
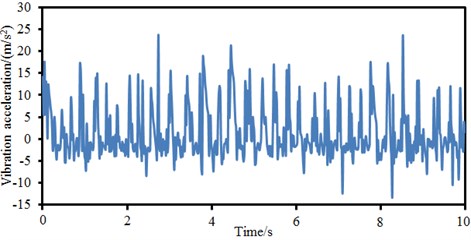
a) Handlebar
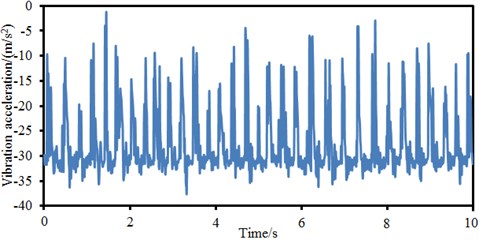
b) Seat stay
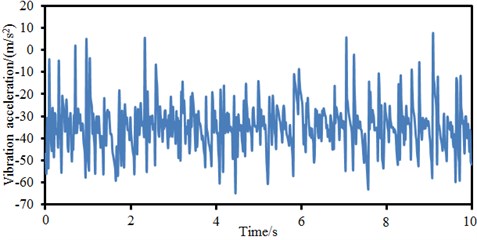
c) Joint position
Fig. 9Experimental test of vibration accelerations of bikes
Signals collected by sensors are input into software in the computer. The tested data is processed using the method [26, 27], so vibration accelerations of the bicycle handlebar, seat stay and joint position are obtained. The vibration accelerations are compared with numerical simulation results, as shown in Fig. 11. It is shown in Fig. 11 that vibration accelerations basically had the consistent changing trends between the experimental test and the numerical simulation while the accelerations did not differ a lot. Therefore, the numerical computation model established in the paper is feasible.
Fig. 10Equipment and environment of experimental test

a) Test environment
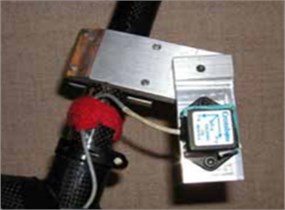
b) Test position
Fig. 11Comparison of vibration accelerations between experiment and simulation
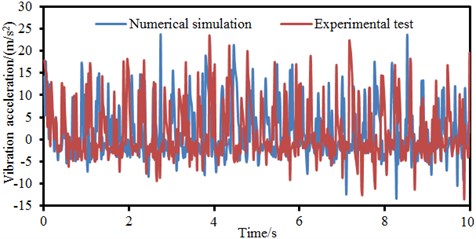
a) Handlebar
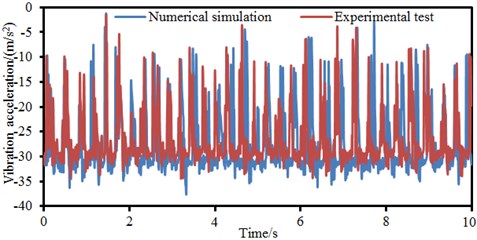
b) Seat stay
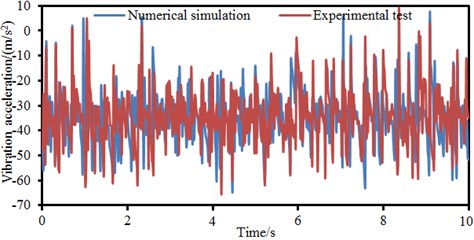
c) Joint position
4. Numerical optimization of vibration characteristics of bicycles
It is shown that large stress concentration and fatigue damage will easily appear at round pipe joints of the bicycle. The maximum vibration acceleration response also appears at this position. Therefore, the position is taken as the optimization object. Maximum difference and root-mean-square value of the vibration acceleration response are taken as optimization object. Mass is taken as a constraint. Thickness of the round steel pipe and the welding region area of the joint position are taken as design variables. Among many intelligent optimization algorithms, PSO not only has memorability, but also has the capabilities of communication, response, cooperation and self-learning. Therefore, it has excellent local search ability. Compared with other algorithms, it has fewer parameter settings, could be achieved easily and could converge more quickly under most cases. However, the PSO algorithm could easily fall into local extreme values during optimization. CA and PSO algorithms come from different fields, so they are essentially different. CA is a discrete computation model used for computation. PSO algorithm is an optimization tool applied to the optimization field. However, through comparison of CA model and PSO algorithm, many similar characteristics of them could be found. At first, both of them are composed of multi-individual sets. Individuals in CA are called as cells. Individuals in the PSO algorithm are called as particles. Each individual has inherent characteristics which could distinguish it from other individuals. Each cell in CA has a cell state respectively. In PSO algorithm, information of each particle, such as speed, position, fitness, individual optimal position and global optimal position, is taken as the particle characteristic. Current state of each cell is changed through information communications with its neighbors. Similarly, each particle communicates with other particles in the population to update its inherent characteristics. In CA, transfer rules are generally used to guide evolution and update of cells. In the PSO algorithm, particles are updated according to a speed formula and position formula. In addition, both of them are running in discrete time dimensions. Therefore, the paper applies CA ideas to the PSO algorithm to study the communication structure, and information transmission and inheritance mechanism of populations in the PSO algorithm. Particle swarm is deemed as a CA model. Each particle only conducts information communications with neighbors which are determined by a neighbor function. In this way, information is propagated slowly in the population; population diversity could be kept; search space could be explored; and local information of each particle could be fully excavated.
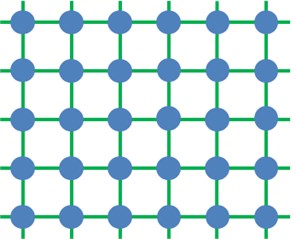
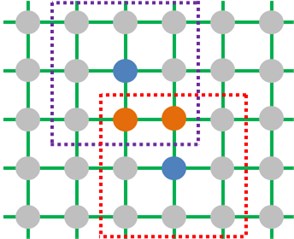
During defining CA, cells are fixed at each discrete time point. The cell state at next moment depends on its own state and impacts of neighbor cell states. In one-dimensional cellular automation, radius is generally used to determine neighbors, namely all the cells within the radius are deemed as neighbors. Neighbor definition of two-dimensional cellular automation is more complicated than one-dimensional cellular automation. Four forms are shown in Fig. 12. In general, Moore is selected as a cell neighbor definition form in the CA model.
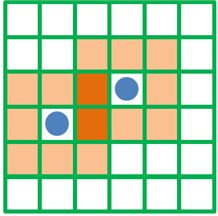
The hybrid cellular automation-particle swarm optimization algorithm (CA-PSO) is based on characteristics of a particle swarm. At first, particles are generated randomly. Then, each particle is placed in a two-dimensional mesh topology structure disorderly, as shown in Fig. 13(a). Each particle is deemed as a cell. The same neighbor amount is assigned to each cell, and the cell amount is equal to the population size. As shown in Fig. 13(b), a Moore neighbor structure is used and each cell has 8 neighbor individuals, where the grey circle represents a cell individual, the blue circle represents a center cell individual, and imaginary line frames represent its neighbor individuals. Orange individuals are overlaying neighbors between two neighbors. In fact, overlaying of the neighbor individuals provides a recessive migration mechanism for the algorithm. The mechanism can make the optimal individual get diffused gently in the whole population, so that selection pressure of the algorithm could be reduced, and diversity of the algorithm could be improved.
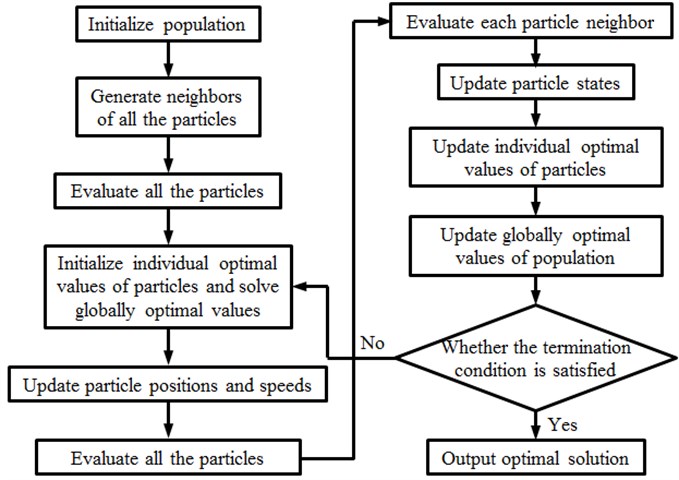
Flow diagram of Hybrid CA-PSO algorithm is shown in Fig. 14, and it is mainly realized by the following steps: (1) random initialization is conducted on a particle swarm; particles are distributed in a two-dimensional mesh structure to generate corresponding neighbors, target vectors of each particle are computed, and non-inferior solutions are stored in an external document. (2) Fitness values of particles are computed according to their positions. (3) Extreme values of particles are initialized, and the global population extreme values are solved. Fitness values computed at the previous step is used to initialize individual extreme values of particles. Individual extreme values of each particle are compared, and the global population extreme values are solved. (4) Positions and speeds of the particles are updated. (5) All the particles are evaluated; through the previous step, all the particle states are updated, so fitness values under new states shall be computed. (6) Each particle neighbor is evaluated respectively, and the fitness value of each particle neighbor is computed. (7) Fitness values of particles and their neighbors are compared; if the particle has neighbors with better fitness, the neighbor state shall be used to replace the state of next moment; otherwise, the current particle state will be kept unchanged. (8) Extreme values of particle individuals are updated. Current fitness values and individual extremes values of the particle are compared. If the current fitness values are better than individual extreme values, then the individual extreme values will be updated. (9) The global population extreme values are updated. The current global extreme values are compared with individual extreme values of each particle. The global extreme values will be updated. (10) Whether the termination condition is satisfied. If the condition is not satisfied, steps (4)-(9) will be executed repeatedly. Otherwise, the circulation will be ended, and the optimal solution will be output.
Fig. 12Neighbor definition form of two-dimensional cellular automation
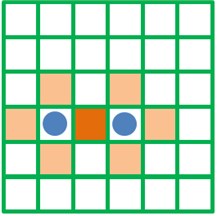
a) Von Neumann
b) Moore
c) Extended Moore
d) Margolus
Fig. 13Schematic diagram of population and neighbor structure
a) Network topology structure
b) Cellular neighbor definition
Fig. 14Flow diagram of the proposed CA-PSO algorithm
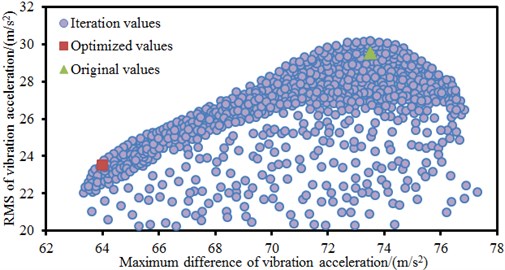
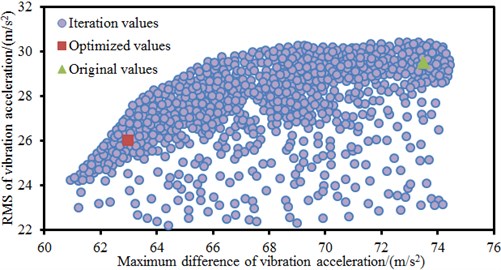
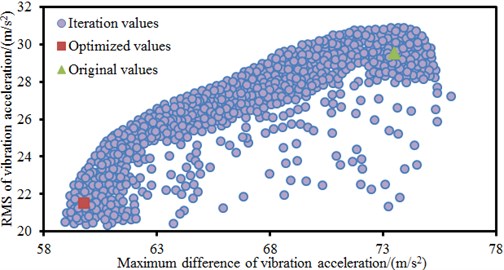
In order to verify the effectiveness of the CA-PSO algorithm proposed by the paper, the widely used PSO algorithm and PSO-GA algorithm are also used to optimize the bicycle. Errors and population iteration processes of three kinds of algorithms are shown in Fig. 15 and Fig. 16. An optimization process will converge when the set critical error of 0.01 or a termination generation is reached. It is shown in Fig. 15 that the traditional PSO algorithm cannot converge during the whole iteration process and falls into local extreme values. The PSO-GA optimization algorithm converges to the set critical error when the iteration is conducted to 480th generation. The CA-PSO algorithm proposed by the paper already converges to the set critical error when the iteration is conducted to the 320th generation. Therefore, the optimization algorithm proposed by the paper has high optimization efficiency and will not always fall into local extreme values. Root-mean-square value and maximum difference of original vibration accelerations of the bicycle are 29.5 m/s2 and 73.5 m/s2. When the traditional PSO algorithm is used to optimize the bicycle, the obtained root-mean-square value and maximum difference of optimal vibration accelerations are 26 m/s2 and 63 m/s2. The root-mean-square value and maximum difference of accelerations are decreased by 11.9 % and 14.3 %, respectively. The optimization process falls into local extreme values, but optimization effects are still obvious. When the PSO-GA algorithm is used to optimize the bicycle, the obtained root-mean-square value and maximum difference of the optimal vibration acceleration are 23.5 m/s2 and 64 m/s2. The root-mean-square value and maximum difference of accelerations are decreased by 20.3 % and 12.9 %. Obviously, compared with the PSO algorithm, the optimization effects of root-mean-square value of vibration accelerations are obvious, but the optimization effects of maximum difference are reduced. When the CA-PSO algorithm proposed by the paper is used to optimize the bicycle, the iteration has a smooth stage when the number of iterations is within 160–250 because it has fallen into the local extreme value, but it soon jumped out from this local extreme value. As a result, the obtained root-mean-square value and maximum difference of optimal vibration accelerations are 21.5 m/s2 and 59.8 m/s2. The root-mean-square value and maximum difference of vibration accelerations are decreased by 27.1 % and 18.6 %. Compared with other two kinds of PSO algorithms, optimization effects of the root-mean-square value and maximum difference of vibration accelerations are very obvious.
Fig. 15Error iteration processes of three kinds of PSO algorithms
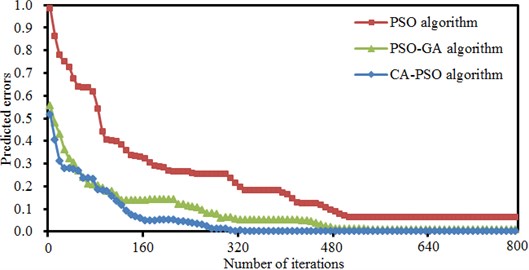
Fig. 16Population iteration processes of three PSO algorithms
a) PSO algorithm
b) PSO-GA algorithm
c) CA-PSO algorithm
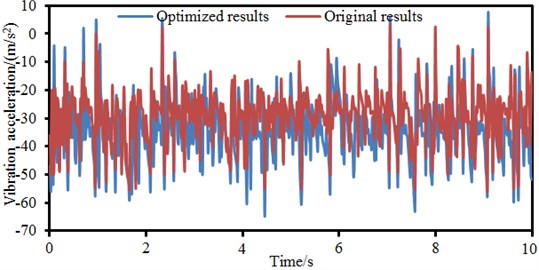
According to the optimized parameters, modeling is conducted on the bicycle again, and time-domain vibration accelerations are computed. Computational results are compared with original results, as shown in Fig. 17. It is shown in the figure that the optimized acceleration values are obviously better than those of the original structure at most time points. However, at some time points, the optimized accelerations are smaller than the original result. This is normal as the optimization objective in the paper is root-mean-square value and maximum difference of the vibration acceleration rather than vibration acceleration at each time point. In addition, the fatigue life of the optimized bicycle is also computed. The fatigue life of the original structure is 5 years while the fatigue life of the optimized bicycle is 7 years. Therefore, the fatigue life is improved obviously.
Fig. 17Comparison of vibration accelerations before and after optimization
5. Conclusions
The paper tries to optimize dynamics and fatigue characteristics of the bicycle through combining finite element model with advanced algorithms. The advanced algorithm applies ideas of cellular automation (CA) to Particle Swarm Optimization (PSO), and then a hybrid CA-PSO algorithm is proposed. The conclusion has been detailed as follows:
a) Damage forms of a material or structure under alternating forces are very different from those under static forces. Under the alternating force, even if the maximum stress of the material or structures is lower than the yield limit, the structure will suffer from sudden fractures at a moment under long-term repeated effects. Even a material with high plasticity does not have obvious macroscopic plastic deformation before the fracture. Therefore, it is necessary to apply real alternating forces as the excitation during studying dynamics and fatigue characteristics of bicycles.
b) The maximum stress of bicycles is mainly distributed on the frame, especially on joints of different round pipes of the frame at different moments mainly because that a dead corner is at the joint, and the dead corner can easily cause stress concentration and belongs to a dangerous region. Forces are uniform at the bicycle handlebar and tires and do not have obvious stress concentration phenomena. Under alternating forces, the stress concentration at joints will generate fatigue damage. Therefore, the service life of this position is the shortest.
c) The vibration response curves of the bicycle fluctuated very obviously; the maximum vibration acceleration responses are at the round pipe joints; the minimum vibration acceleration is at the bicycle handle; these distribution results are consistent with rules of stress and strain. In addition, it could be found that the vibration acceleration on the seat stay round pipe presents certain periodicity. Moreover, vibration accelerations basically have the consistent changing trends between the experimental test and the numerical simulation. Therefore, the numerical computation model established in the paper is feasible.
d) In order to verify the effectiveness of the CA-PSO algorithm proposed by the paper, the widely used PSO algorithm and PSO-GA algorithm are also used to optimize the bicycle. When the traditional PSO algorithm is used to optimize the bicycle, the root-mean-square value and maximum difference of accelerations are decreased by 11.9 % and 14.3 %, respectively. When the PSO-GA algorithm is used to optimize the bicycle, the root-mean-square value and maximum difference of accelerations are decreased by 20.3 % and 12.9 %. When the proposed CA-PSO algorithm in the paper is used to optimize the bicycle, the root-mean-square value and maximum difference of accelerations are decreased by 27.1 % and 18.6 %. Compared with other two kinds of PSO algorithms, optimization effects of the root-mean-square value and maximum difference of vibration accelerations are very obvious.
e) The optimized acceleration values are obviously better than those of the original structure at most time points. However, at some time points, the optimized accelerations are smaller than the original result. This is normal as the optimization objective in the paper is root-mean-square value and maximum difference of the vibration acceleration rather than vibration acceleration at each time point. In addition, the fatigue life of the original structure is 5 years, while the fatigue life of the optimized bicycle is 7 years. Therefore, the fatigue life is improved obviously.
References
-
Erdoğan G., Battarra M., Calvo R. W. An exact algorithm for the static rebalancing problem arising in bicycle sharing systems. European Journal of Operational Research, Vol. 245, Issue 3, 2015, p. 667-679.
-
Heinen E., Maat K., Van Wee B. The role of attitudes toward characteristics of bicycle commuting on the choice to cycle to work over various distances. Transportation Research Part D: Transport and Environment, Vol. 16, Issue 2, 2011, p. 102-109.
-
Gylling M., Heikkilä J., Jussila K., et al. Making decisions on offshore outsourcing and backshoring: A case study in the bicycle industry. International Journal of Production Economics, Vol. 162, 2015, p. 92-100.
-
Lathia N., Ahmed S., Capra L. Measuring the impact of opening the London shared bicycle scheme to casual users. Transportation Research Part C: Emerging Technologies, Vol. 22, 2012, p. 88-102.
-
Bröde P., De Bruyne G., Aerts J. M., et al. Head sweat rate prediction for thermal comfort assessment of bicycle helmets. Extreme Physiology and Medicine, Vol. 4, Issue 1, 2015, p. A85.
-
Bachand Marleau J., Lee B., El Geneidy A. Better understanding of factors influencing likelihood of using shared bicycle systems and frequency of use. Transportation Research Record: Journal of the Transportation Research Board, Vol. 2314, 2012, p. 66-71.
-
Ferrer Roca V., Roig A., Galilea P., et al. Influence of saddle height on lower limb kinematics in well-trained cyclists: static vs. dynamic evaluation in bicycle fitting. The Journal of Strength and Conditioning Research, Vol. 26, Issue 11, 2012, p. 3025-3029.
-
Han F. X., Zhao S. J., Zhang L., et al. Survey of strategies for switching off base stations in heterogeneous networks for greener 5G system. IEEE Access, Vol. 4, 2016, p. 4959-4973.
-
Chen C. H., Wu Y. K., Chan M. S., et al. The force output of handle and pedal in different bicycle-riding postures. Research in Sports Medicine, Vol. 24, Issue 1, 2016, p. 54-66.
-
Caya A., Champoux Y., Drouet J. M. Dynamic behaviour and measurement accuracy of a bicycle brake hood force transducer. Procedia Engineering, Vol. 34, 2012, p. 526-531.
-
Yang K., Yang N., Xing C. W., et al. Space-time network coding with transmit antenna selection and maximal-ratio combining. IEEE Transactions on Wireless Communications, Vol. 14, Issue 4, 2015, p. 2106-2117.
-
Yan X. Z. X. U. R. B. U., Xiaofan W. U. Optimal design of bicycle frame parameters considering biomechanics. Chinese Journal of Mechanical Engineering, Vol. 24, Issue 1, 2011, p. 1-5.
-
Du W. H., Zhang L., Zhang D. W. Dynamic characteristics study of electric bicycle vibration reduction frame. Proceedings of the 3rd International Conference on Computational Intelligence and Industrial Application, Vol. 9, 2010, p. 363-366.
-
Cai R., Chen L., He S. J., Jiang C. M., Li R. Analysis on the dynamic and simulation of road cycling. China Sport Science and Technology, Vol. 50, Issue 1, 2014, p. 125-128.
-
Chen R. X., Wang H. F. Bicycle frame analysis based on Adams and Ansys. Light Industry Machinery, Vol. 29, Issue 6, 2011, p. 18-24.
-
Feng Z. X., Wu X. L., Wang J. J. Ergonomic design of new exercise bicycle frame based on stress analysis. Machinery Design and Manufacture, Vol. 2, 2016, p. 127-130.
-
Alizadeh R. A dynamic cellular automaton model for evacuation process with obstacles. Safety Science, Vol. 49, Issue 2, 2011, p. 315-323.
-
Guan D. J., Li H. F., Inohae T., et al. Modeling urban land use change by the integration of cellular automaton and Markov model. Ecological Modelling, Vol. 222, Issue 20, 2011, p. 3761-3772.
-
Hoekstra A., Kroc J., Sloot P. Introduction to modeling of complex systems using cellular automata. Simulating Complex Systems by Cellular Automata, 2010, https://doi.org/10.1007/978-3-642-12203-3_1.
-
Zheng Y., Jia B., Li X. G., et al. Evacuation dynamics with fire spreading based on cellular automaton. Physica A: Statistical Mechanics and its Applications, Vol. 390, Issue 18, 2011, p. 3147-3156.
-
Wang Y., Lv J., Zhu L., et al. Crystal structure prediction via particle-swarm optimization. Physical Review B, Vol. 82, 2010, p. 9-94116.
-
Kulkarni R. V., Venayagamoorthy G. K. Particle swarm optimization in wireless-sensor networks: a brief survey. IEEE Transactions on Systems, Man, and Cybernetics, Part C, Applications and Reviews, Vol. 41, Issue 2, 2011, p. 262-267.
-
Ding G., Tan Z., Wu J., et al. Indoor fingerprinting localization and tracking system using particle swarm optimization and Kalman filter. IEICE Transactions on Communications, Vol. 98, Issue 3, 2015, p. 502-514.
-
Rini D. P., Shamsuddin S. M., Yuhaniz S. S. Particle swarm optimization: technique, system and challenges. International Journal of Computer Applications, Vol. 14, Issue 1, 2011, p. 19-26.
-
Xiao P., Wu J. S., Cowan C. F. N. MIMO detection schemes with interference and noise estimation enhancement. IEEE Transactions on Communications, Vol. 59, Issue 1, 2011, p. 26-32.
-
Hu H. G., Wu J. S. New constructions of codebooks nearly meeting the Welch bound with equality. IEEE Transactions on Information Theory, Vol. 60, Issue 2, 2014, p. 1348-1355.
About this article

