Abstract
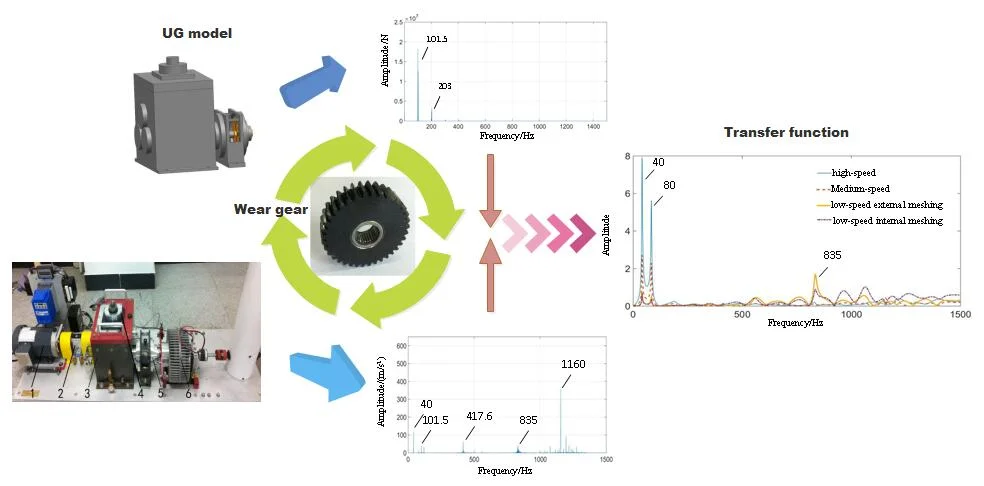
Gear tooth surface wear is a common failure mode. It takes a long time and can cause other major faults. The wear fault signal is weak and hard to identify. This paper reveals the transmission characteristics of the planetary gear wear and the relationship between multistage gear meshing through the transmission characteristic analysis. Taking the multistage gear transmission system fault simulation test rig as the research object, a three-dimensional solid rigid-flexible coupling model of the system was established. The contact force signals from each pair of gears in the state of planetary gear wear were obtained by dynamic simulation. The test signals of the fixed-axis gearbox and planetary gearbox were obtained under normal and planetary gear wear states. Comparing the transmission characteristics of the system under normal and planetary gear wear states, the vibration mechanism of the wear fault and the correlative characteristic between gearboxes were revealed.
Highlights
- According to the method of system identification, the transfer function models corresponding to each path were established.
- The signal transmission process was revealed, and the associated fault characteristics and fault transfer characteristics between gears under the wear fault state were obtained.
- By using the transfer function method, the source of the unknown correlated fault characteristics is explored, which provides a theoretical basis for the fault diagnosis of multistage gear system.
1. Introduction
Gear tooth surface wear is a common failure mode. It takes a long time and can cause other major faults. The wear fault signal is weak and hard to identify. In multistage gear transmission system, the signal of planetary gear is often weaker than that of fixed-axis gear because of the complex signal components. Therefore, planetary gear wear fault is more difficult to identify. It is also difficult to trace the source of some unknown frequency components in complex test signals. From the perspective of transmission characteristic, the source and contribution of each frequency component of the test signal can be studied. The vibration mechanism and transmission mechanism of the planetary gear wear fault in multistage gear transmission system can be explored fundamentally.
Transfer path analysis (TPA) is the most common method to diagnose the vibration and noise of mechanical systems at present [1]. A TPA concerns a product's actively vibrating components (such as engines, gearing systems or turbochargers) and the transmission of these vibrations to the connected passive structures. TPA is particularly useful when the actual vibrating mechanisms are too complex to model or measure directly, as it allows us to represent a source by forces and vibrations displayed at the interfaces with the passive side. In this way, the source excitations can be separated from the structural/acoustic transfer characteristics, allowing us to troubleshoot the dominant paths of vibration transmission. The engineer can then anticipate by making changes to either the source itself or the receiving structures that are connected to it [2]. With the continuous development of TPA methods, a large number of TPA family members have been proposed in literature. It mainly includes the Operational TPA (OPA) [3-5], OPAX [6], Component-based TPA [7-9] and Global Transfer Direct Transfer (GTDT) method [10-12].
TPA is widely used in such fields as vehicles, high-speed trains and ships. The application of gear transmission system is still in its initial stage, and the current research focus is mainly on planetary gearboxes. Liu [13] proposed a comprehensive vibration signal model for a planetary gear set considering all the vibration sources and transmission path effects. Lei [14] constructed the vibration simulation models of the planetary gearboxes by analyzing the transmission paths of each meshing vibration. Huang [15] used a finite element model and MATLAB curve fitting toolbox to establish the mathematical model of the transmission path change law of planetary gearbox. Xu [16, 17] studied the influence of measuring points on the transmission path under crack and missing tooth fault of planet gear respectively. Chen [18] studied the propagation path and failure behavior of cracked gears at different initial angles.
For a multistage gear transmission system including both fixed-axis gears and a planetary gear train, multistage gear meshing and multiple transmission paths will interact with each other. When a fault occurs in one stage of meshing, it will appear in the form of other meshing frequencies in the power spectrum [19, 20]. Therefore, fault characteristics and transmission characteristics of a multistage gear transmission system should be studied specifically.
In this paper, the amplitude-frequency response curves of the transfer functions that of the meshing exciting forces transmitted to the planetary gearbox and the fixed-axis gearbox under the normal and the planetary gear wear states were calculated by combining simulation and experiment methods to find out the fault characteristics and associated characteristics of the planetary gear wear.
2. Dynamic model of multistage gear transmission system
2.1. Fault simulation test rig of a multistage gear transmission system
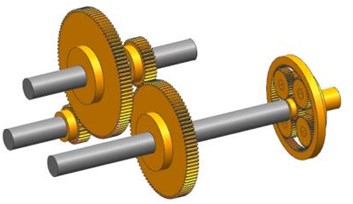
The multistage gear transmission system fault simulation test rig is taken as the research object, shown in Fig. 1. The vibration characteristic analysis and the transmission characteristic analysis are carried out.
As can be seen from Fig. 1, there are two gearboxes in the gear transmission system test rig. They are the fixed-axis gearbox made up of two-stage fixed-axis gears and the planetary gearbox made up of one-stage planetary gear train. The system structure diagram is shown in Fig. 2, where, is the input torque, driven by three-phase AC asynchronous motor; is the output torque, which can be set through the electromagnetic powder brake; gears 1 and 2 form the high-speed gear pair; gear 1 is the high-speed driving gear; gear 2 is the high-speed driven gear; gears 3 and 4 are the medium-speed driving gear and driven gear respectively; the planetary gear train is the low-speed stage, is the planetary gear, is the sun gear, is the planet carrier, and is the ring gear (fixed). The gears in the test rig are all involute cylindrical spur gears with pressure angle of 20°. Gear parameters are shown in Table 1.
Fig. 1Fault simulation test rig of a multistage gear transmission system: 1 – motor, 2 – torque sensor and encoder, 3 – two stage fixed-axis gearbox, 4 – radial load of bearing, 5 – one stage planetary gearbox, 6 – brake
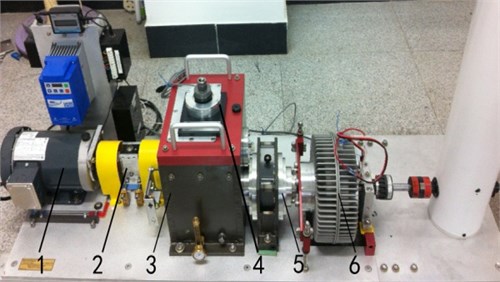
Fig. 2Structural diagram of the gear transmission system test rig
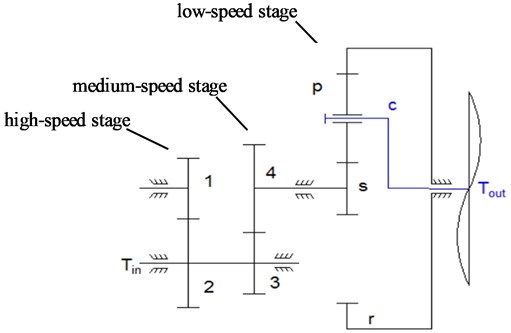
Table 1Gear parameters
Gear | Number of tooth | Mass / g | Rotational inertia / (g∙m2) | Face width / mm | Module / mm |
1 | 29 | 125 | 0.05 | 30 | 1.5 |
2 | 100 | 1224.5 | 6 | 30 | 1.5 |
3 | 36 | 224 | 0.14 | 30 | 1.5 |
4 | 90 | 1111 | 4 | 20 | 1.5 |
28 | 41 | 0.007 | 20 | 1.0 | |
36 | 34.6 | 0.01 | 20 | 1.0 | |
– | 848.7 | 0.76 | 20 | 1.0 | |
100 | – | – | 20 | 1.0 |
2.2. Dynamic model of gearboxes
Taking the fault simulation test rig of the multistage gear transmission system as the prototype, the corresponding UG 3D solid model was established. The gear, axis, box and other components were built, and gearboxes were integrally assembled by applying constraint relations. The assembled body and its internal structure are shown in Fig. 3.
The UG model was imported into ADAMS for dynamic simulation. According to the motion mode, the corresponding motion constraints, drive and load were added to the gear box. Contact forces were applied between meshing gears to simulate their meshing relations. Contact forces were set by stiffness, force exponent, damping, and penetration depth.
Fig. 3Multistage gear transmission system test rig solid model: a) assembled body, and b) internal structure
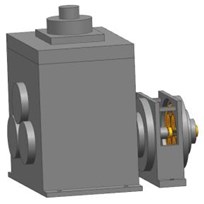
a)
b)
Contact stiffness is affected by the material properties and the contact surface shape. The calculation formula is as follows:
where, , are the curvature radiuses of meshing tooth profile. Since the curvature radius of involute gear meshing point changes in the meshing process. The calculation point is taken as: , 1, 2; and are material parameters, , 1, 2; and are the Poisson’s ratio and elastic modulus of the material, respectively.
According to the equivalent energy loss, the damping formula is as follows:
where, is the elastic recovery coefficient, whose value is usually determined by experiments; is the penetration depth; is the nonlinear exponential; is the collision velocity.
Force exponent and penetration depth can be selected from the system default values first.
Considering nonlinear characteristics of the gearboxes, the fixed axis gearbox and the planetary gearbox were softened [21, 22] to obtain more real gear dynamics characteristics.
The contact forces of the meshing parts of fixed-axis gears and planetary gears were calculated by ADAMS. The simulation results were compared with the results of dynamic differential equations and experimental data, so as to modify some of the set parameters after softening. The final settings are shown in Fig. 4.
3. Analysis of dynamic excitation signals of gear meshing
The gear contact force can fully reflect dynamic response characteristics of the gear meshing process, and contribute to the qualitative analysis of system dynamic characteristics and fault characteristics under fault state. Using the model in Fig. 3, dynamic simulation was set up and the dynamic equations of gearboxes during running process were established. Solve the contact force signals under normal and planetary gear wear states. The motor rotation frequency is 40 Hz. Load torque of 300000 N/mm was applied to the planet carrier. Both the drive torque and the load torque reach the established values in form of STEP function within 0.01 s. Characteristic frequency parameters of gears at all stages in the test rig are shown in Table 2.
Fig. 4Gear meshing contact force parameter setting of rigid-flexible coupling system: a) fixed-axis gear, b) planetary gear
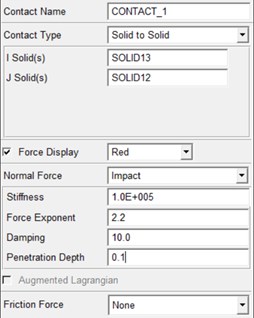
a)
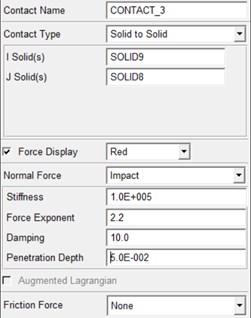
b)
Table 2Main frequency parameters
Characteristic frequency | Computational formula | Value |
High-speed meshing frequency | 1160 Hz | |
Medium-speed meshing frequency | 417.6 Hz | |
Sun gear rotation frequency | 4.64Hz | |
Planet carrier rotation frequency | 1.015Hz | |
Low-speed (planetary) meshing frequency | 101.5 Hz | |
High-speed gear failure characteristic frequency | 40 Hz | |
Planetary failure characteristic frequency | 2.819 Hz |
3.1. Analysis of gear contact force signals under normal state
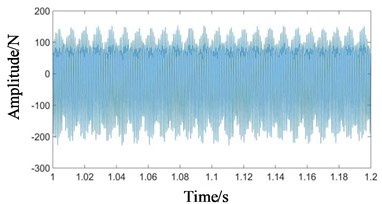
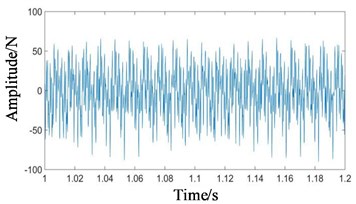
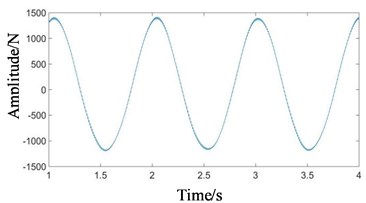
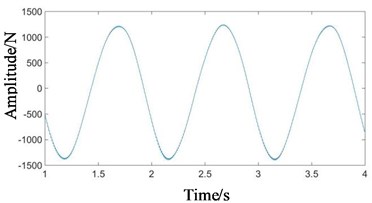
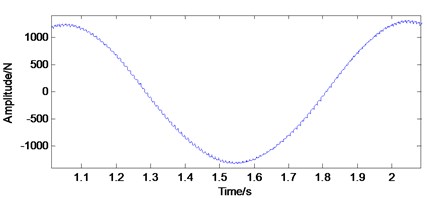
The dynamic simulation of the system under normal state was carried out. The contact force simulation signals of high-speed, medium-speed and low-speed external meshing (planetary gear meshing with sun gear) and low-speed internal meshing (planetary gear meshing with ring gear) were extracted respectively, as shown in Fig. 5.
As can be seen from Figs. 5(a) and (b), the waveforms of high-speed and medium-speed signals are relatively dense, mainly composed of high frequency component. In Figs. 5(c) and (d), the amplitude of low-speed contact force signal is large. Since the positions of meshing points of low-speed external meshing and low-speed internal meshing change with the rotation of the planet carrier, vibration transfer paths between meshing points and boxes are changed. The passing effect of planetary gear will cause the amplitude modulation of meshing vibration. The planet carrier rotation frequency (1.015 Hz) is the modulation frequency. The small fluctuation in Fig. 5(e) is the low-speed meshing frequency (101.5 Hz).
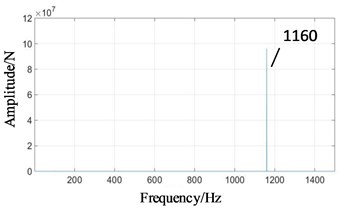
In order to observe the frequency components and the proportion of signals, the power spectrum corresponding to each time domain signal was obtained, as shown in Fig. 6.
In high-speed signal in Fig. 6(a), the vibration frequency is dominated by high-speed meshing frequency (1160 Hz). Medium-speed meshing frequency (417.6 Hz) and low-speed meshing frequency (101.5 Hz) are relatively weak and hardly visible.
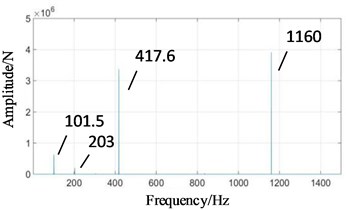
In medium-speed signal in Fig. 6(b), in addition to medium-speed meshing frequency (417.6 Hz), there are also high-speed meshing frequency (1160 Hz), low-speed meshing frequency (101.5 Hz) and its twice (203 Hz). It shows the correlation between various gear signals.
Fig. 5Time domains of gear contact force simulation signal under normal state: a) high-speed, b) medium-speed, c) low-speed external meshing, d) low-speed internal meshing, e) low-speed external meshing magnification
a)
b)
c)
d)
e)
Fig. 6Frequency domains of gear contact force simulation signal under normal state: a) high-speed, b) medium-speed, c) low-speed external meshing, d) low-speed internal meshing
a)
b)
c)
d)
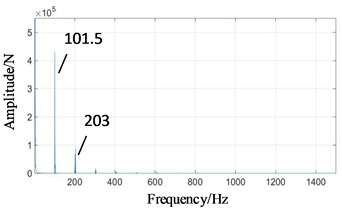
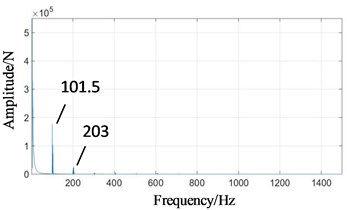
In Figs. 6(c) and (d), high-speed meshing frequency (1160 Hz) and medium-speed meshing frequency (417.6 Hz) attenuate obviously. The planet carrier rotation frequency (1.015 Hz) has the highest amplitude, followed by the frequency components are mainly low-speed meshing frequency (101.5 Hz) and its higher order harmonics (, , ...). The response frequency amplitude of low-speed external meshing in Fig. 6(c) is larger than that of low-speed internal meshing in Fig. 6(d).
The above time domain and frequency domain charts conform to the basic law of the gear vibration and verify the correctness of the model.
3.2. Analysis of gear contact force signals under planetary gear wear state
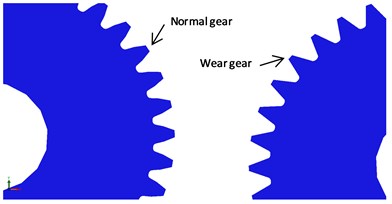
The gear thickness of the test rig was measured by the gear thickness measuring instrument. The thickness at the gear node was measured to be 1.3 mm, which was 0.2 mm less than before, that is, the wear loss was 0.2 mm. When gear wear exceeds 20 %, it needs to be replaced. By comparing the wear degree standard in Table 3, it can be seen that the degree of wear gear on the test rig is medium wear.
Table 3Wear degree standard
Classification standard | Wear loss /mm |
Normal wear | 0.1 |
Medium wear | 0.1-0.3 |
Severe wear | 0.3 |
In the simulation model, one planetary gear of the low-speed stage was set to wear. The degree of wear was consistent with the wear gear in the test rig (wear loss 0.1 mm on both sides), as shown in Fig. 7. Fig. 7(a) shows the actual gear with wear, and Fig. 7(b) shows the corresponding simulation gear model with wear.
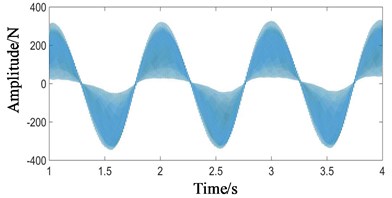
It is found that the planetary gear wear has an important influence on the low-speed internal and external meshing signals. Since the fault characteristics of the two are similar, only the low-speed external meshing signal was listed for illustration, as shown in Fig. 8.
Fig. 7Wear gear: a) actual gear with wear, b) simulation gear model with wear

a)
b)
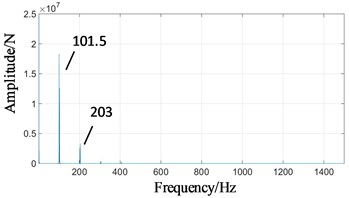
Fig. 8Gear contact force simulation signal under the state of planetary gear wear: a) low-speed external meshing time domain, b) low-speed external meshing frequency domain
a)
b)
As shown in Fig. 8(a), the vibration range of low-speed signal in time domain decreases from ±1400 N to ±400 N. The fluctuation of low-speed meshing frequency (101.5 hz) increases. In the frequency domain, comparing Fig. 6(c) with Fig. 8(b), the low-speed meshing frequency (101.5 Hz) increases from 4.3×10⁵ N to 1.8×10⁷ N, and its harmonic components ( 1, 2, ...) also increases.
4. Test signal analysis and transfer function calculation of test rig
4.1. Test signal characteristics under normal state
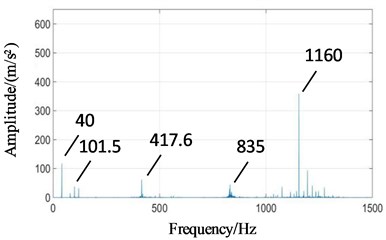
The acceleration response signals on the surface of gearboxes under normal state were measured, in which the input axis frequency was 40 Hz, the output axis was loaded with 10 V, and the sensitivity of acceleration sensor was 100.2 mv/g. Considering the difference of collected signals on different boxes, the acceleration vibration response signals of fixed-axis gearbox and planetary gearbox in horizontal direction were measured separately. The test results of two boxes on the surface under normal state are shown in Fig. 9.
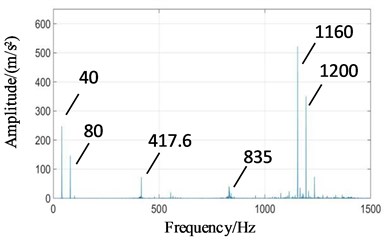
It can be seen from Fig. 9 that the main frequency components of two boxes in normal state are high-speed meshing frequency (1160 Hz), high-speed axis frequency (40 Hz), medium-speed meshing frequency (417.6 Hz) and its twice (835 Hz), low-speed meshing frequency (101.5 Hz), etc.
Affected by distance, the signal intensities of two boxes are different. In Fig. 9(a), high-speed axis frequency (40 Hz) and high-speed meshing frequency (1160 Hz) are significantly weakened because of far away from high-speed stage. The amplitude of low-speed meshing frequency (101.5 Hz) is enhanced.
Fig. 9Power spectrum signals of the test rig under normal state: a) planetary gearbox, b) fixed axis gearbox
a)
b)
4.2. Transfer function of each transfer path under normal state
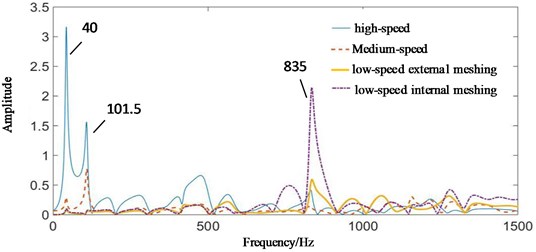
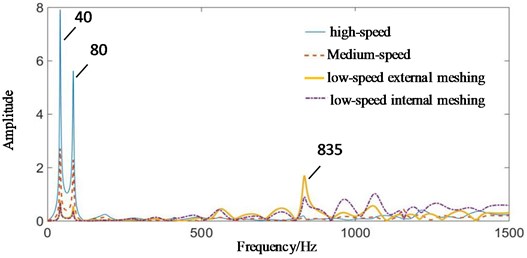
The vibration transfer path system model of multistage gear transmission system is established by system identification method. Take the four contact forces in Fig. 6 as the input excitation forces, and the test signals on the surface of gearboxes in Fig. 9 as the output. The auto-regressive exogenous (ARX) model with multi-point input and single point output and Tustin inverse transformation were used to solve the problem. The amplitude-frequency response curves of transfer functions of meshing excitation forces transmitted to fixed-axis gearbox and planetary gearbox under normal state are shown in Fig. 10.
In Fig. 10, 40 Hz has the highest amplitude, and the frequency is high-speed axis frequency. Therefore, high-speed stage contact force has the greatest contribution to the frequency. Medium-speed and low-speed stage also has some contributions. Meshing frequencies of , and are not obvious. But (835 Hz) is obvious, which is the contribution of low-speed internal and external meshing process [23].
Fig. 10The amplitude-frequency response curve of transfer function of each transfer path under normal state: a) contact force is transmitted to planetary gearbox, b) contact force is transmitted to fixed axis gearbox
a)
b)
In Fig. 10(a), planetary gearbox is far away from high-speed stage, signal intensity of high-speed stage is weakened, and low-speed signal is enhanced. The amplitude of high-speed axis rotation frequency (40 Hz) decreases. The frequency characteristic of low-speed meshing frequency (101.5 Hz) increases. Low-speed internal and external meshing also causes a large value of (835 Hz).
4.3. Test signal characteristics of planetary gear wear
A normal planetary gear was replaced with a worn planetary gear in Fig. 7(a). Test signals of two boxes are shown in Fig. 11.
Fig. 11Power spectrum signals of the test rig under planetary gear wear: a) planetary gearbox, b) fixed axis gearbox
a)
b)
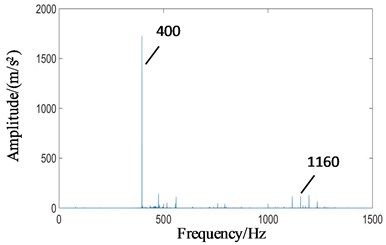
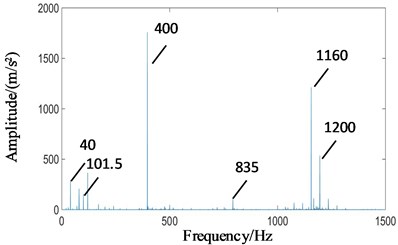
As shown in Fig. 11(a), under the state of planetary gear wear, the amplitude of 400 Hz is increased remarkably, which is much higher than other frequency components in the spectrum. Due to the weak signal of the planet gears, the peak of the planet gear meshing frequency in the low frequency part is not obvious. In Fig. 11(b), the amplitude of 400 Hz under the state of planetary gear wear is also affected by the connection of the planetary gearbox, which is much higher than other frequency components. Because the signal of the fixed axis gearbox is strong, the other frequency components are clear. It can be seen that the wear fault of planetary gear caused the amplitude of 400 Hz to rise, and transmitted the characteristic to the fixed axis gear.
4.4. Transfer function of each transfer path under the state of planetary gear wear
Taking the contact force signals of high-speed and medium-speed in Fig. 6 and low speed under planetary gear wear state in Fig. 8(b) as the input excitation forces. Taking the test fault signals on the surface of the gearbox in Fig. 11 as the output. The amplitude-frequency response curves of transfer functions of meshing excitation forces transmitted to fixed-axis gearbox and planetary gearbox under planetary gear wear state are shown in Fig. 12.
Fig. 12The amplitude-frequency response curve of transfer function of each transfer path under planetary gear wear: a) contact force is transmitted to the planetary gearbox, b) contact force is transmitted to the fixed axis gearbox
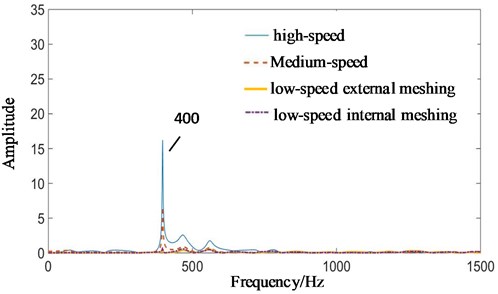
a)
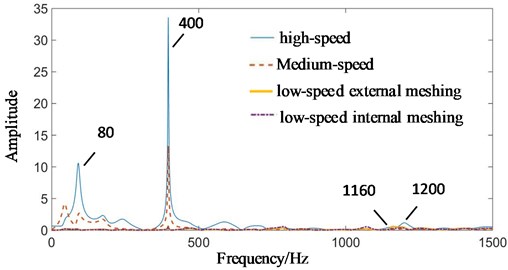
b)
Overall, whether it is the planetary gearbox or the fixed-axis gearbox, the signal is enhanced around 400 Hz. At other frequencies, there is a significant weakening that causes other frequency components in the planetary gearbox to be invisible. The 400 Hz frequency component is neither the meshing frequency of the system nor the fault frequency of the planetary gear, so it is necessary to explore its source.
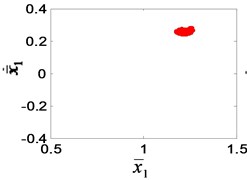
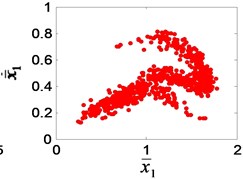
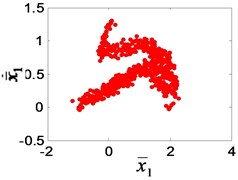
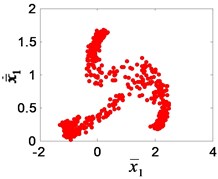
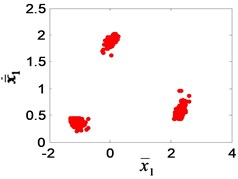
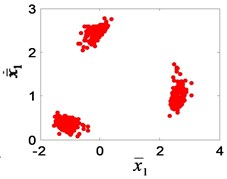
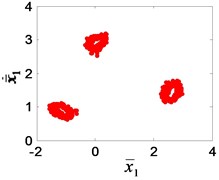
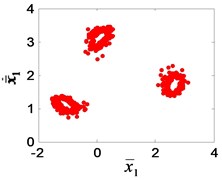
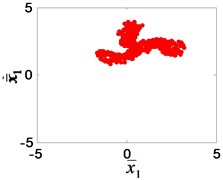
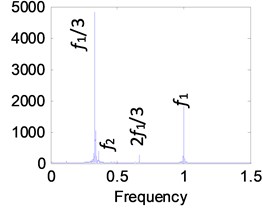
In the author’s study of the nonlinear dynamics of the system [24], it was found that the bifurcation characteristics of the system will change when the gear clearance changes, as showed in Fig. 13. According to Chinese national standard GB 2363-90, the calculating formulas of side clearance in engineering application can be obtained. After calculating, the available interval of dimensionless clearance for meshing gear is [0.1, 1], corresponding to 0-20 % gear wear. When increases gradually in the interval [0.1, 1], the single-period motion (Fig. 13(a)) change into a three-period motion (Fig. 13(e)), and then 1/3 sub-harmonic resonance occurs. The sub-harmonic resonance frequency (1160/3 Hz) appears in the test signal. It can be seen that the condition of resonance is that the dimensionless clearance is greater than 0.5, that is, the wear loss is greater than 0.167 mm.
As can be seen from Fig. 14, the amplitude of has exceeded all the peaks when resonance occurs. The sub-harmonic resonance frequency is related to the high speed stage, so it comes from the high speed stage. In Fig. 12, the wear failure causes the gear tooth clearance to increase, and the wear loss of 0.2 mm is close to 0.6 in the simulation, which is in the sub-harmonic resonance range. Therefore, the amplitude of 400 Hz is the highest, and the contribution of high-speed stage is the largest. This conclusion is consistent with the author's nonlinear research results.
417.6 Hz is the meshing frequency of the medium-speed gear, which resonates with . Therefore, the medium-speed stage in Fig. 12 also contributes to this frequency.
400 Hz mainly comes from the high speed sub-harmonic resonance, followed by the medium speed meshing frequency. From the amplitude, we can see that the amplitude of 400 Hz in Fig. 12(b) is larger than that in Fig. 12(a).
Fig. 13The Poincaré section of the high-speed gear meshing point: a) e¯ai= 0.1, b) e¯ai= 0.2, c) e¯ai= 0.3, d) e¯ai= 0.4, e) e¯ai= 0.5, f) e¯ai= 0.6, g) e¯ai= 0.8, h) e¯ai= 0.9, i) e¯ai= 1
a)
b)
c)
d)
e)
f)
g)
h)
i)
It can be seen that the sub-harmonic resonance is caused by the wear of the planetary gear, but the frequency is related to the meshing frequency of the high-speed stage, so it is produced by the high-speed stage and transmitted to the planetary gearbox.
Fig. 14High-speed spectrum at e¯ai= 0.6
In order to verify the correctness of the results obtained in this paper, the research results of other scholars are compared with those of this paper. Feng [25, 26] has the same test-bed as this paper. In the spectrum of their experimental signals, it is found that wear faults cause a sharp increase in the third harmonic amplitude, which is not found in other faults. We know that the occurrence of sub-harmonic resonance mostly comes from rotor rub, and the main characteristics of rotor rub are that the frequency includes second-harmonic, third-harmonic and 1/2-harmonic and 1/3-harmonic components. It is also proposed in paper [27] that rotor rub excites forward and backward whirling frequency components almost equally. Therefore, in Feng’s experimental signals, 1/3 sub-harmonic resonance characteristics are reflected in the third harmonic. They only mentioned that the higher order harmonics increase in amplitude, but they do not explain why the third harmonic far exceeds the others. The results of this study are similar to those of Feng’s and explain the unspecified parts of his research results from the point of view of non-linearity. It shows that the results of this study have common characteristics.
5. Conclusions
The transmission path analysis method is used to explore the transmission relationship of the fault signal and solve the problem that the fault signal of planetary gear is weak and difficult to be recognized in the multi-gear transmission system, so as to enhance and better extract the fault signal of planetary gear. In this study, the fault simulation test rig of the multistage gear transmission system was taken as the research object. The three-dimensional solid rigid-flexible coupling model of the system was established. According to the method of system identification, the transfer function models corresponding to each path were established. The signal transmission process was revealed through the transmission characteristic analysis, and the associated fault characteristics and fault transfer characteristics between gears under the wear fault state were obtained. It is found that the wear failure of planetary gear causes a sharp increase of 400 Hz amplitude, which makes 400 Hz the main vibration of the planetary gearbox and the fixed axis gearbox. According to the analysis of the transfer function, it is found that the main contribution comes from the high-speed stage. Nonlinear dynamic analysis shows that when the wear loss is greater than 0.167 mm, the high-speed 1/3 sub-harmonic resonance will occur. The resonance frequency is close to the medium-speed meshing frequency , and after coupling modulation, the 400 Hz frequency amplitude is much larger than other frequencies. The method of transfer function can be used to explore the source of unknown associated fault characteristics, which can provide a theoretical basis for multistage gear system fault diagnosis. The results obtained by the transfer path method provide a new solution to the problem that the fault characteristics of planetary gears are weak and difficult to identify, and provide theoretical guidance for the fault diagnosis programming of planetary gears.
References
-
Guo R., Qiu S., Fang H. Q., Yu Q. L., Zhang T. Advance in studying on transfer path analysis methods in frequency domain. Journal of Vibration and Shock, Vol. 32, Issue 13, 2013, p. 49-55.
-
Maarten V. V., Dennis D. K., Daniel J. R. General framework for transfer path analysis: History, theory and classification of techniques. Mechanical Systems and Signal Processing, Vol. 68, Issue 69, 2016, p. 217-244.
-
De Klerk D., Ossipov A. Operational transfer path analysis: theory, guidelines and tire noise application. Mechanical Systems and Signal Processing, Vol. 24, Issue 7, 2010, p. 1950-1962.
-
De Sitter G., Devriendt C., Guillaume P., Pruyt E. Operational transfer path analysis. Mechanical Systems and Signal Processing, Vol. 24, Issue 2, 2010, p. 416-431.
-
Roozen N. B., Leclère Q. On the use of artificial excitation in operational transfer path analysis. Applied Acoustics, Vol. 74, 2013, p. 1167-1174.
-
Janssens K., Gajdatsy P., Gielen L., Mas P., Britte L., Desmet W., et al. OPAX: a new transfer path analysis method based on parametric load models. Mechanical Systems and Signal Processing, Vol. 25, 2011, p. 1321-1338.
-
Elliott A. S., Moorhouse A. T., Huntley T., Tate S. In-situ source path contribution analysis of structure borne road noise. Journal of Sound and Vibration, Vol. 332, 2013, p. 6276-6295.
-
Rixen D. J., Boogaard A., Van Der Seijs M. V., Van Schothorst G., Van Der Poel T. Vibration source description in substructuring: a theoretical depiction. Mechanical Systems and Signal Processing, Vol. 60, Issue 61, 2015, p. 498-511.
-
De Klerk D., Rixen D. J. Component transfer path analysis method with compensation for test bench dynamics. Mechanical Systems and Signal Processing, Vol. 24, 2010, p. 1693-1710.
-
Guasch O. Direct transfer functions and path blocking in a discrete mechanical system. Journal of Sound and Vibration, Vol. 321, 2009, p. 854-874.
-
Wang Z. W., Zhu P., Zhao J. X. Response prediction techniques and case studies of a path blocking system based on global transmissibility direct transmissibility method. Journal of Sound and Vibration, Vol. 388, 2017, p. 363-388.
-
Magrans F. X., Poblet-Puig J., Rodríguez-Ferran A. The solution of linear mechanical systems in terms of path superposition. Mechanical Systems and Signal Processing, Vol. 85, 2017, p. 111-125.
-
Liu L. B., Liang X. H., Zuo M. J. Vibration signal modeling of a planetary gear set with transmission path effect analysis. Measurement, Vol. 85, 2016, p. 20-31.
-
Lei Y. G., Tang W., Kong D. T., Lin J. Vibration signal simulation and fault diagnosis of planetary gearboxes based on transmission mechanism analysis. Journal of Mechanical Engineering, Vol. 50, Issue 17, 2014, p. 61-68.
-
Huang Y. H., He G. L., Zeng Z. J. Transfer path analysis of meshing vibration signal of planetary gear sets. Journal of Chongqing University of Technology (Natural Science), Vol. 29, Issue 6, 2015, p. 37-40.
-
Xu Y. X., Zhao X. F., Xiong Y. Q. Gear crack fault identification for multi-stage gearbox based on signal propagation path. Chinese Journal of Scientific Instrument, Vol. 37, Issue 5, 2016, p. 1018-1024.
-
Xiong Y. Q., Xu Y. X. Identification of planetary gear tooth missing fault based on signal propagation model. Chinese Journal of Scientific Instrument, Vol. 37, Issue 2, 2016, p. 249-255.
-
Chen Y. X., Jin Y., Liang X. H., Kang R. Propagation path and failure behavior analysis of cracked gears under different initial angles. Mechanical Systems and Signal Processing, Vol. 110, 2018, p. 90-109.
-
Pattabiraman T. R., Srinivasan K., Malarmohan K. Assessment of sideband energy ratio technique in detection of wind turbine gear defects. Case Studies in Mechanical Systems and Signal Processing, Vol. 2, 2015, p. 1-11.
-
Cooley C. G., Parker R. G. The geometry and frequency content of planetary gear single-mode vibration. Mechanical Systems and Signal Processing, Vol. 40, Issue 1, 2013, p. 91-104.
-
Ma X. G., Yang W., You X. M., Chen C. G., Zhang F. Multi-body dynamical analysis on rigid-flexible coupling for planetary gear system. Chinese Journal of Construction Machinery, Vol. 7, Issue 2, 2009, p. 146-152.
-
He Y. L., Huang W., Li C. W., Du J., Hou H. C. Flexible multibody dynamics modeling and simulation analysis of large-scale wind turbine drivetrain. Journal of Mechanical Engineering, Vol. 50, Issue 1, 2014, p. 61-69.
-
Yang Y., Chu Z. G., Xiong M. Transfer path analysis of booming noise in a car cabin based on impedance matrix method. Journal of Vibration and Shock, Vol. 33, Issue 18, 2014, p. 164-169+176.
-
Wang X. Stability research of multistage gear transmission system with crack fault. Journal of Sound and Vibration, Vol. 434, 2018, p. 63-77.
-
Feng Z. P., Liang M. Complex signal analysis for wind turbine planetary gearbox fault diagnosis via iterative atomic decomposition thresholding. Journal of Sound and Vibration, Vol. 333, 2014, p. 5196-5211.
-
Feng Z. P., Chen X. W., Liang M. Joint envelope and frequency order spectrum analysis based on iterative generalized demodulation fir planetary gearbox fault diagnosis under nonstationary conditions. Mechanical Systems and Signal Processing, Vol. 76, Issue 77, 2016, p. 242-264.
-
Patel T. H., Darpe A. K. Vibration response of a cracked rotor in presence of rotor-stator rub. Journal of Sound and Vibration, Vol. 317, Issues 3-5, 2008, p. 841-865.
Cited by
About this article

This research is supported by the Special Scientific Research Plan of Shaanxi Provincial Department of Education (17JK0048).
