Abstract
Bearings are one of the most crucial elements in rotating machine. The condition of bearings decides the operation of machine. Consequently, it is necessary to study the assessment of bearing degradation in order to develop condition-based maintenance. This paper improves an indicator based on entropy which is calculated by wavelet packet decomposition and auto-regressive model. By introducing time parameter, the indicator solves the problem of instability in the initial stage of operation and it is less influenced by the operational conditions. Then, fuzzy c-means clustering can evaluate the process of degradation. Moreover, it can provide the threshold adaptively and help to repair by unit replacement. To ensure the applicability, the data of this paper comes from two laboratories, FEMTO-ST Institute and Intelligent Maintenance System Center. The result indicates that the method is effective to assess bearing degradation process.
Highlights
- A new degradation index is proposed.
- Fuzzy c-means clustering is used to divide stages.
- The model can be used in different operational conditions.
1. Introduction
Bearings play a significant part in most rotating machinery as a crucial component of manufacturing industry. The failure of bearings will lead to downtime and economic loss in industrial production [1]. So, the real-time monitoring and prediction of bearing degradation will help the condition-based maintenance (CBM) [2, 3].
At present, most approaches for bearing degradation assessment is based on the vibration signals. Researchers have proposed lots of methods to get the indicators from signals mainly including time domain, frequency domain and time-frequency domain analysis [4]. Fourier transform is an elementary method to turn the time domain into frequency domain. Some indicators of both are widely used to express the features of bearings, such as Root Mean Square (RMS), energy, kurtosis, skewness, mean frequency, frequency center and so on [5]. Only time domain or frequency domain cannot show the non-stationary signals completely. The time-frequency domain solves the problem by reflecting the frequency changing according to time. Short-time Fourier transform (STFT) [6], Wavelet transform (WT) [7] and Hilbert-Huang transform (HHT) [8] are typical methods to get the time-frequency. STFT does not have adaptive ability. WT is not accurate enough in high frequency. HHT will lead to end effect and Gibbs phenomenon [9]. To decrease the lack of the methods, some other ways were proposed. Auto-regressive (AR) model is usually used to estimate the spectrum [10]. It helps analyze short signals and reduce interference among signals. The methods above are unable to set up a single indicator to express bearing degradation process and will lead to abundant numerical computations in the assessment. Some researchers put up with entropy is an ideal indicator, but entropy cannot perform the initial degradation and may be influenced by operational condition a lot [11].
In addition to degradation feature extraction, estimating degradation condition is also an important part in CBM [12]. Researchers come up with some methods such as Artificial Neural Network (ANN) [13], Hidden Markov Model (HMM) [14], Support Vector Machine (SVM) [15], Gaussian mixture model (GMM) [16] etc. These methods are always combined with multi-data and will be a burden with the amount of data increasing. Besides, they are not good at processing single dimensional data. Fuzzy c-means clustering can deal with both single dimensional data and multidimensional data. Its algorithm is efficient, accurate and usable [7].
This paper uses wavelet packet decomposition, AR model and entropy with time parameter to perform the process of degradation. Then, fuzzy c-means clustering method will help to evaluate the degradation state and warn the failure of bearings.
2. Technical background
2.1. Wavelet packet decomposition
Wavelet packet decomposition is also called subband tree or optimal subband tree structuring. It uses parse tree to indicate wavelet packet. Wavelet transform is a popular method to process non-stationary signals [17, 18]. Comparing with short time Fourier transform, it can reduce computations when examining specific frequencies and giving a flexible time-frequency domain feature because of the use of variable sized windows. However, wavelet transform only decomposes low frequency signals and that leads to reduction of time-frequency resolution with the increase of frequency. Wavelet packet decomposition solves the problem and has a better resolution in high frequency signals. Besides, it draws into the concept of optimal basis selection to select optimal basis function flexibly. The process of wavelet packet decomposition is as follows [19].
Assume that is scaling function and is wavelet function. The basic wavelet packet functions are defined as:
where and are the quadrature mirror filters.
For a discrete signal, the decomposition coefficients of wavelet packets can be computed iteratively by:
where denotes the wavelet coefficients at the level, subband and is the number of the wavelet coefficients.
Fig. 1An example of a three-level wavelet packet decomposition tree
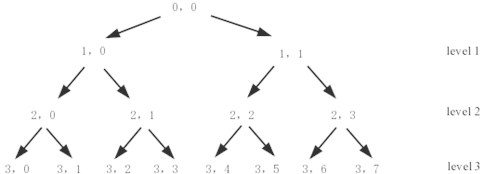
From Eqs. (2), (3), signals can be decomposed into level and the level will get part of signals by frequency. For example, a wavelet packet decomposition tree of three levels is illustrated in Fig. 1.
2.2. Auto regressive (AR) model spectrum
Auto regressive model is one of the most widely used and discussed parameter models. Auto regressive model spectrum consists of two steps. One is building AR model for time domain signals. The other is calculating the power spectrum by model coefficient [20]. The AR model is defined as:
where , …, are the parameters of the model, is a constant, and is white noise.
Eq. (3) can be regarded as an input or output equation to a system. Single side spectrum of signals can be calculated by transfer function:
where . In this paper, every subband will be reconstructed by AR model spectrum, and the details of subband can be more entire [21].
2.3. Entropy with time parameter
In information theory, entropy is the probability of discrete random evens and is sometimes referred to as Shannon entropy. In other words, the entropy increases as the certainty of variable increases and the information to understand will increase. Then, the signals of healthy bearing will provide orderly and steady information. When the bearing is running to failure, the system of bearing will be unsteady, and the signals will provide unordered and chaotic information. Entropy can perform the condition of information in the degradation process of bearing. It is a fine index to describe the degradation state. Entropy is defined as:
where is the probability of a discrete set [22].
From Eq. (5), the energy of every subband can be calculated. If the energy of subband is , is defined as:
At the beginning of operation, the bearing has to work in a wear-in period. That can lead to the fluctuation of entropy in initial stage. To solve the problem, this paper put up with the time parameter which is used to reflect the wear of bearing accumulated over time. The range of time parameter should be between 0 and 1 in order to control the degradation index. Assuming that there are samples in a whole life of the bearing, the time parameter () of the th set of data is:
where is the time of each sample. The parameter is also a dimensionless parameter. That means it is more objective to reflect the rule of bearing degradation. Then, a new indicator, entropy with time parameter () can be calculated in Eq. (8) as:
2.4. Fuzzy clustering
Clustering is the task of grouping a set of objects in such a way that objects in the same group are more similar to each other than to those in other groups. Fuzzy clustering is always used in the classification when things are blurring. To divide the process of degradation, fuzzy clustering is an ideal method based on fuzzy mathematics [7].
Fuzzy c-means (FCM) is a commonly used algorithm in fuzzy clustering. The FCM algorithm attempts to partition a finite collection . Clustering loss function based on membership function is defined as:
where is membership function, is the center of the th cluster of clusters, is smoothing parameter, and 1. Then, using Lagrange multiplier method to find the and , which make get lowest. When the algorithm converges, the fuzzy clustering will finish [23].
In this paper, is used as the finite collection to divide stages. The time and threshold of the last stage can be regarded as the warn of bearing failure. Flowchart is shown in Fig. 2.
Fig. 2Procedure of signal processing and bearing assessment

3. Experimental results and analysis
3.1. Feature extraction
The bearing run-to-failure data used at this session have been obtained from FEMTO-ST Institute and Intelligent Maintenance System Center (IMS). In the experiment of FEMTO-ST Institute, the load is applied to the bearing radially in horizontal direction. Its vibration signal data is collected at a sampling frequency of 25.6 kHz every 10 s for 0.1 s. When the acceleration amplitude exceeds the threshold of 20, the bearing is considered failure. This paper uses the six groups of run-to-failure data and the operation condition is shown in Table 1.
Table 1Bearing operation conditions
Bearing | Load (N) | Speed (rpm) | Time (min) |
Bearing 1-1 | 4000 | 1800 | 467 |
Bearing 1-2 | 4000 | 1800 | 145 |
Bearing 2-1 | 4200 | 1650 | 151.67 |
Bearing 2-2 | 4200 | 1650 | 132.67 |
Bearing 3-1 | 5000 | 1500 | 65.67 |
Bearing 3-2 | 5000 | 1500 | 272.67 |
Taking bearing 1-2 as an example, use WPD to decompose the vibration signal into 8 subband at first. And the energy of each subband will be obtained by AR model spectrum analysis, which is shown in Fig. 3.
Fig. 3Energy of 8 subband
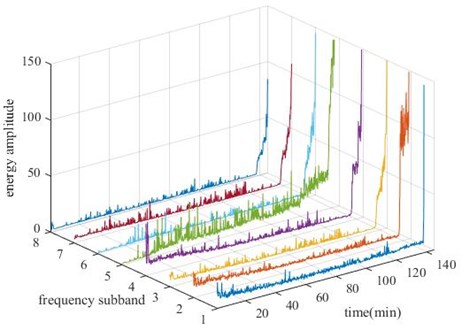
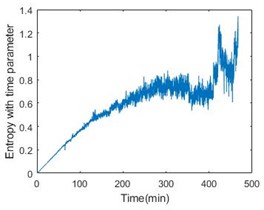
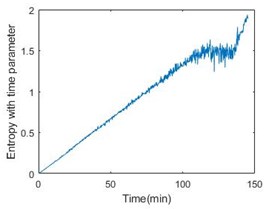
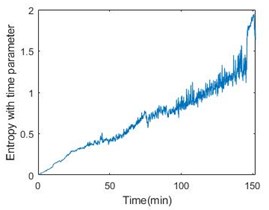
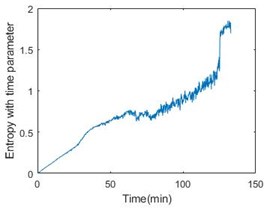
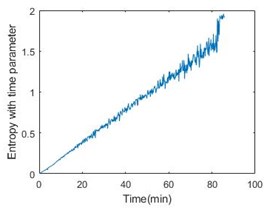
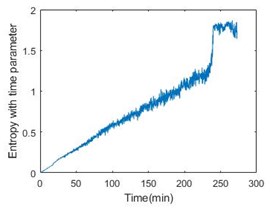
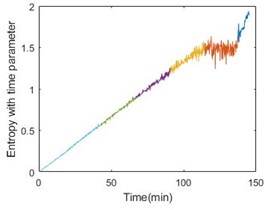
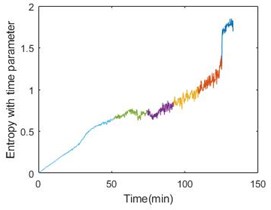
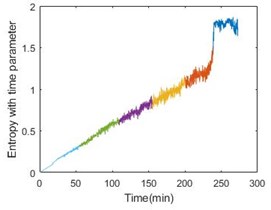
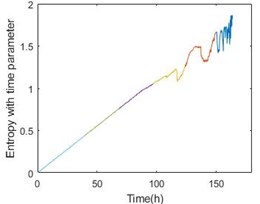
Fig. 4Entropy with time parameter of 6 bearings
a)
b)
c)
d)
e)
f)
Then, calculate the entropy according to Eq. (6) and it is shown in Fig. 3, from which it is obvious that the bearing is not stable at the beginning of operation. Introducing the time parameter will make the feature more effective. The feature of six bearings is shown in Fig. 4.
3.2. Degradation process evaluation
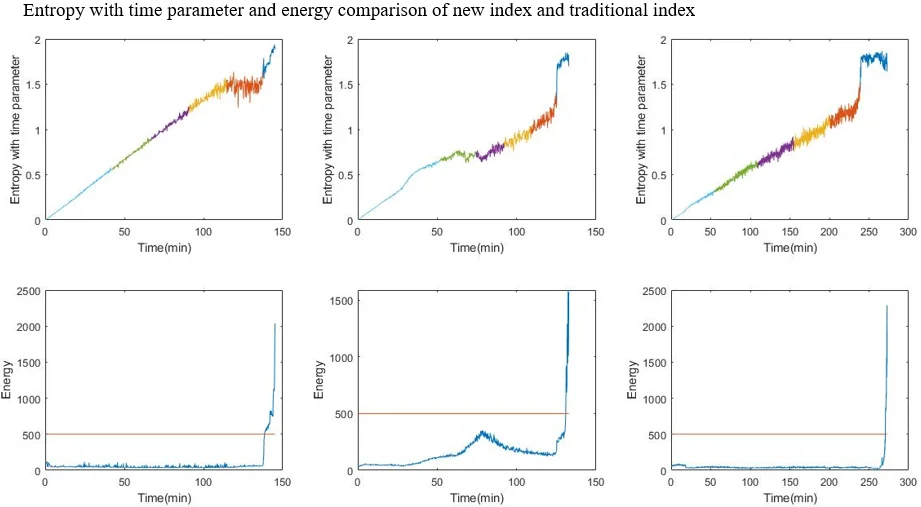
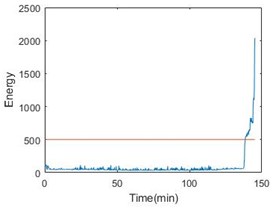
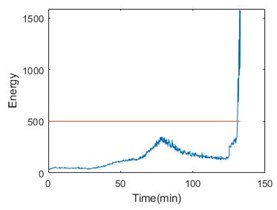
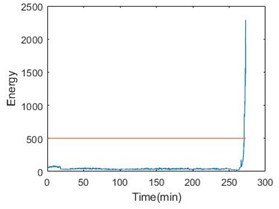
Since the entropy with time parameter has been obtained, fuzzy c-means clustering can be used to estimate the state of bearings. In this paper, it is appropriate to divide the operation into 6 stages. Taking bearing 1-2, bearing 2-2 and bearing 3-2 as examples, Fig. 5 gives the result of clustering.
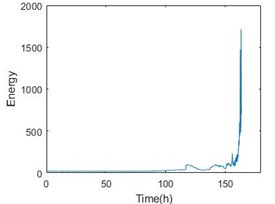
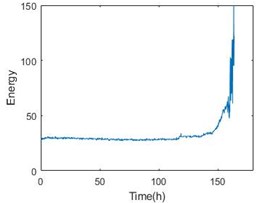
Fig. 5 also gives energy of the bearing. From the comparison, the stage can perform the degradation process. More importantly, the last stage will become a nice warning of bearing failure. Table 2 shows the details of all the six bearings. From the table, the threshold time is less than 15 % ahead of failure time.
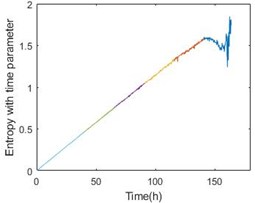
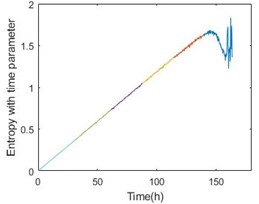
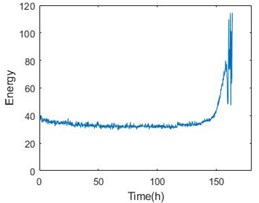
To confirm the effectiveness of the method, the paper also adopts the data from IMS. The experiment of IMS provide the vibration data at a sampling frequency of 20 kHz every 10 min for 1 s in No.2 set. In the set, there are 4 bearings working in 2000 rpm and a load of 6000 lbs for about 163 h. The result is shown in Fig. 6 and Table 3. The threshold time is also less than 15 % ahead of failure time. Obviously, the method of degradation evaluation has good universality.
Table 2Details of the 6 bearings
Bearing | Threshold after clustering | Threshold time (min) | Failure time (min) |
Bearing 1-1 | 1.2711 | 424.167 | 456.333 |
Bearing 1-2 | 1.6424 | 137.333 | 138.667 |
Bearing 2-1 | 1.1134 | 145.167 | 149.167 |
Bearing 2-2 | 1.2681 | 125.167 | 131.000 |
Bearing 3-1 | 1.4817 | 82.167 | 82.333 |
Bearing 3-2 | 1.5183 | 238.500 | 270.667 |
Fig. 5Entropy with time parameter and energy comparison of the 3 bearings
a)
b)
c)
d)
e)
f)
Fig. 6Entropy with time parameter and energy comparison of the 1-3 bearing
a)
b)
c)
d)
e)
f)
Table 3Details of the 4 bearings
Bearing | Threshold after clustering | Threshold time (h) | Failure time (h) |
Bearing 1 | 1.6547 | 149.667 | 163.667 |
Bearing 2 | 1.5799 | 140.500 | 163.667 |
Bearing 3 | 1.6286 | 139.500 | 163.667 |
Bearing 4 | 1.5467 | 139.333 | 163.667 |
4. Conclusions
This paper proposes a method to express the degradation feature and evaluate the process. The entropy with time parameter based on WPD and AR model provide a steady index in the life of bearing operation. The index solves the problem of fluctuation when the bearing is working in the initial stage of operation. In addition, the optional condition influences the index less. Even though the revolution and load change, the index will stay in a stable range. Then, fuzzy c-means clustering base on the indicator divides the process into several stages which can help evaluate degradation process. In industrial practice, the method is able to monitor the bearing in real time and get the threshold adaptively when repairing by unit replacement. It can also provide a scheme for condition-base maintenance.
References
-
Harris T. A., Kotzalas M. N. Rolling Bearing Analysis. CRC Press, 2006.
-
Al Najjar B. Condition-Based Maintenance Selection and Improvement of a Cost-Effective Vibration-Based Policy in Rolling Element Bearings. Ph.D. Thesis, Department of Industrial Engineering, Lund University, 1997.
-
Ahmad R., Kamaruddin S. An overview of time-based and condition-based maintenance in industrial application. Computers and Industrial Engineering, Vol. 63, Issue 1, 2012, p. 135-149.
-
Hoque M. N. H. Vibration Measurement of Rolling Element Bearing. LAP LAMBERT Academic Publishing, 2011.
-
Bracewell R. N., Bracewell R. N. The Fourier Transform and Its Applications. McGraw-Hill New York, 1999.
-
Griffin D., Lim J. Signal estimation from modified short-time Fourier transform. IEEE Transactions on Acoustics, Speech, and Signal Processing, Vol. 32, Issue 2, 1984, p. 236-243.
-
Pan Y., Chen J., Li X. Bearing performance degradation assessment based on lifting wavelet packet decomposition and fuzzy c-means. Mechanical Systems and Signal Processing, Vol. 24, Issue 2, 2010, p. 559-566.
-
Hong S., Zhou Z., Zio E., Hong K. Condition assessment for the performance degradation of bearing based on a combinatorial feature extraction method. Digital Signal Processing, Vol. 27, 2014, p. 159-166.
-
Peng Z. K., Tse P. W., Chu F. L. A comparison study of improved Hilbert-Huang transform and wavelet transform Application to fault diagnosis for rolling bearing. Mechanical Systems and Signal Processing, Vol. 19, Issue 5, 2005, p. 974-988.
-
Kay S. M., Marple S. L. Spectrum analysis – a modern perspective. Proceedings of the IEEE, Vol. 69, Issue 11, 1981, p. 1380-1419.
-
An D., Choi J.-H., Kim N. H. Remaining useful life prediction of rolling element bearings using degradation feature based on amplitude decrease at specific frequencies. Structural Health Monitoring, Vol. 17, Issue 5, 2017, p. 1095-1109.
-
Isermann R. Supervision, Fault-detection and fault-diagnosis methods – a short introduction. Control Engineering Practice, Vol. 5, Issue 5, 1997, p. 639-652.
-
Ben Ali J., Chebel Morello B., Saidi L., Malinowski S., Fnaiech F. Accurate bearing remaining useful life prediction based on Weibull distribution and artificial neural network. Mechanical Systems and Signal Processing, Vol. 56, Issue 57, 2015, p. 150-172.
-
Boutros T., Liang M. Detection and diagnosis of bearing and cutting tool faults using hidden Markov models. Mechanical Systems and Signal Processing, Vol. 25, Issue 6, 2011, p. 2102-2124.
-
Soualhi A., Medjaher K., Zerhouni N. Bearing health monitoring based on Hilbert-Huang transform, support vector machine, and regression. IEEE Transactions on Instrumentation and Measurement, Vol. 64, Issue 1, 2015, p. 52-62.
-
Nelwamondo F. V., Marwala T., Mahola U. Early classifications of bearing faults using hidden Markov models, Gaussian mixture models, mel-frequency cepstral coefficients and fractals. International Journal of Innovative Computing, Information and Control, Vol. 2, Issue 6, 2006, p. 1281-1299.
-
Walczak B., Massart D. L. Noise suppression and signal compression using the wavelet packet transform. Chemometrics and Intelligent Laboratory Systems, Vol. 36, Issue 2, 1997, p. 81-94.
-
Eren L., Devaney M. J. Bearing damage detection via wavelet packet decomposition of the stator current. IEEE Transactions on Instrumentation and Measurement, Vol. 53, Issue 2, 2004, p. 431-436.
-
Ye Z., Wu B., Sadeghian A. Current signature analysis of induction motor mechanical faults by wavelet packet decomposition. IEEE Transactions on Industrial Electronics, Vol. 50, Issue 6, 2003, p. 1217-1228.
-
Von Storch H., Zwiers F. W. Statistical Analysis in Climate Research. Cambridge University Press, 2010.
-
Chang Chun, Wang Guowei, Mei Jianmin, Zhang Lingling, Guo Zheng Connecting rod bearing fault diagnosis based on the wavelet packet-auto regressive model spectrum and support vector machine. Journal of Military Transportation University, Vol. 4, 2015, p. 40-44.
-
Balian R. Entropy, a Protean Concept. Poincaré Seminar 2003, Progress in Mathematical Physics, Volume 38, Birkhäuser Verlag, 2004.
-
El-Khamy S.-E., Sadek R. A., El-Khoreby M.-A. An efficient brain mass detection with adaptive clustered based fuzzy C-mean and thresholding. IEEE International Conference on Signal and Image Processing Applications, 2015.
Cited by
About this article

