Abstract
The rotor critical speed of turbine generator unit when the amplitude of the rotor increases sharply, bring to unit certain harm, rotor critical speed calculation method often results with the actual error is bigger. Through Bode diagram method and frequency spectrum analysis method, the rotor critical speed measurement was carried out. Through the experimental results it was concluded that two methods the test results are basically identical, and bode diagram was determined the selection method of measuring rotor critical speed more accurate. By changing the rotor on the quality of the wheel and position change, the use of Bode diagram method for rotor critical speed measurement. It was concluded that with the increase of the quality of the rotor critical speed decreased, the impact is not big in the center of the deviation from the rotor position far; The same quality case, the farther wheel deviating from the center of rotor, the rotor critical speed increases faster. The test results can guide the engineering practice, for the calculation of the rotor critical speed, the simulation and experiment have certain reference function.

1. Introduction
Nowadays, the thermal power plant has a great development prospect towards the trend of large-capacity and high-parameter units, so the steady operation of the unit and centralized control call for great care. Steam turbine generator unit is the core equipment of thermal power plant, and its stable operation will directly affect the safety and economy of the whole plant. As the rotor system of steam turbine generator unit is flexible, the speed of rotor must surpass the rotor critical speed, during the start-up and shut-down. At the rotor critical speed phrase, the amplitude of the rotor soar, causing rub fault between the stators and the amplitude decreased after rotor critical speed. Therefore, to control rotor critical speed during the start-up and shut-down, the rotor should be through rotor critical speed phrase in a very short period of time, to avoid destructing the rotor system and the static part excessively. If we can grasp rotor critical speed and its impact, we can judge the critical speed, and avoid the rub fault from it.
In the current research situations above home and abroad, the methods about the rotor critical speed include mainly Stodola matrix iterative method, Prohl-Myklestad transfer matrix method, Rayleigh-Ritz method, energy characteristic equation method, numerical integral method and the finite element analysis [1, 2]. However, due to the unclear material, the over-simplified model, inaccurate selection of boundary conditions and error analysis, the imprecise calculation of critical speed ensue, which causes large deviation of reference critical speed and excessive rubbing damage during start-up and shut-down phrase. Leading to excessive rubbing damage, even unit shut-down. Papers [3-5] documents calculate and simulate the critical speed of the rotor, by finite element simulation method. As the reason of selection boundary conditions and over-simplified model, there are many deviations in critical between theory and reality. However, the existence of a large number of twisted blades in the rotor system and the detuning problems make the analytical results of the finite element simplified model have some deviations. Papers [6, 7] and [8] are introduced to analyze the damage of the critical speed to the unit, the preventive measures and bearing damping coefficient’s impact of it. Deng Wangqun [9, 10] examined a small turbo fan engine of a high-speed flexible rotor and a certain type of engine of a low-pressure rotor in terms of the effect of support stiffness and axial position on their critical speed. Deng Wangqun [11] conducted a simulation using rotor dynamics analysis software SAMCEF/ROTOR to calculate and analyze the first three-order critical speed of a low-pressure rotor under different bearing stiffness coefficients and wheel qualities. Kan Alonso [12] and Ishida [13] explored the effect of bearing damping coefficient and sliding bearing structure parameters on rotor critical speed.
Above dynamics calculation and numerical simulation research on the rotor, this paper will compare Bode diagram method, and spectrum analysis methods to ultimately choose the measurement method of rotor critical speed experiment. By changing the rotor wheel position and quality, we can get their relationships between rotor critical speed.
2. Theoretical numerical analysis
The test measurement system consists of a uniform circular shaft, rotor bearing rigid supports on both ends, and a rigid thin disk [14]. A bias rotor was installed on both ends of the rigid support rigidity thin disk. The set was produced by and displacement of and , respectively. When :
The deflection is expressed as:
Similarly, the disk at the corner of the place is given by:
Using (3) and (4) to obtain , the following equation is derived:
where:
In the plane, the solution for , is:
In Eq. (5) and (6) , and , are the force and moment that affect the axis when eddy disk operates.
The principle of function and reaction indicates that rotation causes distinct influence on the force and moment acting on disk.
According to the theory of mass center movement:
After applying the theory of centroid movement on , , , , the differential equation of disk heart movement is:
The deflection angle of , reflects the effect of partial pendulum on centroid movement. The differential equation of the translational coordinate offset vortex motion of disk is:
The circular shaft in the cross section is of a dynamic symmetry rotor. Given that bending stiffness is perpendicular at two sections, the translational and deflection equations of these sections are the same. Accordingly, the differential equation of disk movement can be divided into:
where is centrifugal force, and is centrifugal torque. The matrix form of the characteristic equation of offset disk is:
If the equations have non-zero solution, then the characteristic equation of the matrix determinant must be zero. That is:
After applying a determinant:
when and regardless of the gyroscopic effect.
If 0 then it can be input into (12) of the frequency equation for:
The equation can be solve by:
Each expression substitution in Eq. (15) yields:
The relationship between critical angular velocity and critical rotation speed is:
3. Measurement and analysis of rotor critical speed
3.1. Experiment devices
The rotor critical speed measuring device is mainly composed of three parts, the rotor laboratorial platform, speed regulation equipment, measurement, analysis system and software measurement system, as shown in Fig. 1 [15].
Fig. 1Rotor critical speed measurement experimental device: 1 – the experiment pedestal, 2 – oiler, 3 – supporting bearing, 4 – eddy current displacement sensor and support, 5 – spindle, 6 – displacement sensor preamplifier, 7 – speed sensor, 8 – coupling, 9 – electric motor, 10 – vibration data analyzer, 11 – velometer, 12 – computer screen
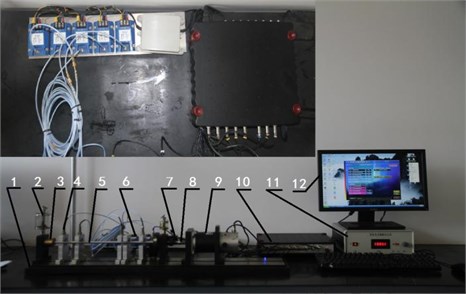
Rotor laboratorial platform and speed-control device mainly comprise the experiment pedestal, supporting bearing, oiler, spindle, coupling, Electric motor, velometer. The spindle is installed on two supporting bearings on the rotor table, lubricated by oiler. By adjusting the knob of Speed regulator to control input current, the electrical machinery master the speed of motor through the coupling. Rotor system is consisted of a spindle, wheels and a coupling. The spindle length 500 mm with 10 mm in diameter 10 mm and the gap between two bearings is 440 mm. The spindle is made of No. 45 steel and a 20 mm carbon alloy steel wheel weighing 490 g assorts it. The test system mainly includes: analysis of eddy current displacement sensor and a bracket, eddy current displacement sensor preamplifier, speed sensor, vibration analyzer and other equipment, as the Fig. 1 on the top left corner shown. Five same eddy current displacement sensor are installed on the rotor different axial positions with non-contact way. Installation clearance is 1 mm and its sensitivity is 8 mV/mm. The number one, number two, number three and number five eddy current displacement sensors is installed vertically and the number four is installed horizontally. The revolution speed transducer is mounted on near the coupling and five eddy current displacement sensors and one speed sensor’s signal are input to the vibration data analyzer, then input to the computer through the USB interface after signal processing. Software measurement mainly uses the system software to gauge critical speed by different methods measurement including: Bode diagram method,and frequency spectrum analysis method. The main axis diameter is 9.5 mm and the length is 500 mm long axis; There are 3 wheel 76×25 mm and 76×19 mm, each with a mass of 800 g and 600 g. Vibration signal sensors mainly include eddy current displacement sensor is SE which series sensitivity 8 V/mm, speed sensor is MT-3 which sensitivity 30 mV/mm/s, acceleration sensor is MT-3 which sensitivity 100 mV/g, speed sensor is RL-1 type Infrared photoelectric sensor.
3.2. Bode diagram method
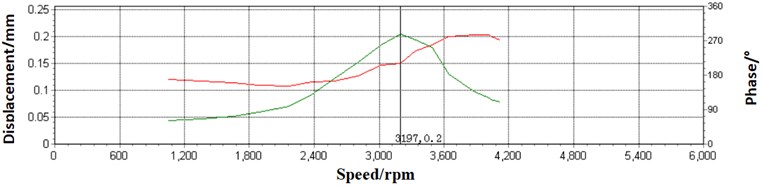
The experiment equipment measure the number three channel’s displacement (the displacement change of the rotor middle-part is obvious), and the speed of number 8 channel (fixed in time). Adjust the speed of meter up to 1000 rpm. When the computer shows steadily signal sinusoidal of displacement and square wave curve of speed, start measuring Bode diagram, and accelerate the rotor speed stably until the discovery of the displacement signal curve gradually increased and then decreased. Then close speed governor and the experiment ends up. The Bode diagram of the rotor critical speed is shown in Fig. 2.
In the Bode diagram curve in Fig. 2, the transverse coordinates are the speed signal (RPM) and the longitudinal coordinates are the displacement signal (mm) and the phase signal (degree). The green line is the change curve of the displacement with the speed. It can be seen that with the increase of the speed, the displacement gradually increases. When the displacement reaches the maximum value, it gradually decreases. It can be concluded that the speed corresponding to the maximum displacement point is the critical speed; The red line is the curve of phase change with the speed. Before and after the critical speed, it can be seen that the phase has a significant change, from 144 degrees before the critical speed to 288 degrees, and the phase before and after the critical speed has changed by 144 degrees. In line with the critical speed before and after the phase change range between 70-180 degrees range. Through the above critical speed Bird diagram curve, the maximum amplitude is 0.202 mm, corresponding to the critical rotor speed 3197 rpm, and the phase difference before and after the critical speed is 144 degrees.
Fig. 2Rotor critical speed Bode diagram
3.3. Frequency spectrum analysis method
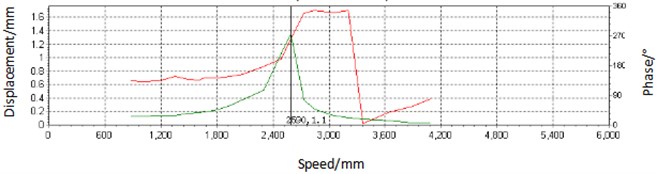
Open spectrum analysis software, and add the speed from the scratch evenly after starting collection, until the displacement increases and reduce gradually on the screen. Then uniformly decelerate to zero, the rotor critical speed spectrum as shown in Fig. 3.
Fig. 3Rotor critical speed spectrum
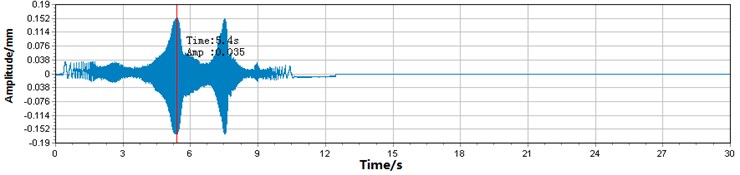
a)
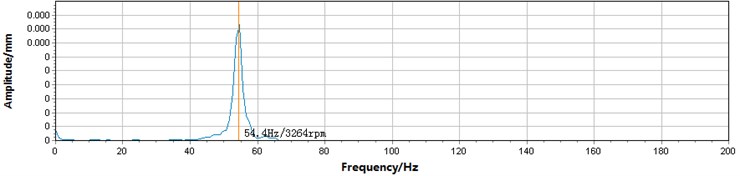
b)
Fig. 3(a) shows a schematic diagram of the changes in rotor amplitude (longitudinal coordinates) over time (transverse coordinates) during rotor lift and speed reduction. It can be seen from the figure that during the lifting process, the amplitude of the rotor gradually increases during the lifting process, and the amplitude gradually decreases after the amplitude reaches a maximum of 0.197 mm in 5.4 seconds; At this point, the speed of the rotor is reduced. With the reduction of the speed, the rotor experienced the critical speed of the rotor again in 7.4 seconds during the speed reduction process. Therefore, the maximum amplitude of the rotor at one point is 0.197 mm. In the Fig. 3(b), the transverse coordinate frequency (Hz) and the longitudinal coordinate value (mm) can be derived that there is a state point with the largest value during the rotor lift and drop speed, which corresponds to the horizontal coordinate frequency 54.4 Hz, that is, the critical speed frequency of the rotor, the corresponding critical speed is 3264 rpm.
3.4. Experimental results and analysis
According to the three critical speed measurement method, the critical speed, the three-rotor critical speed measurement method of maximum amplitude, speed error, maximum amplitude error, speed error rate and amplitude error rate are listed in Table 1, drawing the following conclusion.
Table 1Three methods for measuring rotor critical speed data
Measurement | Critical speed / rpm | Maximum amplitude / mm | Speed error / rpm | Maximum amplitude error / mm | Speed error rate / % | Amplitude error rate / % |
Bode diagram method | 3197 | 0.202 | – | – | – | – |
The frequency spectrum analysis method | 3264 | 0.197 | 67 | 0.005 | 2.1 | 2.48 |
(1) The rotor critical speed measured by the two methods is basically the same. The error of the rotation speed and the maximum amplitude is less than 2.5 %, which proves that the results of the two methods are accurate,
(2) By Bode diagram method, the critical speed and the phase change of rotor are clear and explicit in the experiment and the experimental results are accurate. This method is adopted in the field to measure the critical rotating speed,
(3) The maximum displacement is smaller than reality, measured by the spectrum analysis method. Maybe the measured date smaller caused by speeding up too fast in the acceleration phrase,
(4) The frequency spectrum analysis method only analyze the corresponding frequency of rotor critical speed, and cannot figure out the change of the phase, which caused a wrong judgment for the critical speed in the experiment.
To sum up, the rotor critical speeds are measured by bode plots.
4. Analysis the factors of critical speed
4.1. Experiment design for test
The experiment is study on the influence of wheel mass and position on rotor critical speed [16]. Select the wheel quality were 490 g, 660 g, 980 g to carry on experiment and install center-symmetrically the wheel on this 9 position on the rotor: from the left bearing 220 mm, the two rotor bearing center position and from the left bearing:44 mm, 396 mm, 88 mm, 352 mm, 132 mm, 308 mm, 180 mm, 260 mm.
4.2. Test results and analysis
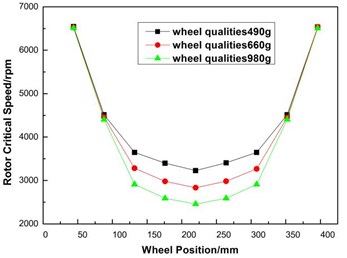
Finally, the experimental results of 27 groups of test data are obtained by using the Bode diagram method as shown in Table 2. The experimental data are drawn, as shown in Fig. 4. The critical rotation speed of the symmetric position is basically the same. As shown in Figs. 5 and 6, the 980 g wheel is measured at a distance of 176 mm and 264 mm from the left bearing. The critical rotation speed is the same, and the maximum amplitude and phase change are slightly different.
Table 2The test data of rotor critical speed under the change of disc mass and position unit: rpm
Wheel mass | Distance of left bearing 44 mm | Distance of left bearing 88 mm | Distance of left bearing 132 mm | Distance of left bearing 180 mm | Distance of left bearing 220 mm | Distance of left bearing 260 mm | Distance of left bearing 308 mm | Distance of left bearing 352 mm | Distance of left bearing 396 mm |
490 g | 6544 | 4513 | 3646 | 3398 | 3228 | 3406 | 3646 | 4513 | 6537 |
660 g | 6523 | 4459 | 3282 | 3050 | 2833 | 3058 | 3267 | 4449 | 6534 |
980 g | 6510 | 4403 | 2910 | 2590 | 2457 | 2590 | 2910 | 4405 | 6505 |
Fig. 4The critical speed of the rotor with the change of the disc mass and position
And we can draw following conclusions by analyzed.
(1) The rotor critical speed reaches the minimum when the wheel is fixed at the center of the rotor. With the increase of the distance to the center of the rotor, the critical speed of the rotor is gradually increased, and the critical speed of the symmetrical position is basically the same,
(2) With the increase of mass, the critical speed of rotor decreases, and the faster the mass increases, the faster the critical speed decreases,
(3) If the wheel deviate from the rotor center position within 40 %, the rotor critical speed increases slowly and is basically linear with deviation distance; if the wheel deviate from the center position above 40 %, rotor critical speed increases rapidly, and the rotor critical speed changes present parabolic state,
(4) The rotor critical speed changes greatly when deviate from the center within 40 %; when deviate from the center above 40 %, the impact of quality is not obvious; when deviate from the center above 80 %, basically the influence of the quality change is useless for the rotor critical speed.
Fig. 5The 980 g wheel’s bode diagram 176 mm from the left bearing
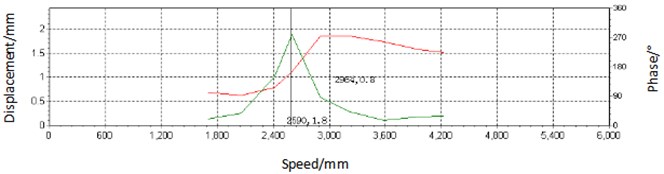
Fig. 6The 980 g wheel’s bode diagram 264 mm from the left bearing
5. Conclusions
The rotor critical speed was measured by two methods, and the error of result was less than 2.5 %. After analyzing the advantages and disadvantages of the two methods for measuring the rotor critical speed, we can draw a conclusion. The best measurement methods were Bode diagram method. By Bode diagram method, changed the quality and the position of the installed wheel of rotor, the critical speed of rotor decreases with the increase of wheel quality and in the farther center of the rotor position haven’t been influenced greatly or even no change; In the same quality situation, deviate from the center of the rotor wheel farther and rotor critical speed increase faster. The experimental results can be used to guide the engineering practice, which can be used as a reference for the calculation, simulation and experiment of the critical speed.
References
-
Kim P. Y., Flanagan R. C., Lowe I. R. G. New method for the critical speed calculation of rotor-bearing systems. American Society of Mechanical Engineers, Design Engineering Division, Vol. 18, Issue 1, 1989, p. 71-76.
-
Zhang Y. L., Li T. Q. Calculation method for critical speed for steam turbine rotor. Turbine Technology, Vol. 49, Issue 6, 2009, p. 413-419.
-
Jung Hyung-Chul, Krumdieck Susan Rotordynamic modelling and analysis of a radial inflow turbine rotor-bearing system. International Journal of Precision Engineering and Manufacturing, Vol. 15, Issue 11, 2014, p. 2285-2290.
-
Pennacchi Paolo, Vania Andrea, Chatterton Steven Nonlinear effects caused by coupling misalignment in rotors equipped with journal bearings. Mechanical Systems and Signal Processing, Vol. 30, 2012, p. 306-322.
-
Ede Jason D., Zhu Z. Q., Howe David Rotor resonances of high-speed permanent-magnet brushless machines. IEEE Transactions on Industry Applications, Vol. 38, Issue 6, 2002, p. 1542-1549.
-
Fardeau P., Huet J. L., Axisa F. Study of the conditions affecting the critical speed of a rotating pump shaft. Transactions of the International Conference on Structural Mechanics in Reactor Technology, Vol. 7, 1983, p. 384-389.
-
Zhang Y. Z., Yan Z. B., Cui H. B., et al. Prevention of friction vibration before start-up of turbine in excess of critical speed. Yunnan Electric Power, Vol. 33, Issue 4, 2014, p. 30-32.
-
Batista André Costa, Batista Lucas S. Demand side management using a multi-criteria ϵ-constraint based exact approach. Expert Systems with Applications, Vol. 99, 2018, p. 180-192.
-
Deng W. Q., Nie W. J., He P., et al. Change laws of critical speeds with supporting stiffness of a high-speed flexible rotor. Noise and Vibration Control, Vol. 35, Issue 3, 2015, p. 98-101.
-
Deng W. Q., Wang Y., Nie W. J., et al. Influence of supporting stiffness and axial location on critical speeds of a low-pressure rotor of a counter rotating engine. Aeroengine, Vol. 42, Issue 3, 2016, p. 7-11.
-
Nie W. J., Deng W. Q., Xu Y. L., et al. Yaw damper modelling and its influence on railway dynamic stability. Gas Turbine Experiment and Research, Vol. 28, Issue 3, 2015, p. 19-24.
-
Alonso A., Giménez J. G., Gomez E. Vibration of rotors at critical speed and estimation method of damping ratio. Vehicle System Dynamics, 2011, p. 1367-1387.
-
Ishida M., Takikawa M., Aoki F., et al. Influence of gauge face worn profile and lubrication on vehicle-track interaction. Quarterly Report of RTRI, Vol. 43, Issue 3, 2002, p. 137-142.
-
Yuan H. Q. Base on Rotor Dynamics. Metallurgical Industry Press, Beijing, 2013.
-
Pan H. G., Yuan H. Q., Zhao T. Y., et al. Sensitivity analysis of wheel quality and location on rotor critical speed. Journal of Vibration, Measurement and Diagnosis, Vol. 37, Issue 3, 2017, p. 532-538+630-631.
-
Pan H. G., Zhang Y., Xia Y. F., et al. The experimental study of wheel quality and position on rotor critical speed influence. Turbine Technology, Vol. 59, Issue 5, 2017, p. 354-356+360.
About this article

This work was supported by key Project of National Natural Science Foundation of China (No. 51775093) and Doctorate Start Foundation of Liaoning Provincial (No. 20180540077) and Basic Scientific Research Projects of Liaoning University (LQN201720)
