Abstract
To investigate the compaction effect and environmental impact effect of dynamic compaction (DC), a 3D continuous-discrete coupling method was used to simulate the hammer-soil interaction process for the first time. Through the dynamic response analysis of the hammer, it is found that the force of the hammer changes through three stages: the contact force increases rapidly, the contact force decreases rapidly, and the contact force decreases slowly; in addition, the soil particles are compacted under the dynamic load, resulting in oscillating changes in the soil porosity. The granular soil is punched by the hammer to form a truncated punching surface in the bulk below the bottom of the hammer. Ellipsoidal compaction bands are formed inside the punching surface, and shear bands are formed outside the punching surface. The compression and shear zones affect the soil outside the continuous-discrete interface and form a stress concentration zone and a plastic strain zone near the interface, resulting in a sharp attenuation of the acceleration amplitude as the radial distance increases. Through an amplitude and Fourier spectrum analysis, it is found that the radial vibration caused by the DC is the strongest, while the tangential and vertical vibrations are almost the same. With the increase in the radial distance, the radial vibration attenuation rate is greater than that of the tangential and vertical vibrations, and their PGAs tend to be the same away from the impact point. These research results are helpful for evaluating the influence of the DC and the installation process on the reinforcement effect of the soft ground and for improving the accurate design and control level of soft ground strengthened by DC.
1. Introduction
Dynamic compaction (DC) is a widely used large-area ground improvement method for compacting granular soils to improve the bearing capability of soil foundations, such as roadbeds, abutments, airports, and ports. The types of soils and the depths of foundations treated by DC are widened and increased with the increasing compacting energy, i.e., a heavier hammer and a higher dropping distance. Because of its cost-effectiveness, simplicity and the considerable depth that it affects, it can also be used to substitute for deep vibratory compaction and smooth wheel vibratory roller compaction in some cases [1, 2].
The focus of the most intensive research has been the depth and degree of improvement [3, 4] and the range of the vibration effects [5]. In general, the greater the impact energy, the deeper the improvement depth and the better the reinforcement effect of the DC on the foundation. Meanwhile, the greater the impact energy, the larger the impact range of the ground vibration and the greater the negative impact on the environment. Increasing the depth of the improvement and controlling the vibration of the ground are two competing aspects of the DC design, which have always been treated separately.
At present, the DC research methods can be divided into three types: analytical, experimental and numerical approaches. The DC numerical simulation methods can be further divided into simulation methods based on continuous theory, such as the finite element method (FEM) or finite difference method (FDM), and discrete methods based on the mechanics of granular matter, such as the discrete element method (DEM).
Pan and Selby [6] numerically analyzed the response of dry soil to rigid body impacts by the finite element package ABAQUS. Liu et al. [7] explored the deformation of gravel ground by the finite element package Plaxis. Gu and Lee [8] predicted the stress wave attenuation and improvement effects of the ground during the DC process by the 2D dynamic FE program CRISDYN. Wang et al. [9] investigated the performance of ground deformation due to DC by a 2D numerical model created in LS-DYNA. Those studies show that the FEM-based numerical method can better analyze the large-scale dynamic response of the ground caused by DC, but it cannot reflect the densification effect of the soil composed of granular particles.
Zhou and Song [10] analyzed the transverse isotropy of compaction in a highly filled foundation by the discrete element package PFC3D. Ma et al. [11] analyzed the improvement effect and the influence depth of the DC of a gravel soil foundation by the particle flow discrete element codes PFC2D and PFC3D. Li et al. [12]. analyzed the influence of particle breakage on the crater depth and impact stress by DC. Limited to the current computing capacity, most of the discrete element simulations are performed on a small scale. DEM can reflect the behavior and deformation of soil from the physical properties, but it is difficult to simulate large-scale site response problems, and the dynamic boundary condition of the granular model is also difficult to set. Wang et al. [13, 14] proposed contact models for the soil particle interactions that can be used for DEM simulation.
The continuous-discrete coupling (CDC) method can not only simulate the compaction effect of the hammer on the soil particles but can also simulate the dynamic response of the ground to the impaction, so it can more comprehensively study the two competing properties of the DC than either FEM or DEM simulation. Jia et al. [15] simulated dynamic compaction by combining the discrete element method (DEM) and finite difference method (FDM) in 2D and investigated the soil deformations under dynamic compaction. Indraratna et al. [16] proposed a 2D continuous-discrete coupling method to analyze the load-deformation behavior of a single stone column installed in clay. Wang and Li [17] simulated the stone column installation process by the three-dimensional continuous-discrete coupling method. However, given the complexity of the physical and mechanical properties of geomaterials, continuous-discrete coupled simulation is still a challenging task. Because of the confinement mentioned above, the current cognition of the hammer-ground interaction is still insufficient. The effects of the ground improvement and environmental effects caused by the DC have not been systematically studied.
To investigate the compaction effect and environmental impact effect caused by DC, this paper simulates the soil-hammer interaction under DC by means of CDC. First, the paper introduces the continuous-discrete coupling numerical calculation model. Then, through the inverse analysis method, the microphysical parameters of the bulk material are determined by a triaxial test simulation of the bulk material, and the reliability of the calculation model is verified by the indoor dynamic compaction test results. Finally, the hammer-soil interaction process is simulated, and the dynamic response of the foundation under dynamic compaction is analyzed.
2. Model setup and parameter calibration
2.1. Simulation model set-up
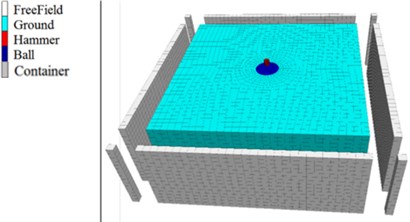
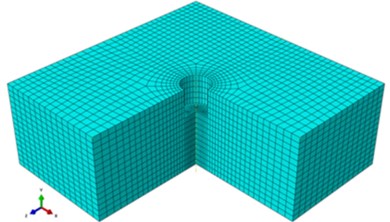
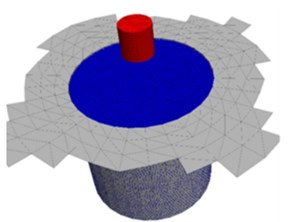
Following the continuum-discrete coupling methods [17], the dynamic compaction model consists of three parts: the continuum model, discrete model and free field boundary, as shown in Fig. 1. The ground part in the continuum domain is an 80 m×80 m×30 m block with a 5 m, 10 m cylindrical hollow in the center to be filled by particles in the discrete domain. Additionally, the hammer with both a diameter and height of 2.2 m is in the continuum part. The discrete model mainly consists of soil particles with a radius of 10 cm. The continuum part and discrete part of the model are coupled by the walls generated by the partial surfaces of the continuum model. Thus, there are two coupling parts in this model, i.e., the ball container and the hammer surface. The ground and the hammer of the continuum part are separately meshed to 21475 and 960 C3D8 elements, as shown in Fig. 1(c). The particle number of the discrete model is 115883, as shown in Fig. 1(d).
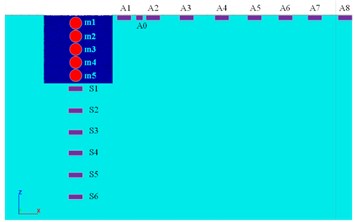
Fig. 1Continuum-discrete coupling model set-up: a) coupled continuum-discrete model with free-field boundary condition, b) monitoring points of acceleration, pressure and porosity in the model, c) continuum model of foundation with a quarter removed, d) discrete model with particles and walls
a)
b)
c)
d)
To monitor the dynamic response of the discrete domain, there are five spherical measurement regions with a radius of 0.5 m and centers that are distances of 1 m, 3 m, 5 m, 7 m, and 9 m to the surface, i.e., m1 to m5 in Fig. 1(b). The ground surface response of the continuum domain is also recorded, with distances of 5 m, 10 m, 15 m, 20 m, 25 m, 30 m, 35 m and 40 m to the hole center, i.e., A1 to A8. Additionally, a special monitoring point A0 in the middle of A1 and A2 is set to detect the volatile value near the interface of the discrete and continuum domains. Additionally, the vertical dynamic soil pressure is recorded behind the discrete model, with distances of 1 m, 3 m, 5 m, 7 m, 9 m, and 15 m to the bottom of the hole, i.e., S1 to S6.
2.2. Microproperty calibration by means of simulated triaxial tests
The unknown microproperties of granular materials can be evaluated by inverse modeling based on a series of triaxial tests on samples made of those materials. The DEM’s microparameters are adjusted to make the behavior of the numerical sample match that of the physical sample. Then, the corresponding adjusted parameters can be used for the simulation of a larger assembly of those particles.
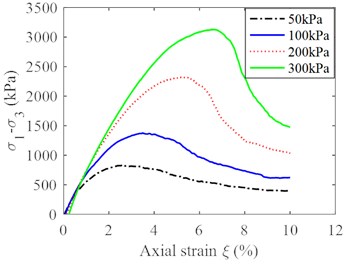
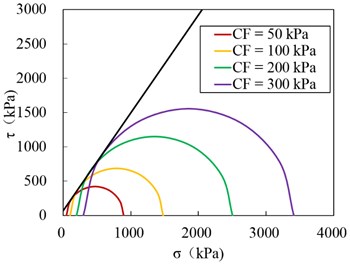
The main properties of the soil mass are the cohesion of 69.3 kPa and frictional angle of 54.97°, and the corresponding microproperties of the soil particles are shown in Table 1, as determined by triaxial tests.
The procedure of the simulated triaxial tests can be referred to the example of the sleeved triaxial test by PFC-FLAC3D coupling [17], and the test results in our case are shown in Fig. 2.
Table 1Microproperties of soil particles
Parameter | Ball-ball | Ball-wall |
Density / (kg·m-3) | 2600 | – |
Contact modulus / (Pa) | 3.45×10⁸ | 8.0×10⁸ |
Ratio of stiffness / | 2 | 2 |
Normal critical damping ratio | 0.8 | 1 |
Shear critical damping ratio | 0.8 | – |
Tensile strength / (Pa) | 2.0×10⁴ | – |
Cohesion / (Pa) | 2.0×10⁵ | – |
Frictional coefficient | 0.6 | 0.6 |
Fig. 2Triaxial test curves of soil particles: a) deviator stress vs axial strain with confining stresses of 50 kPa, 100 kPa, 200 kPa and 300 kPa, b) Mohr circles for triaxial stress conditions and failure envelope
a)
b)
2.3. Parameter validation by dynamic compaction test
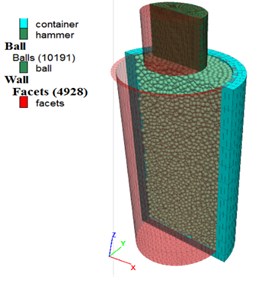
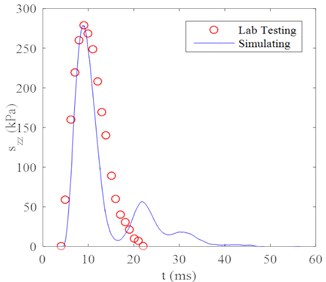
Before performing the large-scale calculation, the proposed numerical model should be validated by lab tests. DC tests are simulated by a CDC model according to the laboratory tests of Zhang and Wang [18]. The hammer and container are simulated by the FDM package FLAC3D, and the soils are modeled by 10191 particles with a radius of 10 cm, as shown in Fig. 3(a). The tamping energy is 200 N·m, i.e., a hammer with a weight of 25 kg drops by 0.8 m. The dynamic earth pressure curves of the soil at a depth of 150 mm from the model test and numerical simulation are shown in Fig. 3(b).
Fig. 3Numerical model of dynamic compaction: a) half section of numerical model, b) vertical dynamic earth pressure at a depth of 150 mm along the axial line of the container
a)
b)
The simulated results show that the stress curve oscillates 2 times before vanishing, which does not mean the rebounding of hammer and can be controlled by adjusting the viscous damping coefficient [19]. Except for the oscillating phenomenon, the numerical results match very well with those of the laboratory tests.
3. Results and discussion
3.1. Dynamic behavior of hammer
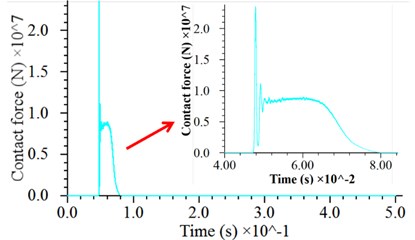
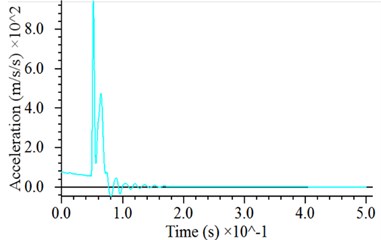
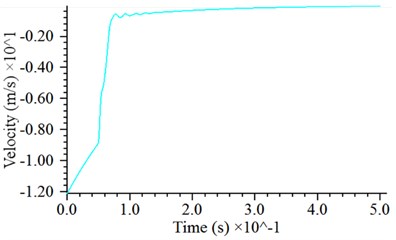
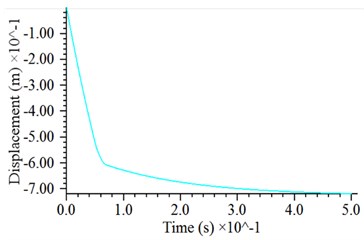
The simulated tamping energy is 2000 kN·m (i.e., a hammer with a weight of 250 kN freely falls from a height of 8 m under gravity starting at rest). To reduce the unnecessary calculation time of the hammer dropping, the hammer falls with an initial velocity of 12.12 m/s from 0.5 m above the ground. The dynamic response of the hammer is shown in Fig. 4. There is a rapid energy release at the beginning of the hammer-particle contact, and it acts likes a pulse with respect to the shape of the contact force history as well as the acceleration history, as shown in Fig. 4(a) and (b). The simulated impact process lasts approximately 30 ms. After the hammer touches the soil particles, the contact force rapidly increases to a maximum value, then decays rapidly within a few seconds, and slowly decays to zero after several oscillations caused by the vibration of the soil particles, which is similar to results of Jia et al. [15]. In the process of the contact force attenuation, the velocity curve also exhibits oscillations, as shown in Fig. 4 (c). At the end of the impact, the hammer settles with a compact settlement of approximately 20 cm, which is coincident with lab test results [18, 20], as shown as Fig. 4(d). It also shows that 0.5 s is long enough for one cycle to be simulated before any rebound.
Fig. 4Dynamic response of hammer: a) time history of contact force with magnified detail of the curve near the contact moment, b) time history of acceleration, c) time history of velocity, d) time history of displacement
a)
b)
c)
d)
3.2. Compaction effect of granular soil under DC
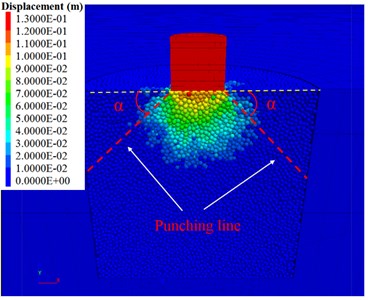
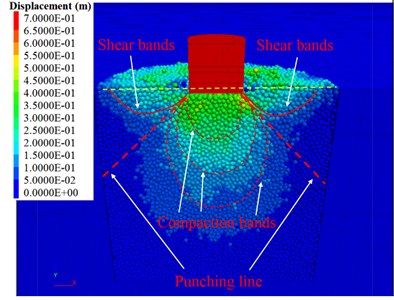
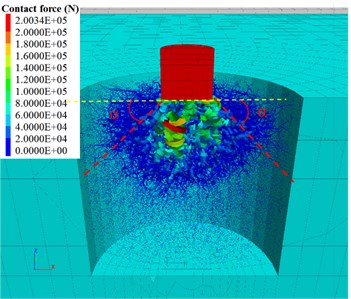
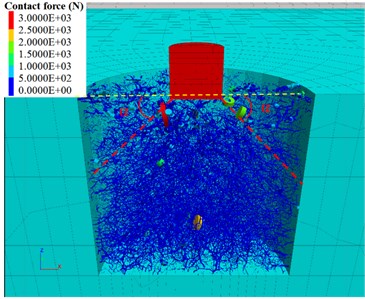
To explore the compaction effect of granular soil caused by strong DC, the displacement of the granular particles around the hammer and the contact force between the particles were determined when the punching stress was maximum ( 0.07 s) and the compacting process was finished ( 0.5 s), as shown in Fig. 5(a)-(d). An obvious punching phenomenon and punching-shearing effects can be seen when the hammer impacts on the soil particles, and it forms a tress diffusion angle and a truncated punching surface with the shape of a frustum cone in the bulk (formed by the punching line rotating around the axis of the hammer), as shown in Fig. 5(a). The impact force of the hammer is only borne by the particles inside the punching face, as shown in Fig. 5(c). As the hammer penetrates, a crater is formed on the surface of the ground. Similar to the test results of Nazhat and Airey [21], ellipsoidal compression bands are visible inside the bottom of the crater, as shown Fig. 5(b). The soil particles around the crater escape and form an extruded shear band. It can be seen that after the DC is completed, the main contact directions of the residual contact force among the particles are approximately parallel to or at a small angle with the direction of the punching line, as shown in Fig. 5(d).
Fig. 5Particle displacement under the impact of a hammer at: a) t= 0.07 s, b) t= 0.5 s and contact force chains of granular soil at c) t= 0.07 s and d) t= 0.5 s
a)
b)
c)
d)
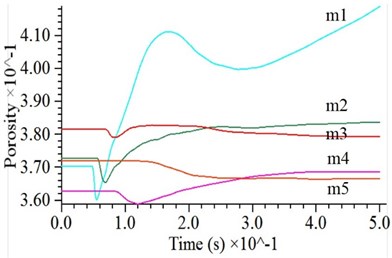
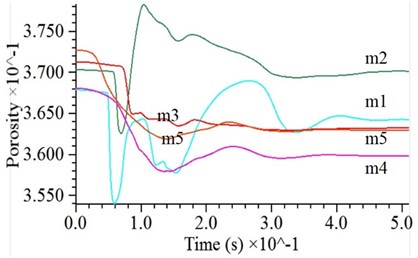
To investigate the densification effect of DC on the ground, the local porosity of granular soils at different depths below the surface of the ground with and without cohesion has been studied, with the measuring spheres shown in Fig. 1(b). The local porosity of the soils decreased sharply under the impact of the hammer.
As the depth increases, the moment at which the porosity sharply decreases becomes later, reflecting the process by which the compression wave propagates downward from the bottom of the hammer. The farther away from the hammer, the smaller the amplitude and velocity of the sharp dip in the porosity curve, reflecting the weakening of the impact effect. For cohesive soil, the porosity of the soil around the hammer is sharply reduced under the action of the compression wave, but then it rebounds to its initial value, indicating that the strong smash destroys the connection between the particles and partially acts as a vibration loosening, as shown in Fig. 6(a). For cohesionless soils, the porosity of the soil at the bottom of the hammer has experienced two periods of severe reduction and slow reduction, accompanied by oscillating phenomena, indicating that the granular particles are adjusted frequently to each other under a dynamic load to achieve the most stable status, as shown in Fig. 6(b). It can be seen that the compaction effect of cohesionless soil is much larger than that of cohesive soil.
Fig. 6Porosity variation under impact for: a) cohesive soil, b) cohesionless soil
a)
b)
3.3. Environmental impact effect of ground under DC
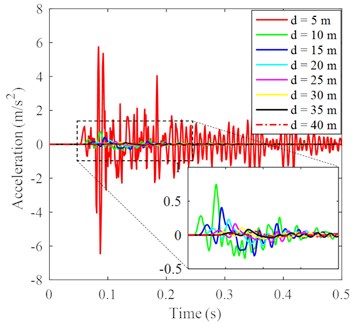
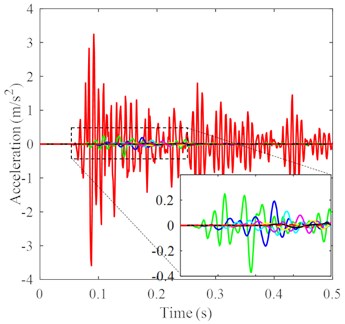
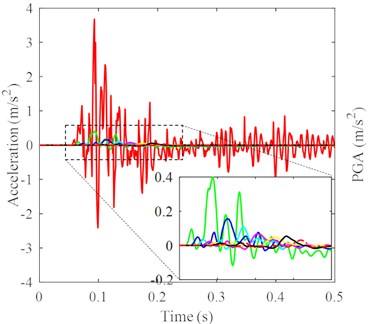
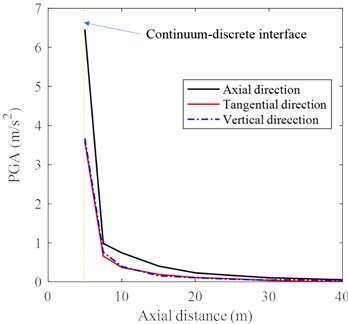
To study the influence of DC on the surface vibration, the radial, tangential and vertical acceleration histories at 8 points with an interval of 5.0 m starting from the impact point are selected for analysis, as shown in Fig. 1(b). The radial, tangential and vertical dynamic responses are relatively strong at the continuous-discrete interface, and the acceleration amplitudes in all three directions decrease with the increasing distance to the impact point, as shown in Fig. 7(a)-(c). As the radial distance increases, the peak ground acceleration (PGA) changes with the same tendency in all three directions. They all go through two stages: the PGA decreases sharply in the range of 5.0-7.5 m from the axis of the hammer (i.e., in the range of 0-2.5 m from the continuum-discrete interface) and then slowly with the increasing radial distance beyond 5.0-7.5 m (i.e., more than 2.5 m away from the continuous-discrete interface), as shown in Fig. 7(d). The radial PGA of any given point is the largest, and the vertical PGA is slightly larger than the tangential PGA, e.g., the radial PGA is 6.46 m/s2, the vertical PGA is 3.67 m/s2 and the tangential PGA is 3.59 m/s2 at the continuous-discrete interface. In addition, it can be seen that the differences among the radial, tangential and vertical PGAs decrease with the increasing radial distance and tend to be the same at a radial distance of 40 m, indicating that the radial vibration has a faster attenuation rate than the tangential vibration or vertical vibration.
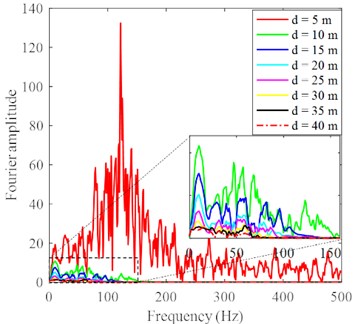
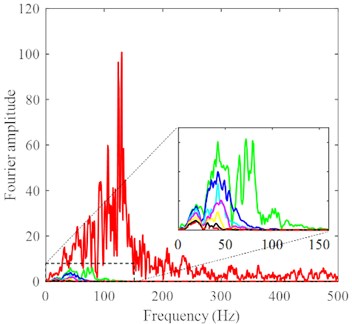
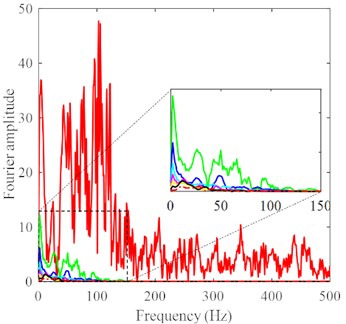
Fourier spectrum curves of the acceleration in the radial direction, vertical direction, and tangential direction are shown in Fig. 8(a)-(c). The amplitude, the number of main frequencies and the bandwidth of the Fourier spectra in the three directions decrease with the increasing radial distance, which is consistent with the field test results of Hwang and Tu [5]. In addition, as the radial distance increases, the higher the Fourier spectrum band, the faster the amplitude decays. The amplitude and main frequency of the Fourier spectra of the acceleration at the continuous-discrete interface in the three directions are much larger than those of the acceleration beyond the radial distance of 10 m (i.e., a continuous-discrete interface distance of 5 m). The radial acceleration has the most primary frequencies, followed by the vertical acceleration, and the tangential acceleration has the fewest. Taking the acceleration record at the radial distance of 15 m as an example, the radial acceleration has six primary frequencies, i.e., 8-10 Hz, 28-30 Hz, 38-40 Hz, 50-60 Hz, 80-84 Hz, and 94-96 Hz; there are three primary frequencies of the vertical acceleration, which are 3-5 Hz, 26-28 Hz, 48-52 Hz, respectively. The primary frequencies of the tangential acceleration are 18-20 Hz and 35-55 Hz, respectively. Considering the ground motion parameters such as the amplitude and spectrum, it can be seen that the radial vibration caused by DC has the greatest influence on the ground surface, followed by the vertical vibration and tangential vibration.
Fig. 7Acceleration histories at different distances to impact center in: a) axial direction, b) tangential direction, c) vertical direction with a magnified detail in the time range of 0.05-0.25 s, except for the acceleration at the continuum-discrete interface, d) PGA of each location in three directions under DC
a)
b)
c)
d)
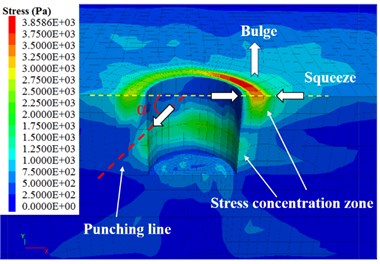
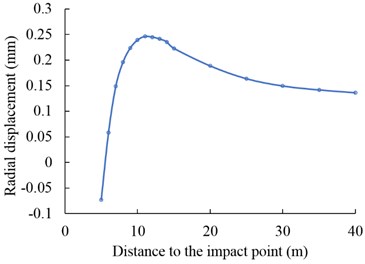
After the single slamming, there are two distinct areas of residual stress concentration inside the foundation: one located on the surface of the ground with a radial distance of approximately 10 m to the impact point, which is formed by the squeezing of the soil particles in the shear bands on the surrounding soil in the continuum domain (also shown in Fig. 5(b)), and the maximum residual stress after impact is approximately 4 kPa. The other is located near the intersection of the punching surface and the continuous-discrete interface, which is formed by the squeezing of the soil particles in the compaction bands on the surrounding solid zone, and the maximum residual stress is approximately 1 kPa, as shown in Fig. 9(a). At the same time, the radial displacement of the ground surface in the continuum domain increases with the radial distance and reaches a maximum value of 0.25 mm at a distance of 11 m to the impact point and then gradually decreases to 0.14 mm, as shown in Fig. 9(b). The location of the maximum residual radial displacement of the ground surface is basically the same as that of the maximum residual stress. The stress concentration near the surface causes the plastic deformation and nonlinear response of the soil near the continuous-discrete interface, which is the intrinsic reason for the rapid attenuation of the PGA in the range of 0-2.5 m from the continuum-discrete interface, as shown in Fig. 7(d), as well as the residual displacement variation characteristics.
Fig. 8Fourier spectra of acceleration histories at different distances: a) axial direction, b) tangential direction, c) vertical direction with a magnified detail at the frequency of 0-150 Hz, except for the acceleration history at the continuum-discrete interface, under DC
a)
b)
c)
Fig. 9a) Residual stress contour after single DC, b) residual radial displacement curve
a)
b)
4. Conclusions
Based on the continuous-discrete coupling model with parameter calibration and model verification, this paper reproduces the soil-hammer interaction process when soft ground is improved by DC and studies the dynamic response of the tamping hammer and the granular soil under the action of DC. Additionally, the impact of strong vibration on the environment has been investigated. The main conclusions are as follows:
1) During the DC process, the force of the tamping hammer changes through three stages: the contact force increases rapidly, the contact force decreases rapidly, and the contact force decreases slowly. The soil particles are compacted under a dynamic load, resulting in changes in the soil porosity.
2) The hammer impacts the soil particles, exhibiting an obvious punching phenomenon and punching-shearing effects, and forms a stress diffusion angle and a truncated punching surface in the bulk below the bottom of the hammer. Ellipsoidal compaction bands are formed inside the punching surface, and shear bands are formed outside the punching surface.
3) Under the influence of the punching action of the soil particles, the foundation soil forms two stress concentration areas: one near the intersection of the punching surface and the continuous-discrete interface the other at the ground surface near the continuous-discrete interface. The stress concentration causes plastic deformation and a nonlinear response of the soil in the range of 0-2.5 m around the contact interface, which makes the acceleration amplitude of the region sharply decrease with the increasing radial distance.
4) The PGA, amplitude of the acceleration Fourier spectra and number of main frequencies and bandwidth are reduced as the axial distance increases. In addition, as the axial distance increases, the higher the amplitude of the Fourier spectrum, the faster the amplitude is attenuated, and the PGA attenuates more slowly with the increasing axial distance
5) The PGA, the amplitude, the number of main frequencies and the bandwidth of the acceleration Fourier spectra decrease with the increasing radial distance. As the radial distance increases, the higher the Fourier spectrum band, the faster the amplitude decays, but the PGA attenuates more slowly with the increasing radial distance.
6) The radial vibration intensity at the continuous-discrete interface is the largest and the main frequencies are the most, while the tangential vibration and vertical vibration have roughly the same parameters. As the radial distance increases, the attenuation rate of the radial vibration is greater than that of the tangential and vertical vibrations, and thus the vibrations in the three directions tends to converge far from the impact point.
References
-
Ghassemi A., Pak A., Shahir H. Numerical study of the coupled hydro-mechanical effects in dynamic compaction of saturated granular soils. Computers and Geotechnics, Vol. 37, Issue 1, 2010, p. 10-24.
-
Narendranathan N., Lee E. C. Dynamic Compaction and Dynamic Consolidation of Soils. Ground Improvement Case Histories, Butterworth-Heinemann, San Diego, 2015, p. 365-398.
-
Lee F. H., Gu Q. Method for estimating dynamic compaction effect on sand. Journal of Geotechnical and Geoenvironmental Engineering, Vol. 130, Issue 2, 2004, p. 139-152.
-
Mullins G., Gunaratne M., Stinnette P., et al. Prediction of dynamic compaction pounder penetration. Soils and Foundations, Vol. 40, Issue 5, 2000, p. 91-97.
-
Hwang J. H., Tu T. Y. Ground vibration due to dynamic compaction. Soil Dynamics and Earthquake Engineering, Vol. 26, Issue 5, 2006, p. 337-346.
-
Pan J. L., Selby A. R. Simulation of dynamic compaction of loose granular soils. Advances in Engineering Software, Vol. 33, Issue 7, 2002, p. 631-640.
-
Liu H. J., Zhao S. B., Jia G. Z. FEM analyses of deformations of HELDC-treated macadam foundation under large-scaled oil tank. Chinese Journal of Geotechnical Engineering, Vol. 32, Issue 2, 2010, p. 1029-1034.
-
Gu Q., Lee F.-H. Ground response to dynamic compaction of dry sand. Géotechnique, Vol. 52, Issue 7, 2002, p. 481-493.
-
Wang W., Chen J.-J., Wang J.-H. Estimation method for ground deformation of granular soils caused by dynamic compaction. Soil Dynamics and Earthquake Engineering, Vol. 92, 2017, p. 266-278.
-
Zhou M. J., Song E. X. Particle flow simulations of the compaction of filling materials in highly filled foundation with analyses of the transverse isotropy. Journal of Tsinghua University (Science and Technology), Vol. 56, Issue 12, 2016, p. 1312-1319.
-
Ma Z. Y., Dang F. N., Liao H. J. Numerical study of the dynamic compaction of gravel soil ground using the discrete element method. Granular Matter, Vol. 16, 2014, p. 881-889.
-
Li X., Li J., Ma X., et al. Numerical study of the dynamic compaction process considering the phenomenon of particle breakage. Advances in Civil Engineering, Vol. 2018, 2018, p. 1838370.
-
Wang J., Li Q. M., Yang C., et al. A simple model for elastic-plastic contact of granular geomaterials. Advances in Materials Science and Engineering, Vol. 2018, 2018, p. 6783791.
-
Wang J., Li Q. M., Yang C., et al. Repeated loading model for elastic-plastic contact of geomaterial. Advances in Mechanical Engineering, Vol. 10, Issue 7, 2018, https://doi.org/10.1177/1687814018788778.
-
Jia M., Yang Y., Liu B., et al. PFC/FLAC coupled simulation of dynamic compaction in granular soils. Granular Matter, Vol. 20, Issue 4, 2018, p. 76.
-
Indraratna B., Ngo N. T., Rujikiatkamjorn C., et al. Coupled discrete element-finite difference method for analysing the load-deformation behaviour of a single stone column in soft soil. Computers and Geotechnics, Vol. 63, 2015, p. 267-278.
-
Wang J., Li Q. Coupled continuum-discrete modeling of rammed floating stone column installation. AIP Advances, Vol. 9, Issue 1, 2019, p. 015222.
-
Zhang Q. F., Wang D. Q. Physical model tests of coal gangue foundation under dynamic compaction loads. Chinese Journal of Rock Mechanics and Engineering, Vol. 32, Issue 5, 2013, p. 1049-1056.
-
Jiang M. J., Wu D., Xi B. DEM simulation of dynamic compaction with different tamping energy and calibrated damping parameters. Proceedings of the 7th International Conference on Discrete Element Methods, Dalian, China, 2016, p. 845-851.
-
Zhang Q. F., Wang D. Q. Model tests on dynamic stress in colliery wastes improved by dynamic compaction. Chinese Journal of Geotechnical Engineering, Vol. 34, Issue 6, 2012, p. 1142-1147.
-
Nazhat Y., Airey D. The kinematics of granular soils subjected to rapid impact loading. Granular Matter, Vol. 17, Issue 1, 2015, p. 1-20.
Cited by
About this article
The authors appreciate the financial support from the National Natural Science Foundation of China (No. 51308474), the Fundamental Research Funds for the Central Universities (No. 2682017CX005), the Student Research Training Program (SRTP) of Southwest Jiaotong University, and the Key Laboratory Open Project of Southwest Jiaotong University (No. GD201817055).
Jian Wang devised the project, the main conceptual ideas, proof outline and performed the numerical calculations. Yuhan Jiang, Huiyi Ouyang, Tianheng Jiang, Minge Song and Xiang Zhang helped to examine the manuscript and discuss the results. All authors contributed to the final manuscript.
