Abstract
This paper discusses the issue of assessing the condition of three-phase induction motors (which are used as power units for tools on manufacturing lines in the furniture industry) following major repairs. These high-speed motors differ from standard motors in higher frequency power input, more durable bearings and reinforced structure of the terminal part of the rotor shaft. The rotational speed of the rotor is 10,000-18,000 rpm. Such high values of rotational speed trigger a situation in which exceeding the allowable limit of residual unbalance for the rotor unit damages the motor. The damage might necessitate a comprehensive repair. Such cases are frequent. The conducted studies resulted in designing a vibration analysis for assessing the condition of reconditioned high-speed motors (a method for controlling the quality of repairs). Both high- and low-frequency analyses with a signal selection module and the basic general measurements were applied. The analysis provides the possibility of verifying the efficacy of reconditioning in relation to the mechanical validity of the repaired motors.
Highlights
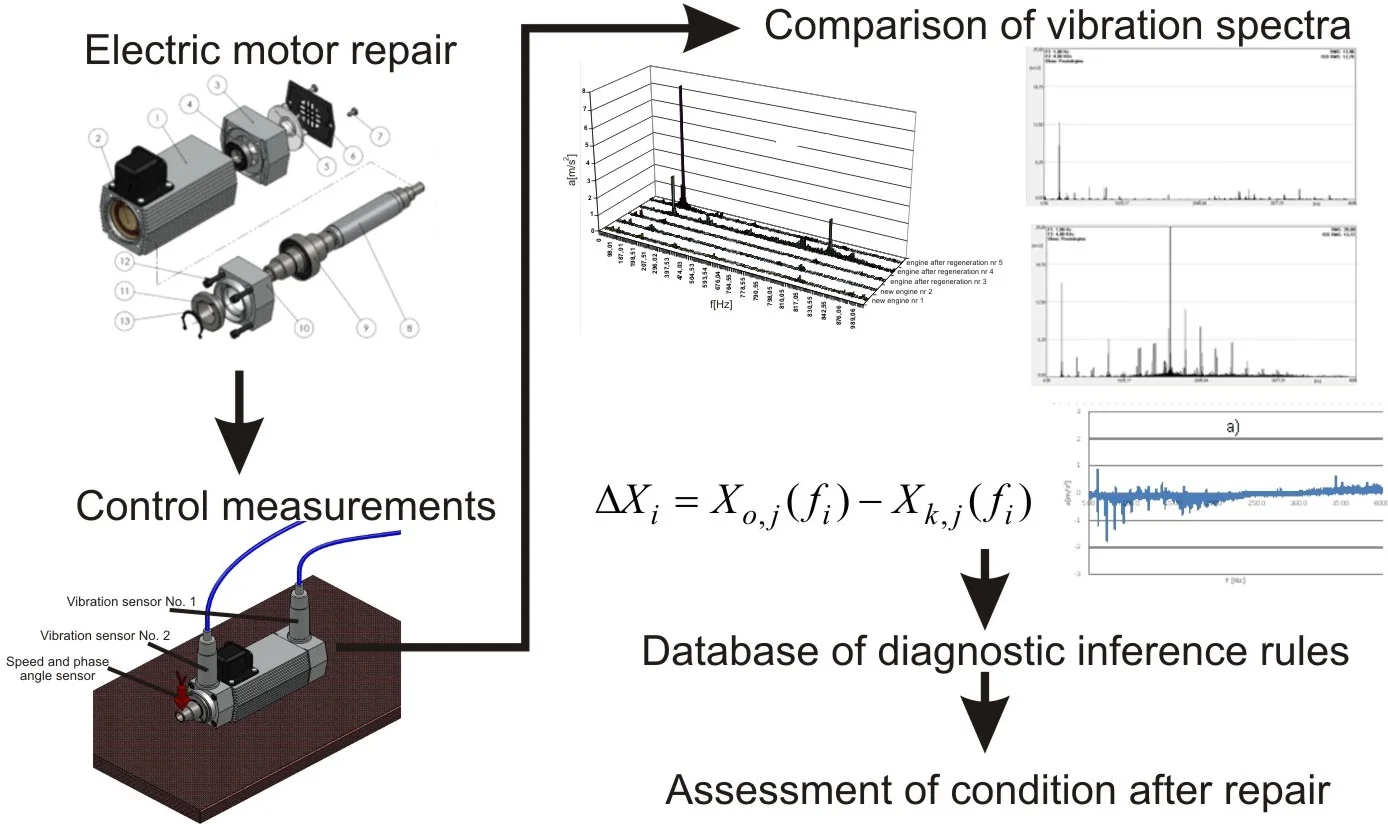
- Comparative analysis of reference spectra and spectra obtained after the repair of motors
- Determining differences in the vibration amplitudes for characteristic frequencies
- Creation of database of diagnostic inference rules
- 50% increase of MTBF values for induction motors
1. Introduction
In many furniture factories and woodworking shops, although general overhauls of high-speed induction motors are carried out in private workshops and the outcome is satisfying for the optimal electric parameter, numerous cases of short-term mechanical durability are reported. Even the most accurate verification of the parts during repairs does not secure durability that is comparable with new motors. There are very extreme cases, e.g. new motors with 0.5 kW and 10,000 rpm which have an average durability of 8,000 hours and some reconditioned motors have a durability of 500-1,00 hours. However, there are also repairs which give reconditioned motors better durability than new motors.
The background of this phenomenon is not entirely elucidated and it is said that at the production stage, very accurate metrological measurement procedures are applied and casing parts that are precisely fitted both geometrically and dynamically are used. During repairs, some motor parts (bearing casings, rotors, stators, and bearings) have to be replaced and the resulting unit is not original.
Therefore, the conclusion can be drawn not to recondition the motors and to purchase new ones or to outsource repairs to specialised workshops, authorized by the manufacturers of the motors (that are often situated abroad). For economic reasons, it becomes unjustified.
For standard repair technology of high-speed induction motors the following stages (technological operations) can be distinguished [1]:
preliminary diagnosis (start-up tests - mainly electric) – if the engine starts running on a test bench:
• Disassembly;
• Washing and cleaning of parts;
• Verification of parts;
• Replacement or regeneration of damaged parts;
• Balancing of rotors - only carried out by specialized companies;
• Assembly;
• Quality control of repair.
The first seven stages are well recognized and described in technical documentation and manuals of electric motors repair companies. The mentioned information can also be found in general literature on electric motors repairs [1-2]. While, the final quality control is generally limited to mandatory tests, according to the standards [3-7]. Some repair companies on their websites (for example [8]) provide information on use of “special” testers. However, these devices are designed for electrical checks, without specific data.
2. Methods of diagnosing of induction motors
The objective of the paper is to search for solutions facilitating the surveillance of repairs of high-speed induction motors using the vibration method. The following economic and technological circumstances were taken under consideration:
• The implementation and maintenance costs of a novel motor quality control method in a repair shop should not exceed the costs associated with outsourced services;
• The new method should be simple in interpreting the test results;
• The testing time for reconditioned motors should not be longer than 5-10 minutes;
• The method should allow for assessing the condition of a motor following the final assemblage.
As regards costs, it should be noted that: the purchase price of a new motor (i.e. subject of an analysis covered in the paper) is app. €700 whereas a general overhaul in an authorized service point amounts to app. €500. In comparison, the cost of repair in a private shop is €100, on average. Obviously, there are the downtime costs, but if the rate of putting the technological line out of production is comparable for new motors and reconditioned motors, then the cost calculation will favour a strategy based on repairs managed on one’s own. This becomes particularly justified when the number of these motors is between 80 and 100 per one technological line.
Before engineering a new method, it was necessary to analyze the methods already applied in diagnostics of electric motors. The methods of diagnosing induction motors are developing and are being modified both for the measurement procedure and signal analysis, which transmits the status. In general, such methods are divided into invasive and non-invasive. Invasive methods are usually employed in factories to check the insulation and to exclude manufacturing defects (complete and incomplete tests) [1] as well as following the general overhaul of a motor. The non-invasive methods serve to determine the condition of a motor without disassembly.
The methods of diagnosing induction motors can be divided by the type of investigated signals as featured in Fig. 1.
Fig. 1Classification of the methods of diagnosing induction motors [Own study]
![Classification of the methods of diagnosing induction motors [Own study]](https://static-01.extrica.com/articles/20713/20713-img1.jpg)
An analysis of these diagnostic methods for induction motors indicates that most of them are not suitable for the purpose of the study, i.e. to assess the condition of reconditioned high-speed motors.
The temperature measurement methods in engines can be divided into indirect and direct ones. For the indirect methods winding resistance is measured while for the direct methods temperature is measured by different types of sensors. According to the standard [9] it is acceptable to measure temperature of winding and other parts using the following three methods:
• Resistance method,
• Embedded temperature detector (ETD) method,
• Thermometers.
There is another temperature measurement method, which is not mentioned in the standard [9]. That method is based on using of thermal imaging.
Virtually all thermal methods require a longer testing time or real usage conditions. The methods based on determining the increments of temperature [10] necessitate taking the measurements at specific time and testing points. For electrical defects, such time may be relatively short, but with dynamic abnormalities, generating an increased temperature requires a longer time or may even be unnoticed.
Electrical diagnostics of motors is one the most commonly applied methods as it allows for assessing the technical condition of most engine parts [11, 12]. The electrical methods consist of diagnosis based on the analysis of supply current signals as well as investigating the electrical characteristics and features of the individual motor parts. Electrical diagnostics cannot be excluded from the assessment of reconditioned motors yet it is mainly dedicated to identifying damage to the rotor casing, stator and other electrical parts. In the literature [13-15], there are reports on applying electrical diagnostics for unbalance of the rotor, damage to bearings, non-centrical location in relation to the powered machine, damage to bearing casings and partial discharges in the insulation. However, considering the intermediate nature of typically electrical symptoms in relation to mechanical defects and practical experience in assessing high-speed motors, it is said that these methods are ineffective in controlling the post-reconditioning quality, as the following cases happen:
• Overlapping of supply frequency with rotational frequency – the lack of unambiguous assessment of unbalance;
• The motor current components, which carry information, are small in comparison with a dominant component of the main current spectrum;
• Most systems and most diagnosticians report the damage and abnormalities associated with the rotor when they analyse the current spectrum around the supply frequency [16-18]. It is necessary to have a measuring system with a sufficiently low level of noise and large dynamics of measurement to correctly identify damage to bearings.
Vibrational methods seem most suitable for verifying the mechanical accuracy of induction motor repairs. Such tests can be done on assembled motors, following electrical testing if the results are positive and regarded as the final stage of verification.
Among the vibrational methods, there are classical and special types, e.g. using the amplitude dimensionless discriminants of vibroacoustic processes, SPM (Shock Pulse Method), SPA (Shock Profile Area), SE (Spike Energy) by IRD, a method by Schenck – BCU (Bering Condition Unit), frequency analysis, such as CPB (Constancy Percentage Bandwidth), SEE (Spectral Emitted Energy) by SKF, HFD (High Frequency Detection), REBAM (Rolling Element Bearing Active Monitor) by Bentley, acoustic emission method, envelope detection and other [19-21].
The diagnostics of electrical motors also employ methods dedicated for these motors, e.g. a comprehensive method for motor diagnosing with an EXP4000 analyser, developed by SKF [22]. A diagnostic unit is organized based on a static analyser by Baker Instrument Company, enhanced with a dynamic analysis supported with the comprehensive preventative maintenance program. According to the manufacturer, this device can analyse the causes of motor operational errors, both mechanical and electrical. The EXP4000 analyser encompasses seven main functions of the preventative maintenance programs: supply quality tests, machine efficiency, current and spectrum testing, turning moment, VFD driver monitoring, dynamic analysis and constant monitoring.
To sum up the review of available methods for assessing the condition of electric motors and considering the purpose of the paper, it is concluded that:
• There is a lack of methods meeting the requirements of a repair shop in the furniture industry;
• Special methods with expensive measuring devices may comply with technological requirements, but they are not acceptable economically;
• Vibrational methods, based on the high- and low-frequency analysis with signal selection and the basic general measurements may be efficient and effective in post-repair assessments of induction motors, yet the cut-off values should be determined and the whole verification method should be precisely elaborated.
3. Methods of the study
The study was carried out on KNSR22.08-2 high-speed induction motors with the following parameters [23]:
• Power – 0.4 kW;
• Supply – 400 V;
• Rated current – 1.1 A;
• – 0.8;
• Rotational speed – 10,400 rpm
• Supply frequency – 200 Hz.
The KNSR22.08-2 motors are mainly used for machine units for plastics, wood and metal processing. A rotational speed of 10,000 rpm is generated with higher supply frequencies and a squirrel cage rotor construction. Furthermore, high-rotational bearings with C3 clearance are employed. The construction of such a motor is presented in Fig. 2.
Fig. 2A schematic construction of a KNSR22.08-2 motor, where: 1 – motor stator, 2 – motor winding, 3 – back casing, 4 – bearing 6002 FAG NBR+FE C3, 5 – motor fan, 6 – guard of back casing, 7 – screw M5x10, 8 – engine rotor shaft, 9 – bearing SKF Explorer 6005 - 2RZTN9 C3, 10 – front casing, 11 – spacing ring, 12 – screw M6x50, 13 – snap ring [23]
![A schematic construction of a KNSR22.08-2 motor, where: 1 – motor stator, 2 – motor winding, 3 – back casing, 4 – bearing 6002 FAG NBR+FE C3, 5 – motor fan, 6 – guard of back casing, 7 – screw M5x10, 8 – engine rotor shaft, 9 – bearing SKF Explorer 6005 - 2RZTN9 C3, 10 – front casing, 11 – spacing ring, 12 – screw M6x50, 13 – snap ring [23]](https://static-01.extrica.com/articles/20713/20713-img2.jpg)
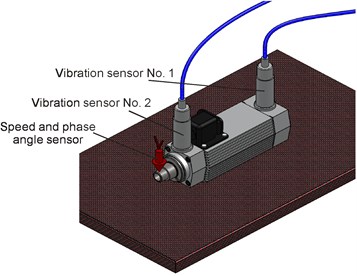
In total, ten motors were used in the study, including three new and seven reconditioned motors. The tests were carried out in a mechanical and electrical shop in the Swedwood Lubawa Veneer factory. The testing post included a shop table with a levelled Bakelite board, 30 mm thick and 600×600 mm in size. The motors were randomly placed on the board and supplied with a multi-functional Omron VS mini vector inverter, 1.1 kW, 400 V power supply and 200 Hz frequency. The vibration measurements were taken with a diagnostic KSD-400 analyser [24], to which the sensors recording the acceleration and velocity of vibrations were attached (Fig. 3).
The analyzer data with ICP 1000 sensors are as follows [24]:
1) Measurement ranges:
• Acceleration: 0-100 m/s2,
• Velocity: 0-100 mm/s,
• Amplitude of vibrations: 0-1000 µm.
2) Frequency measurement range: 2-5000 Hz.
3) Measurement resolution: 1 m/s2; 0,1 mm/s, 1 µm.
4) Sensor sensitivity 10 mV/m/s2.
Fig. 3A schematic representation of the sensor layout
The following plan of the study was adopted:
1) Setting the vibration characteristics for new motors: RMS values and peak vibration speed and acceleration amplitudes (, , , ) as well as the spectra of vibration speed and acceleration for different frequency ranges.
2) Setting the same characteristics as in section 1 for the reconditioned motors.
3) In the case of a significant difference in the results for new and reconditioned motors, the part of the repaired motors which the invalidity symptoms indicated was replaced and the measurement was repeated.
4) Determination of limit values for selected symptoms.
4. Results
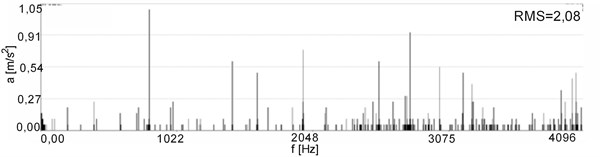
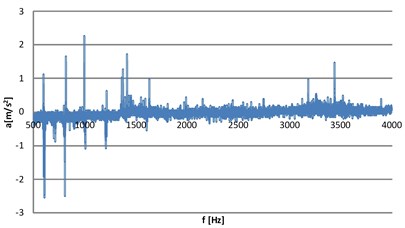
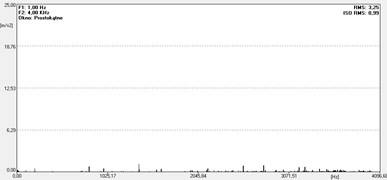
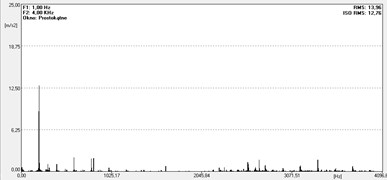
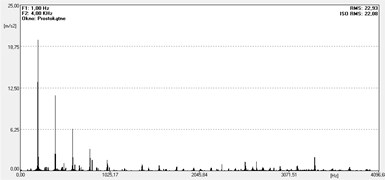
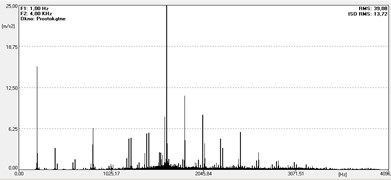
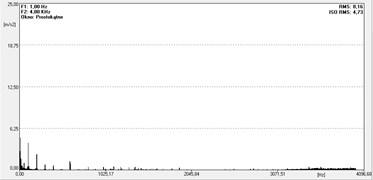
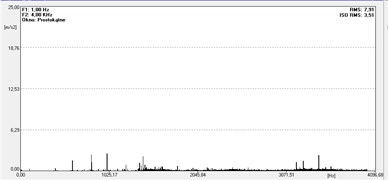
The first stage of the study consisted in comparing the results for new motors and it was found that they may be regarded as comparable and that therefore there was potential for determining the estimated values and images of model spectra. The exemplary vibrations spectra for a new motor are presented in Fig. 4 and for a reconditioned motor in Fig. 5.
Figs. 4 and 5 demonstrate that the differences between the characteristics of a new motor condition ( 0.32 mm/s; 0.28 mm/s) and the invalidity symptoms (for lower frequencies) following incorrect reconditioning ( 4.37 mm/s; 5.82 mm/s) are visible mainly in the vibration speed spectra. In the Fig. 5(b) the first harmonic is so dominating that it is hard to evaluate the other values in the spectrum. In such cases it is possible to use a logarithmic scale for the vertical axis or carry out frequency filtration to set down frequency ranges interesting for a diagnostician (Fig. 5(c)).
For instance, Fig. 6 presents a compilation of the vibration speed spectra for two new motors and three reconditioned motors.
The cascade graph (Fig. 6) clearly demonstrates the differences in the recorded values for motors No. 4 and 5 in comparison with the other motors. In the first case, the amplitude of rotational frequency is a dominant component, but there are also elevated vibrations for the frequency range 700-900 Hz. These are, in fact, the symptoms of incorrect operation of the rotor unit (for the imbalance) and excessive vibrations emitted by the bearing from a fan side; therefore, it may be concluded that there is incorrect fitting of the back casing of the bearing or low quality of the bearing. For motor No. 5, the rotational component is predominant. In turn, this is a clear symptom of an unbalanced rotor unit, but it cannot be clearly concluded to be the cause of such condition; it could also perhaps indicate unbalance of the rotor itself or a fan or non-centricity of the casings.
Fig. 4Vibration spectra for a new motor No. 1, sensor No. 1: a) acceleration, b) velocity
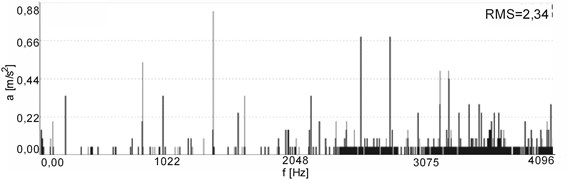
a)
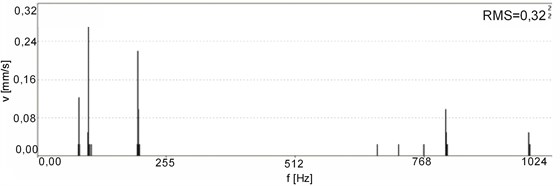
b)
Fig. 5Vibration spectra for a reconditioned motor No. 5, sensor No. 1: a) acceleration, b) velocity, c) velocity with frequency filtration
a)
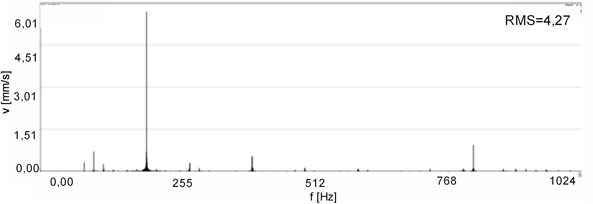
b)
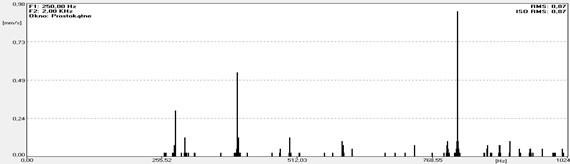
c)
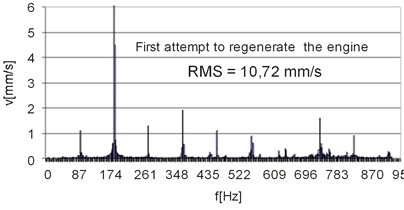
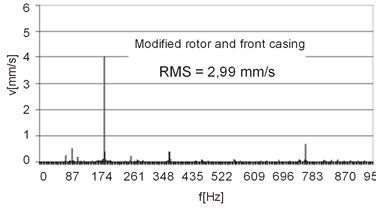
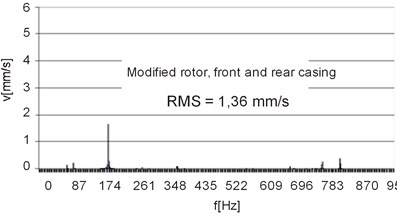
This has not been unequivocally addressed, but by trial and error it is possible to eliminated errors that occurred during repairs and get to the technical condition of a motor regarded as good and comparable with the condition of a new motor. Consecutive stages of corrections and results of measurements are given to illustrate such an approach (Fig. 7).
Fig. 6Cascade vibration speed spectra for new and reconditioned motors, measuring point No. 1
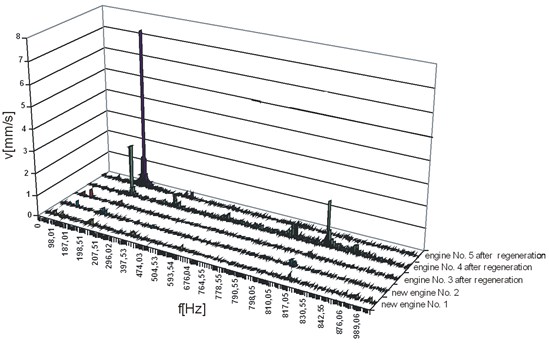
Fig. 7Vibration speed spectra for consecutive stages of the repair procedure of motor No. 6, measuring point No. 1
a)
b)
c)
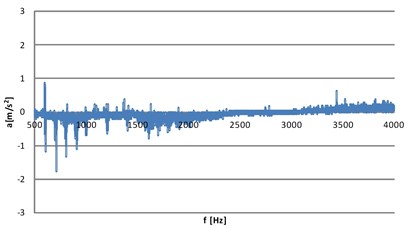
To increase the efficacy and efficiency of a repair evaluation protocol for the motors in question, it may be helpful to conduct an analysis of the vibration spectra based on differences Eq. (1) between the model spectrum and the investigated spectrum (Fig. 8):
where – model value of vibration amplitude; – number of reconditioned motor; – number of measuring point; – subsequent, recorded () frequency.
Fig. 8(a) shows that the condition of the repaired motor No. 3 is comparable with the model condition as the values of vibration acceleration are within 500-4000 Hz range, whereas motor No. 4 generates vibrations at a higher level (in the 500-2,200 Hz frequency range).
As mentioned above (based on the results presented in Fig. 5), the general condition of the tested motors can be assessed based on the RMS values and for amplifying this symptom, the trials aimed at setting dimensionless estimates were conducted and the value was defined as followed:
where , – RMS value and peak vibration acceleration amplitude, determined from -number frequency range. The other designations are as in the Eq. (1).
Fig. 8Differences between the model spectrum and the investigated spectrum, measuring time-point No. 1: a) motor No. 3, b) motor No. 4
a)
b)
Finally, the set of cut-off values and their interpretation were established as presented in Table 1.
Table 1Cut-off values for the assumed diagnostic symptoms
Evaluated parameter | Cut-off values | Interpretation |
( 7-1000 Hz) | Below 0.8 mm/s | Good condition |
0.8-1.2 mm/s | Acceptable condition, please check: | |
1.2-1.8 mm/s | Still acceptable condition, please check: and | |
Above 1.8 | Unacceptable condition, please check: and | |
( 500-4000 Hz) | Below 1.5 m/s2 | Good condition |
1.5-3.0 m/s2 | Sufficient condition, please check: and | |
3.0-4.5 m/s2 | Still acceptable condition, please check: and | |
Above 4.5 m/s2 | Unacceptable condition, please check: and | |
( 7-1000 Hz) | Above –1.3 mm/s | Acceptable condition |
From –1.3 to –1.8 mm/s | Identify the frequency for which values are lower than –1.0 mm/s | |
Below –1.8 mm/s | Unacceptable condition, correction is warranted | |
, ⟨2200-3500 Hz⟩ | Below 1,5 | No symptoms of damage due to: |
1,3-3 | Replace the bearing housing | |
Above 3 | Unacceptable condition, correction is warranted |
5. Database of examples of mistreated regenerations
The evaluated limit values (Table 1) occurred to be effective to determine the general condition of regenerated motors but they do not allow identifying specific incorrectness. That was a reason to create a database of invalid regenerations mapped in vibration acceleration spectra. This process has not been completed and further continuous investigation is needed but some examples of “invalid repair – symptom in the form of vibration acceleration spectra” might be quoted (Fig. 9).
Fig. 9Vibration acceleration spectra for different states after regeneration of KNSR22.08 motor: a) good state, b) unbalance, c) unbalance and misalignment of rotor, d) unbalance and bad quality of bearing, e) slackness in bearing housing, f) bad quality of bearings
a)
b)
c)
d)
e)
f)
6. Operational research
The purpose of the operational research is to determine time to repair characterized by the Mean Time Between Failure (MTBF) – the tests are in progress and correction of MTBF values is being carried out. Based on the already obtained results it is possible to present the MTBF characteristic in the form of Table 2.
Table 2MTBF values for different evaluation of states of KNSR22.08 motors after regeneration
Evaluation of state according to the new method (Table 1) | Quantity of motors | MTBF [h] | Root mean square deviation [h] | Time range between repairs [h] |
Lack of evaluation – operation authorization without vibration diagnostics | 320 | 4250 | 3252 | 200-8300 |
Acceptable state | 37 | 6125 | 1435 | 5100-7130 |
Good condition | 25 | 7300 | 565 | 6860-8250 |
According to the Table 2, application of the motors state control method after regeneration considerably increases value of the MTBF and decreases range of time between repairs, which simplifies prognosis and planning of repairs.
7. Conclusions
Based on the carried out experimental research and preliminary operational tests it may be said that proposed vibration method of verification of state of regenerated motors fulfills expectations of technology improvement of their repairs.
The approved set of the limit values lets interpret in the easy way the verification research results and it lets evaluate the dynamic state of induction motors after regenerations.
The created set of the standard spectra lets identify some of inoperable states, for example unbalance, misalignment, too close and clearance fit, faults of rolling bearings. For instance, a set of bought bearings was identified for which the vibration acceleration spectra deviated significantly from the standard spectra (in the range 1500-3000 Hz) and the bearings were removed from the spare parts warehouse.
There might arise repairs where cumulated incorrectnesses occur (for example, unbalance, too close fit of bearings and bad quality of bearings). In that case it is hard to develop a clear diagnosis. In the dynamic configuration interactions of big energies often force answers similar to other reasons. Despite that the developed verification method does not allow for hundred-percent identification of a fault regeneration, nevertheless a correction of a repair might be applied in several stages.
The disadvantage of this method is lack of information on the state of parts of the motor. Considering that the tests follow an electric verification procedure (according to the obligatory standards) the method may be regarded as a complementary to the whole quality control process of a repair.
If the verification tests are replenished by the operational tests there is a possibility to create the trend line of changes of state of the motor. It would considerably simplify tasks planning for maintenance services. Based on the already carried out operational tests it was found that durability of motors for which the limit values of good condition state are not exceeded (Table 1) is on average six times greater than motors for which no vibration verification was done prior to operation authorization.
References
-
Zembrzusk J. Damage and Repair of Electric Motors. WNT, Warszawa, 2005.
-
Jung J., Nam K. A dynamic decoupling control scheme for high-speed operation of induction motors. IEEE Transactions on Industrial Electronics, Vol. 46, Issue 1, 1999, p. 100-110.
-
IEC 60034-1. Rotating Electrical Machines – Part 1: Rating and Performance.
-
IEC 60034-2-1. Rotating Electrical Machines – Part 2-1: Standard Methods for Determining Losses and Efficiency from Tests.
-
IEC 60034-4. Rotating Electrical Machines – Part 4: Methods for Determining Synchronous Machine Quantities from Tests.
-
IEC 60034-12. Rotating Electrical Machines – Part 12: Starting Performance of Single-Speed Three-Phase Cage Induction Motors.
-
IEC 60034-15. Rotating Electrical Machines – Part 15: Impulse Voltage Withstand Levels of Form-Wound Stator Coils for Rotating A.C. Machines.
-
Lektronix Test Rig Facilities. Lektronix, https://www.lektronix.pl/test-rigs.
-
IEC 60034-11. Rotating Electrical Machines – Part 11: Thermal Protection.
-
Błażej R., Sawicki M., Konieczna M., Kozłowski T., Kirjanów A. Automatic analysis of themrograms as a means for estimating technical of a gear system. Diagnostyka, Vol. 17, Issue 2, 2016, p. 43-48.
-
Chang H. C., Lin Kuo S. C., C. C., Hsieh C. F. Induction motor diagnostic system based on electrical detection method and fuzzy algorithm. International Journal of Fuzzy Systems, Vol. 18, Issue 5, 2016, p. 732-740.
-
Paduch P., Szymaniec S. Instrumentation and Metrological Aspects of Electrical Machine Diagnostics Based on Current Signal. Opole University of Technology. Problem Papers – Electric Machines No. 90/2011, 2011.
-
Subocz J., Szrot M., Plowucha J. Modern Methods of Insulation Diagnostics of Motors and Generators WN. Problem Tests – Electrical Machines No. 74/2006, 2006.
-
Antol M., Kowalski C. T. Detecting Defects of Rolling Element Bearings of Induction Motors Based on Spectral Analysis of Acceleration of Vibrations. Scientific Work of Institute Electrical Machines, Drives and Measurements of Wroclaw Technology University No. 54 Studies and Materials No. 23, Wroclaw, 2003.
-
Budik T., Jankovych R., Hammer M. Operational limits in vibration diagnostics. Advances in Intelligent Systems and Computing No. 393, Springer International Publishing, Switzerland, 2016.
-
Garcia-Escudero L.-A., Duque-Perez O., Fernandez-Temprano M., Morinigo-Sotelo D. Robust detection of incipient faults in VSI-fed induction motors using quality control charts. IEEE Transactions on Industry Applications, Vol. 53, Issue 3, 2017, p. 3076-3085.
-
Aimer A. F., Boudinar A. H., Benouzza N., Bendiabdellah A. Use of the root-ar method in the diagnosis of induction motor’s mechanical faults. Revue Roumaine Des Sciences Techniques-Serie Electrotechnique Et Energetique, Vol. 62, Issue 2, 2017, p. 134-141.
-
Strączkiewicz M., Czop P., Barszcz T. Supervised and unsupervised learning process in damage classification of rolling element bearings. Diagnostyka, Vol. 17, Issue 2, 2016, p. 71-80.
-
Devi N. R., Sarma D. V. S. S. S., Rao P. V. R. Diagnosis and classification of stator winding insulation faults on a three-phase induction motor using wavelet and MNN. IEEE Transactions on Dielectrics and Electrical Insulation, Vol. 23, Issue 5, 2016, p. 2543-2555.
-
Sheikh M. A., Nor N. M., Ibrahim T. A new method for detection of unbalance voltage supply in three phase induction motor. Jurnal Teknologi, Vol. 78, Issues 5-8, 2016, p. 7-12.
-
Wodecki J., Zdunek R., Wyłomańska A., Zimroz R. Local fault detection of rolling element bearing components by spectrogram clustering with semi-binary NMF. Diagnostyka, Vol. 18, Issue 1, 2017, p. 3-9.
-
Kańiar L., Zvolenský P., Barta D., Bavlna L., Mikolajčík M., Droździel P. Diagnostics of electric motor of locomotive series 757. Diagnostyka, Vol. 17, Issue 3, 2016, p. 95-101.
-
SKF Dynamic Motor Analyzer – EXP4000. SKF USA, Electric Motor Condition Monitoring, McMurry Avenue, Fort Collins, CO 80525 USA, 2014.
-
Walter Perske GmbH. Catalog: Special Electric Motors. Part A: High-speed machining motors. Mannheim, 1012, http://www.perske.de/en/products/product-overview/high-speed-machining-motors.html.
-
Description of KSD Analyzer and IPC 100 Sensors. Sensor, http://www.sensor.pl.
Cited by
About this article

