Abstract
The conventional methods for vibration fault detection and diagnosis relies on feature extraction from the waveforms of the vibration signals. This article exploits the scope of image recognition application for the detection and diagnosis of fan vibration faults. In this paper, a novel image recognition technique is proposed for vibration-based fault diagnosis using the spectrum images of the vibration signals. 1D vibration signal spectrum is initially computed using Fast Fourier Transform (FFT) and the FFT frequencies are adjusted such that it captures a vibration spectrum diagram as 2D image representation. FFT based vibration analysis is done and the image recognition concept is utilized for feature extraction and a machine learning classification module is used for fault analysis and diagnosis. Effective feature generation is done using Principal Component Analysis (PCA) by removing the redundancy from the feature vectors and machine learning classifiers are used to obtain improved image recognition and classification performance. Artificial Neural Network (ANN) classifier yields better performance in terms of various performance parameters and percentage improvement in terms of accuracy for ANN classification methods over Support Vector Machine (SVM), k-Nearest Neighbours (kNN) and Random Forest Ensemble (RFE) methods are 10.01 %, 4.51 % and 2.01 % respectively. Comparative scenarios are considered in this work for fan vibration fault detection as well as diagnosis based on the image features for various realistic vibration fault conditions. Effectiveness of the proposed image recognition-based technique is compared with the state-of-the-art methods, justifying its outperformance for fan fault detection and diagnosis using the combination of spectrum adjustment, PCA and ANN classification method.
Highlights
- The effect of machine operation conditions on the vibration spectrum are minimized using the adjustment techniques.
- The adjusted signal spectrum having the optimized features are used for image feature extraction to obtain relevant features for fault diagnosis.
- Optimal feature reduction using PCA yields in effective feature generation for the effectual classification by removing the redundancy from the feature vectors.
- The improved image recognition and classification performance is achieved for different operating conditions by using the optimal spectrum image features.
1. Introduction
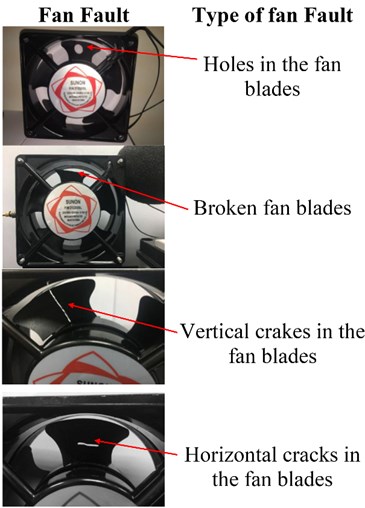
The detection as well as diagnosis of various types of faults has become crucial in the modern engineering systems for the encouragement of condition monitoring methods and prevention of system degradations due to early-stage faults. These faults if not detected at the early stage, may lead to catastrophic system failures, if they are not diagnosed at the initial stages [1]. The fan faults influence the safety operations of a power plant and its efficient operation determines the reliability, security and economy of the system. These faults provide the real time status evaluation, its accurate diagnosis and repair. The research on the fan fault diagnostic systems is of significant importance as it enhances the capabilities of running state during a fan operation. The fan fault diagnosis assesses the vibration signal generation during the fan rotation and it is directly linked to the nature, level and position of the mechanical fault failure. The fan-based diagnosis based on the vibration signals are convenient to detect, have wide applicability and have gained the researchers’ interest by being widely used for fan fault monitoring and diagnosis. The conventional methods of fault detection and diagnosis are primarily focused on time domain or frequency domain analysis; however, utilization of fan’s non-stationary characteristics have provided the third dimension in fault analysis domain [2]. Using the fan-based fault analysis, the low magnitude signal can easily be compared to the background noise and thus, overcoming the limitation of the general signal analysis methods by the utilization of vibration signal-based fan diagnosis [3, 4]. Different types of fan faults are depicted in Figure 1 describing the artificially induced fan fault types and its image.
Fig. 1Different types of artificially induced fan faults
The majority of fault diagnosis methods are based on vibration signal analysis [5-7] and the main steps included in the diagnostic procedure are vibration feature extraction and feature classification using specific classifier. The improvement of diagnostic performance depends upon two major factors. One is the extraction of relevant features for the representation of fault vibration signal characteristics [8, 9]. The other governing factor is the choice of classifier that has the stronger abilities to classify the vibration characteristic features into fault classes. The features extracted for vibration signal may be time domain or frequency domain features which are then represented as one-dimensional vector form to provide the specific vibration signal characteristics distinguishing different forms of the faults. The fault feature extraction step is followed by the fault classification for the recognition of corresponding health state of the system. Various machine learning classifiers may be used for faulty state classification like -Nearest Neighbour (kNN), Artificial Neural Network (ANN), Support Vector Machine (SVM) classifier, etc [10, 11]. These classifiers perform well when supplied with the proper specific features which provide acceptable accuracy performance for fault diagnosis [12]. However, this performance may vary and degrade due to the presence of heavy noise in the fault sample signals. This performance may further significantly degrade, if the smaller number of samples are present. For the performance enhancement, deep neural network-based approaches are significantly been applied for fault diagnosis but such methods require a very large number of training samples, thereby increasing the computational power. This may further degrade the system performance increasing the training efforts leading to high computation complexity. Thus, a robust and reliable feature extraction as well as classification method is required for further investigation and performance improvement of fault diagnosis systems.
This work contributes in the providing an enhanced fault diagnosis approach for fan faults by focusing on extraction of effective fault features while using the vibration signal spectrum images for image recognition. In this article, the authors have used the image recognition concept utilizing the feature extraction as well as a classification module for fault analysis and diagnosis. The vibration image samples are considered for this study and the vibration signal spectrum is computed using the Fast Fourier transform (FFT) method. The effects of rotating speed frequency are minimized using the adjustments in the frequency lines of the spectrum and this is captured as a 2D spectrum image. The FFT frequencies of 1D vibration signal are adjusted such that it captures a vibration spectrum diagram as 2D image representation of 1D vibration spectrum. The feature characteristics are obtained for this 2D image using the feature extraction module which are further reduced to optimal feature set using the Principal Component Analysis (PCA) module. Fault classification based on image recognition is done using the machine learning classification approach. The major contributions of this work are highlighted in the following points:
1) The effect of machine operation conditions on the vibration spectrum are minimized using the adjustment techniques.
2) The adjusted signal spectrum having the optimized features are used for image feature extraction to obtain relevant features for fault diagnosis.
3) Optimal feature reduction using PCA yields in effective feature generation for the effectual classification by removing the redundancy from the feature vectors.
4) The improved image recognition and classification performance is achieved for different operating conditions by using the optimal spectrum image features.
The rest of the article is arranged as: Section 2 presents the literature review of state-of-the-art methods in the field of fault diagnosis and detection. Section 3 includes the material and methods followed by results and analysis in Section 4. Section 5 presents the concluding remarks of the entire article including the future perspective recommendations in this field.
2. Literature review
There exist various fault detection and diagnosis techniques based on data driven methods. These techniques use various data acquisition devices for the measurement of vibrations, temperature, pressure and emission of different acoustic features. Particularly, for the analysis of stator monitoring [13] and rotor analysis [14]. Vibration monitoring have been the area of interest for various researchers using different transformation methods for analysis [15-18]. The vibration bearing as well as fan faults are classified using a set of features which are extracted from the raw vibration signals [19]. The useful features are extracted from the acquired vibration signal using the discrete or fast Fourier transform [20], variants of wavelet transform [21, 22], envelop detectors [23, 24] or statistical approaches like principal component analysis or linear discrimination analysis [25-29].
The authors in [30] presented a cooling fan fault diagnostic approach using the vibration and acoustic analysis. Cooling fans are susceptible to machine vibrations and therefore require effective monitoring methods for prediction, prevention and addressing the faults for successful industrial operations. The identification of typical faults is done for measuring the vibrations as well as noise produced by the cooling fans using the vibrational analysis along with acoustic assessment. The authors in [31] summarises the recent related work in the field of bearing fault detection being carried out for detecting the machinery faults and diagnosis. They study various literatures emphasizing the usage of deep learning algorithms, machine learning and other approaches. The authors in [32] presented an automated diagnosis system for the fault detection of ball bearing in the industrial motors on the basis of statistical indicators using adaptive neuro based fuzzy inference system. This approach uses the statistical indicators for feature extraction from the raw vibration signal which are then classified into various bearing faults. The effectiveness of this method is justified by the results obtained for reliable detection and this technique can classify the faults into different types. The authors in [33] proposed a novel deep learning-based method for identifying the rolling element-bearing fault. This method is capable of operating on the raw vibration signals for the diagnosis of bearing faults of the electromechanical systems. The outcomes were observed on the benchmark datasets which outperforms the existing state of the art methods for vibration analysis and noise rejection.
The extraction of feature attributes is in time or frequency domain in this area. The time domain analysis has physical significance however, the frequency domain analysis purely depends upon the statistical feature extraction [34, 35]. The extracted features are in vector or scalar form that depicts the parameters from spectral analysis in frequency domain or in the form of a statistical vector indexing. Every individual feature describes the individual aspect of the acquired vibration signal and these features are combined to improve the performance of fault detection as well as diagnosis. Different techniques can be used for determining the multiple features in various domains like time domain, frequency domain or statistical domain [36, 37].
The literature review suggests that the fusion techniques employed for the feature combination increases the complexity of algorithms and the outcomes are also not interpreted, weather the favourable outcomes will be achieved or not. Feature extraction also leads to higher dimensionality which is the key issues due to the large number of features. Therefore, this situation arises the need for a specific dimensionality reduction module for the health monitoring of vibration systems. Thus, this paper aims at providing an image based efficient recognition and classification approach for vibration-based fault detection under various variable faulty conditions.
3. Material and methods
This section discusses the description of the fan, fan vibration signal measurement and its acquisition along with the simulation environment developed for the experimentation in this article.
3.1. Description of fan and data acquisition system
The experimentation for mechanical vibration measurement is conducted on the fan used for domestic power plants in industries. The simulation for mechanical fault characteristics of the centrifugal fan is conducted that has high potential and are significantly important for practical industrial applications at various power points. The fan structure used in this article is depicted in Fig. 2.
Fig. 2Fan structure used for experimentation
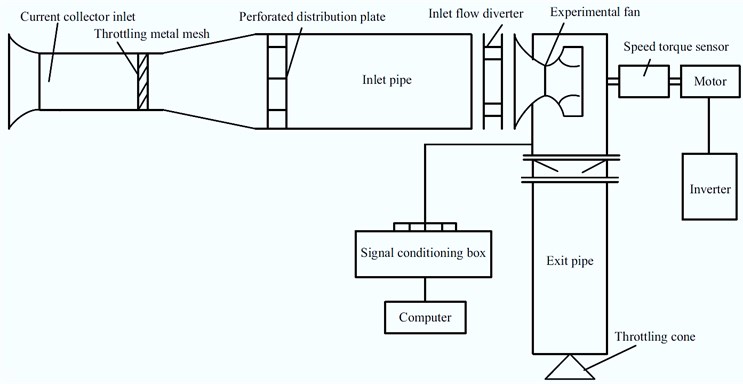
This fan structure used for the experimentation includes 12 blades, a front and a rear disc which are welded using the ordinary steel plate. The inlet of the fan includes a convergent and a streamlined collector along with the installation of an axial guide vane which adjusts the flow of fan. The pipelines at the inlet as well as the outlet are connected with the fan as well as a signal conditioning unit for the signal adjustment, so as to minimize the effect of machine operation conditions on the vibration signal using this adjustment mechanism. The vibration signal data is acquired from this fan structure using the data acquisition model depicted in Fig. 3.
Fig. 3Vibration signal data acquisition model
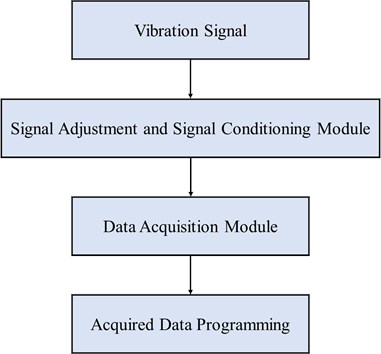
This article simulated various running states of the fan and the fan faults are tested using the vibration signal data collected for these states using the model depicted in Fig. 3. For each of the running state, 50 vibration signals are sampled using individual sensors. This fan structure consists of a totality of 65 sensors therefore the total samples collected are 65×50 = 3250 vibration samples. The sampling frequency of 1600 Hz and the fan speed of 1200 rev/min were considered for this particular experimentation.
3.2. Methodology of the proposed framework
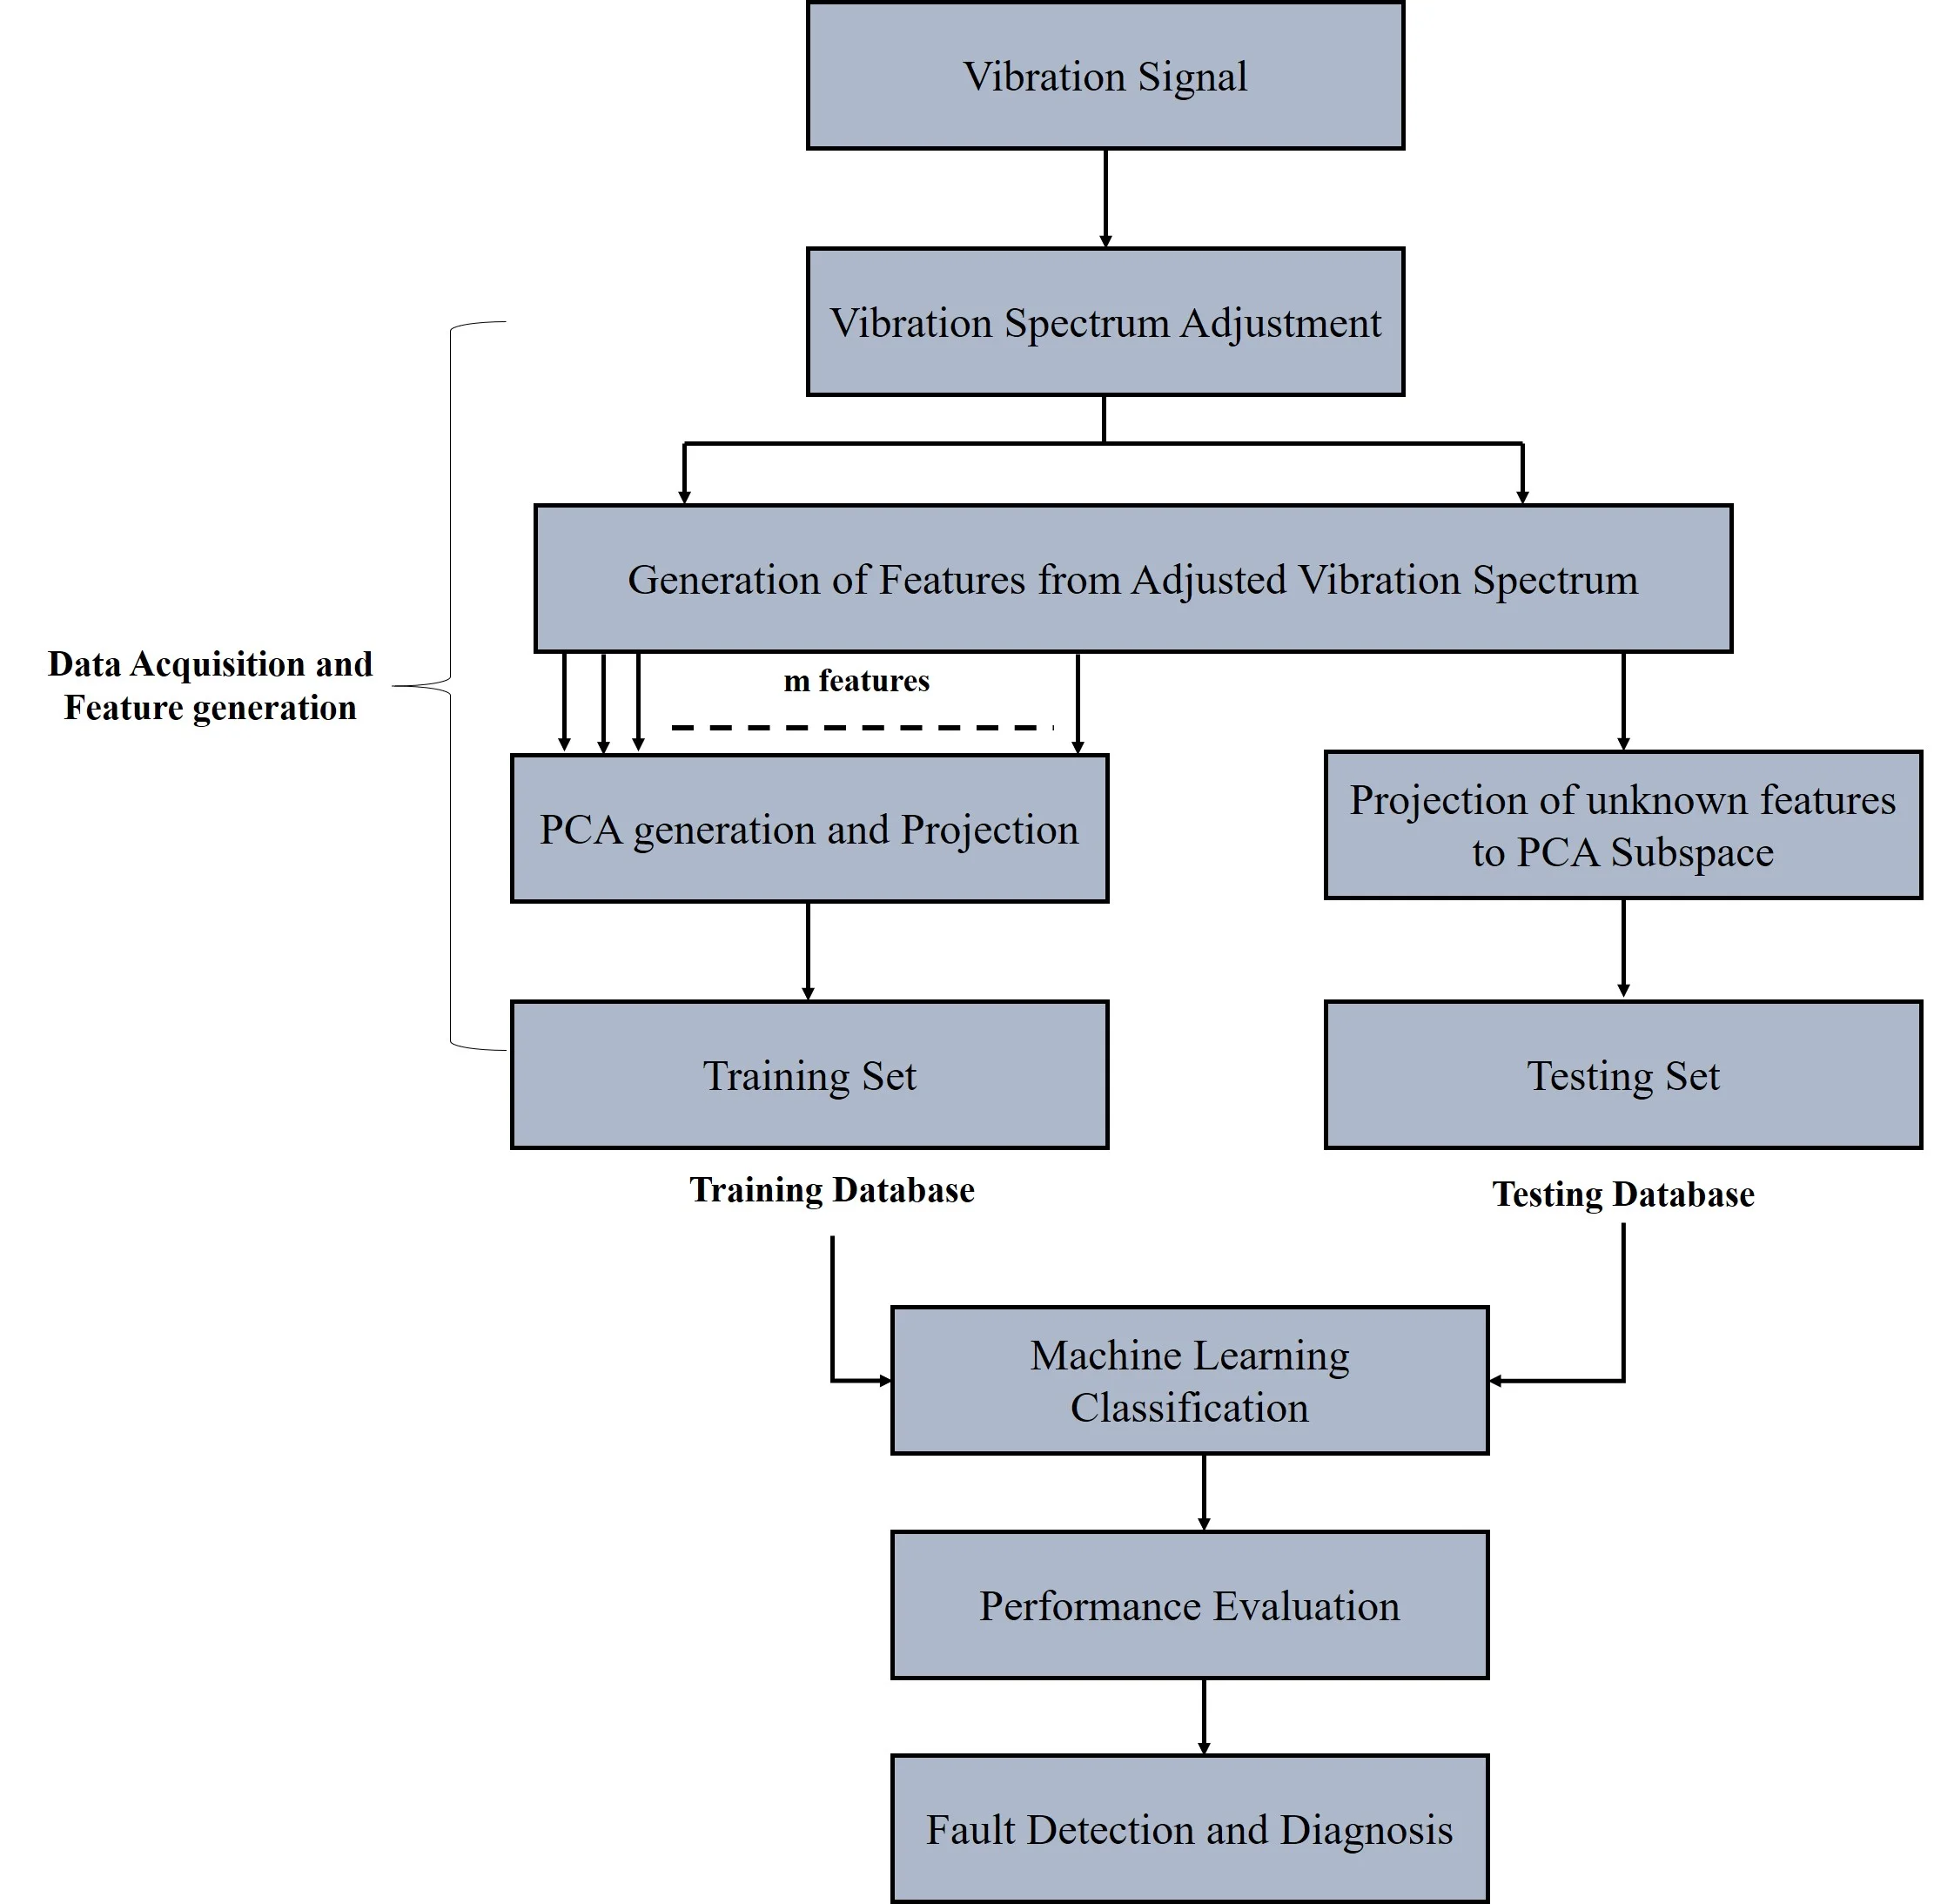
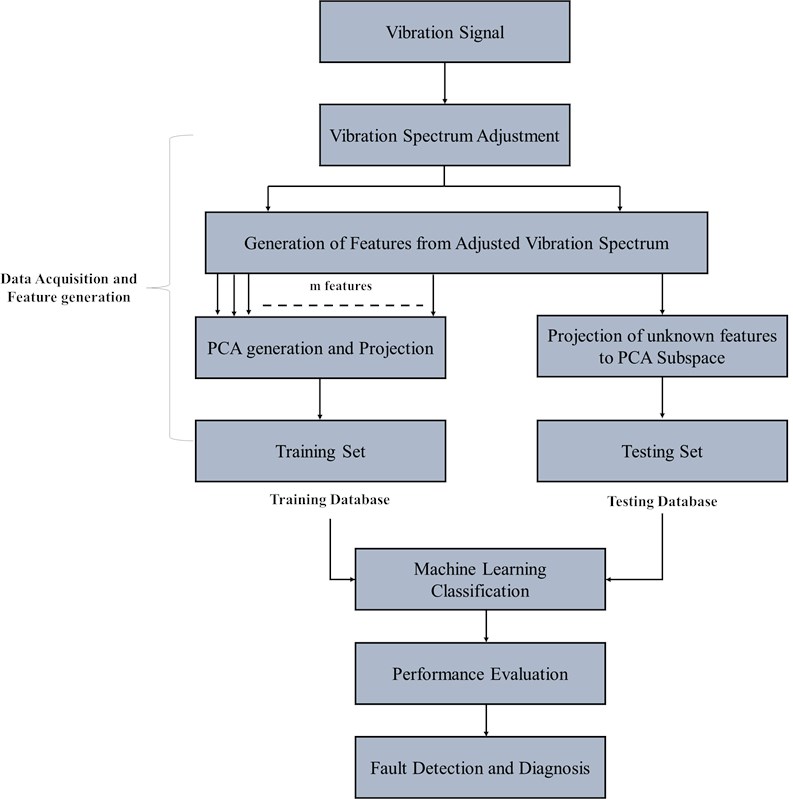
This article proposes a novel approach for fan fault detection and diagnosis using the image processing and recognition mechanism. The utilization of image recognition techniques for fault detection and analysis is to generate the features as images from the vibration signals. The acquired vibration signals are converted to images using the Fast Fourier Transform (FFT) mechanism in order to generate the image-based features from the vibration signals operating at different conditions (faulty or healthy) [38]. The fan faults are detected and different faulty conditions are diagnosed like fan blade holes, broken blades, vertical or horizontal cracks in the fan blades. Further the dimensionality reduction is applied using the Principal Component Analysis (PCA) mechanism and the faults are recognized using various machine learning classification approaches. The entire process of the proposed framework is depicted in Fig. 4.
3.2.1. FFT based vibration signal spectrum adjustment
The 1D vibration signal spectrum is computed using FFT containing the fan fault information for the diagnosis of fault state. The FFT frequencies are adjusted in the frequency spectrum as per the rotating speed of the fan using the formula computed using Eq. (1):
where indicates the average rotating speed of the fan in hertz, is the range of th frequency line in the original frequency spectrum and is the th frequency line for adjusted vibration frequency spectrum.
This adjustment of the vibration frequency spectrum is followed by the capturing of vibration spectrum diagram as image and representing the 1D vector coefficients into a 2D image representation of the vibration spectrum. This representation provides more relevant information comparative to the 1D vector representation. Spectrum adjustment as per the rotating speed aids in obtaining the robustness against the fan speed. These images are subjected to spectral feature extraction. The features obtained for adjusted vibration spectrum are relatively larger, therefore leading to great computational efforts. Thus, to aid this, feature processing is required which is done using the PCA dimensionality reduction.
Fig. 4Proposed image recognition-based framework for fan fault detection and diagnosis
3.2.2. PCA based feature reduction
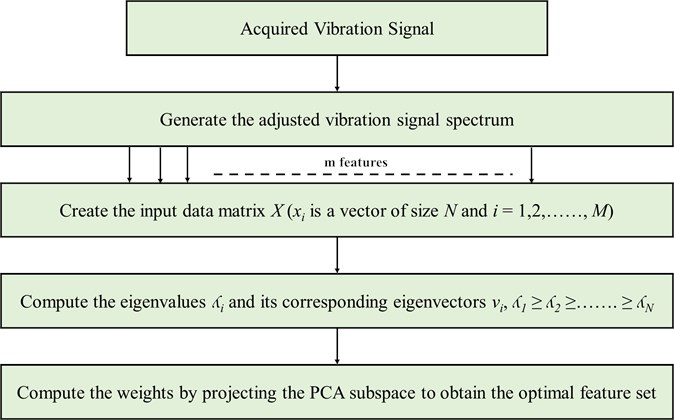
Principal component analysis is basically a type of dimensionality reduction method for the representation of image information. The original image matric is used in this method to obtain the covariance matrix of the image and then the eigenvectors are computed for the feature extraction of the image [39]. This linear transformation is responsible for the removal of data redundancy and is successfully applied to the image recognition and classification processes. The flowchart of entire process of PCA based feature extraction is shown in Fig. 5.
Fig. 5Flowchart of PCA based feature reduction
3.2.3. Classifiers employed for fault recognition and classification
The fault recognition is done using various machine learning classifiers and fault classification is done into different fault classes; fan blade holes, broken blades, vertical and horizontal cracks in the fan blades. The different classifiers used in this study are.
3.2.3.1. Support vector machine (SVM)
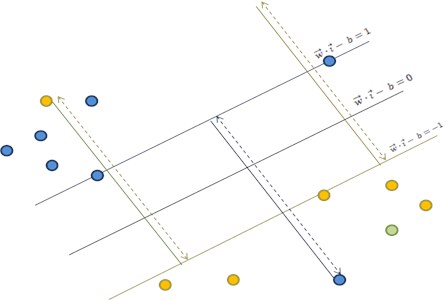
Support vector machine classifier is a linear separable classification approach that uses a hyperplane for the division of training samples into different fault classes. The labelled data is used in this method for creating a hyperplane and the two suitable methods are used to achieve this task: one deals with the finding out of an optimal decision hyperplane to bisect the convex hull using the two closest samples and the other one deals with the optimal decision making utilizing the maximal hyperplane margin between the two parallel supports. These two methods are highly applicable for finding out the support points as well as the optimal decision hyperplanes [40]. The equation for hyperplane representation for the input vector, weight vector and bias are given by Eq. (2):
The SVM hyperplane is presented in Fig. 6.
The tuning parameters used to achieve better accurate classification results are regularization parameter and gamma. Regularization parameter is used to avoid misclassification of each training example and gamma parameter defines the effect of each training example for classification.
3.2.3.2. -Nearest Neighbours (kNN)
The k- Nearest Neighbours (kNN) classification method is the simplest approach that separates the data samples into various classes depending upon the Euclidean distance between - nearest neighbours in the dataset. As per the value of each of the features in the feature space, a -dimensional space is created for each of the training sample. Thus, during the testing phase, testing samples are represented in the similar space by obtaining its -nearest neighbours [41]. The voting procedure is carried out and the -nearest neighbours with the higher voting probability are used for classification of the testing samples using the Euclidean distance. The expression for Euclidean distance between samples and for number offeatures is expressed by Eq. (3):
Fig. 6SVM Hyperplane
3.2.3.3. Random forest ensemble classifier (RFE)
Random forest ensemble classifier (RFE) model is utilized for classification and regression using the grouping of decision trees. RFE classification is machine learning approach which combines several decision trees to yield better performance as compared to a single decision tree. This is a tree-type component predictor method using the classifier approach. This is a very popular classification method due to its better accuracy performance among its other counterparts [42]. Ensemble classifier involves training of multiple models to obtain increased accuracy. The classification accuracy is improved by the growing of the ensemble tree using the voting procedure. This method is mostly suitable for random vector generation using random selection procedure from integrated training set. The ensemble approaches used for DR severity classification are Bagged trees and subspace discriminant approach. Bagging method is an effective ensemble classifier method as it reduces the prediction variation by producing multiple sets from the original dataset using combinations with repetitions.
3.2.3.4. Artificial neural network classifier (ANN)
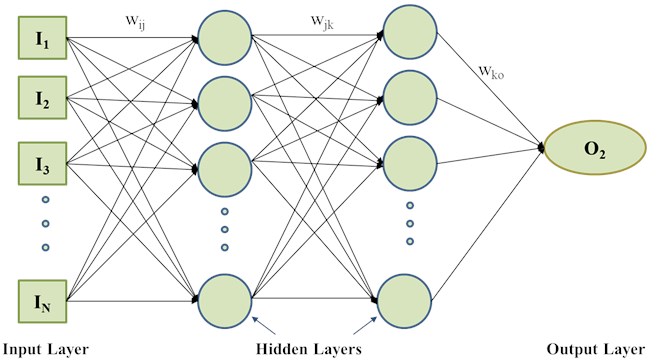
The artificial neural network (ANN) classifier is used to obtain the complex decision boundaries in the feature space by approximating the Bayesian posterior probabilities at its outputs [43]. Several parameters are chosen by the ANN classifier including the number of training samples, the number of hidden nodes, and the learning rate for classification performance improvement. However, the performance is not priori possible as with other non-parametric approaches to pattern classification [44]. The performance of ANN is determined by the weight updation, propagation function and the learning rule. If indicates the output of the preceding neuron then input to the th neuron is determined by propagation function expressed in Eq. (4):
where is the propagation function, is the output of the preceding neuron, is the weight and is bias. The neural network parameters are modified by the learning rule such that the favourable network outcome is obtained. The presentation of ANN classifier depicting its layers is done in Figure 7.
Fig. 7Layered presentation of ANN classifier
The performance parameters which can be derived from true positives (TP), true negatives (TN), false positives (FP) and false negatives (FN) are used for evaluating classification performance of NN classifier. The parameters include Accuracy (ACC), Sensitivity (SEN), Specificity (SP) and Positive Prediction Value (PPV).
1) Accuracy (ACC): It defines the percentage of exactly corrected outcomes obtained out of the total number of events. The formula for ACC. is expressed by Eq. (5):
2) Sensitivity (SEN): The percentage of accurately indicated faulty class cases which actually possess some kind of fan fault are indicated by this value. It is also called true positive rate and is expressed by Eq. (6):
3) Specificity (SEP): Specificity provides the higher probability of truly indicated non-faulty class without giving the false positive outcomes. It is expressed by Eq. (7):
4) Positive Prediction Value (PPV): This value indicated the correctly or precisely obtained accurate results from the total number of positive predictions. PPV is expressed by Eq. (8):
4. Results and discussion
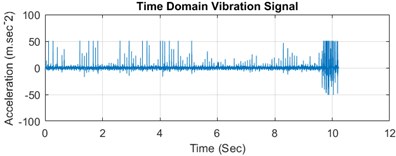
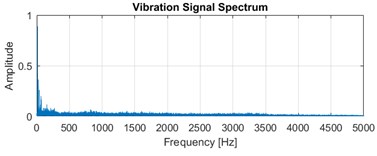
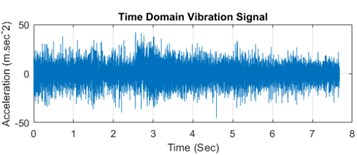
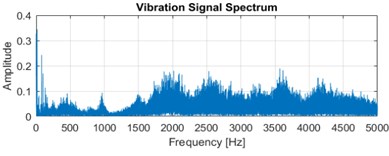
The outcomes of the experimentation are observed in terms of various performance parameters. The proposed work is carried out by FFT spectrum generation and then the spectrum is adjusted which is then subjected to image conversion. The initial 1D time domain vibration signals are analysed and depicted in Fig. 8(a) for the normal sate and Fig. 8(c) for the faulty state.
Fig. 8a) Time domain vibration signal and b) vibration spectrum of healthy signal; c) time domain vibration signal and d) vibration spectrum of faulty signal
a)
b)
c)
d)
From Fig. 8, it is depicted that the vibration spectrum of the healthy signal is smooth as depicted in Fig. 8(b), whereas the vibration spectrum of the faulty signal is distorted which is shown in Fig. 8(d). The 1D vibration signal depicted in Fig. 8 are converted to 2D images, which are further subjected to feature reduction employing the PCA methodology which are further classified into faulty and healthy states using various machine learning classification approaches. The corresponding 2D vibration spectrum diagrams for healthy and faulty signal are provided in Fig. 9.
Fig. 9(a) provides the corresponding 2D vibration diagram for healthy 1D vibration spectrum represented in Fig. 8(b) and the 2D vibration diagram for faulty 1D spectrum (given in Fig. 8(d)) is represented in Fig. 9(b).
Fig. 9Corresponding 2D vibration spectrum diagrams a) for healthy vibration signal and b) for faulty vibration signal
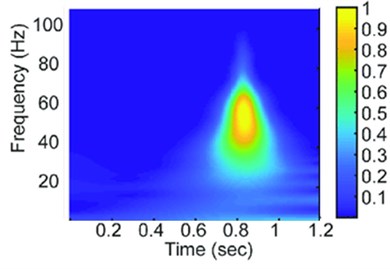
a)
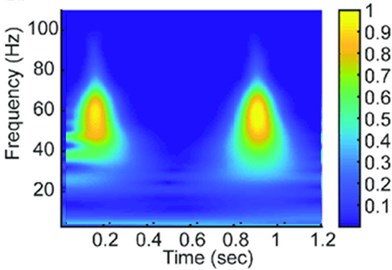
b)
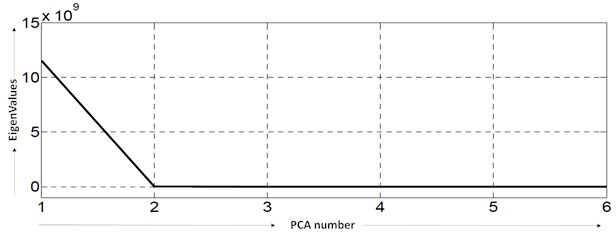
PCA is applied on the adjusted vibration spectrum to obtain the optimal features for the classification of healthy and faulty features. The optimal features are obtained using the eigenvalues for fault detection and diagnosis. The projection of adjusted vibration spectrum features is done to a 1D PCA subspace which is depicted in Fig. 10.
This plot indicates considering a single principal component, the optimal precision level can be achieved, however, as indicated in Fig. 10, six (6) principal components are retained after dimensionality reduction in order to attain significant performance.
Fig. 10Projection of adjusted vibration signal features to 1D PCA subspace
4.1. Classifier based analysis for fan fault detection
PCA based feature selection is followed by machine learning based fault classification using different classifiers such as support vector machine (SVM), k-Nearest neighbour (kNN), random forest ensemble (RFE), and Artificial Neural Network (ANN) to compare the effectiveness of the proposed framework. For evaluation purpose, Accuracy, sensitivity, specificity and positive prediction value. The performance evaluation parameter values obtained for image recognition based different classification approaches are tabulated in Table 1.
Table 1Performance evaluation parameters obtained for different classification methods
Classifier | Parameters | |||
ACC | SEN | SEP | PPV | |
SVM | 90.00 % | 90.83 % | 89.19 % | 89.19 % |
kNN | 94.74 % | 96.12 % | 93.40 % | 93.40 % |
RFE | 97.06 % | 95.19 % | 98.19 % | 98.34 % |
ANN | 99.01 % | 99.00 % | 99.01 % | 99.02 % |
The performance evaluation done in Table 1 depicts the outperformance of ANN and RF approach over other machine learning classifiers for fault detection and analysis. Better results are obtained in terms of all the parameters for ANN and RFE classifier. The graphical evaluation of parameters is also conducted in terms of all the parameters for more deeper analysis.
The comparison of accuracy (ACC) and positive prediction value (PPV) for all the respective classifiers is done is Fig. 11.
The accuracy values of 90.00 %, 94.74 %, 97.06 % and 99.01 % are achieved for SVM, kNN, RFE and ANN classification methods respectively for fan fault detection. The results obtained for accuracy justifies the competence of ANN based approach for fault detection. However, the obtained results for PPV signifies the equal important of RF based method for fault detection in terms of precision. This method achieves the PPV values of 89.19 %, 93.40 %, 98.34 % and 99.02 % for SVM, kNN, RFE and ANN classification methods respectively. The comparative visualization of sensitivity (SEN) and specificity (SEP) for all the respective classifiers is done is Fig. 12.
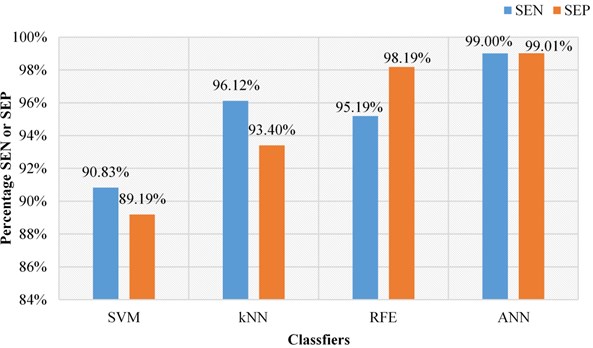
The graphical representation depicts that the sensitivity values of 90.83 %, 96.12 %, 95.19 % and 99.00 % are achieved for SVM, kNN, RFE and ANN classification methods respectively. Specificity values of 89.13 %, 93.40 %, 98.19 % and 99.01 % are achieved for SVM, kNN, RFE and ANN respectively. The results obtained for different classifiers suggest that the ANN based classification approach provides the optimal results for all the performance evaluation parameters comparative to the other machine learning methods.
Fig. 11Accuracy (ACC) and positive prediction value (PPV) observed for different classifiers
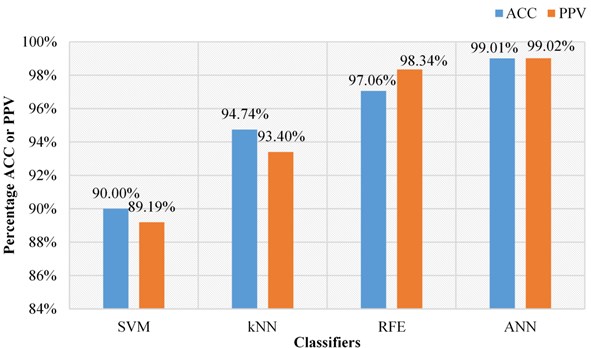
Fig. 12Sensitivity (SEN) and specificity (SEP) observed for different classifiers
4.2. Comparative analysis with the other state of the art methods
The comparative analysis of the proposed fault detection approach is done with the other counterpart machine learning methods and also with the state-of-the-art approaches. The percentage improvement ANN classification for fault detection and diagnosis over SVM, kNN and RFE classifier are tabulated in Table 2 and the visual graphical representation is depicted in Fig. 13.
Table 2Percentage improvement of ANN over other counterpart machine learning methods
Parameters | Classifier | ||
Over SVM | Over kNN | Over RFE | |
ACC | 10.01 % | 4.51 % | 2.01 % |
SEN | 8.99 % | 2.99 % | 4.01 % |
SEP | 11.01 % | 6.01 % | 0.83 % |
PPV | 11.02 % | 6.02 % | 0.69 % |
Fig. 13Comparative percentage improvement over other machine learning methods
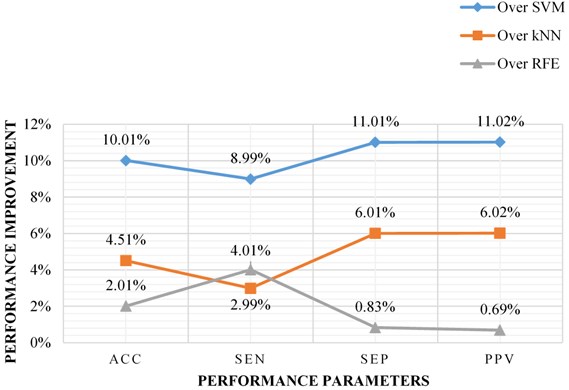
The percentage ACC improvement of ANN classification methods over SVM, kNN and RFE methods are 10.01 %, 4.51 % and 2.01 % respectively. The improvement of 8.99 %, 2.99 % and 4.01 % are observed for SVM, kNN and RFE methods respectively in terms of SEN, however, an improvement of 11.01 %, 6.01 % and 0.83 % are observed for SVM, kNN and RFE methods respectively in terms of SEP for the selected ANN based classification approach. ANN classifier shows the PPV percentage improvement of 11.02 %, 6.02 % and 0.69 % for SVM, kNN and RFE methods respectively.
The comparative analysis of other state of the art methods is done with the proposed method and is tabulated in Table 3.
Table 3Comparative analysis of proposed framework over other approaches
Technique Employed | Accuracy (ACC) |
kNN + PCA [45] | 86.80 % |
Backpropagation Neural Network [45] | 89.30 % |
Statistical Features + SVM [45] | 94.31 % |
LDA+ kNN [45] | 98.40 % |
Deep Neural Network [46] | 98.41 % |
Proposed framework (Vibration Spectrum Image analysis + PCA + ANN) | 99.01 % |
The comparison reveals that the proposed method outperforms the other state of the art methods in terms of accuracy value thereby, shows its competence for fan fault detection and diagnosis using the combination of spectrum adjustment, PCA and ANN classification method. A reliable fault detection solution is achieved using the proposed framework.
5. Conclusions
This article provides a fault diagnosis approach for fan faults while using the vibration signal spectrum images for image recognition. In this work, FFT based vibration analysis is done and the image recognition concept is utilized for feature extraction and a machine learning classification module is used for fault analysis and diagnosis. This work overcomes the effect of machine operation conditions on the vibration spectrum are minimized using the adjustment technique and the adjusted signal spectrum is for image feature extraction to obtain relevant features for fault diagnosis. PCA yields in effective feature generation for the effectual classification by removing the redundancy from the feature vectors and machine learning classifiers are used to obtain improved image recognition and classification performance. The accuracy values of 90.00 %, 94.74 %, 97.06 % and 99.01 % are achieved for SVM, kNN, RFE and ANN classification methods respectively, and ANN classifier yields better performance in terms of various performance parameters. The percentage ACC improvement of ANN classification methods over SVM, kNN and RFE methods are 10.01 %, 4.51 % and 2.01 % respectively for fan fault classification. The comparison of the proposed method over state-of-the-art methods in terms of accuracy shows its outperformance and competence for fan fault detection and diagnosis using the combination of spectrum adjustment, PCA and ANN classification method. The future perspective of this work is its scope in the field of vibration and acoustic noise analysis for fan fault problems as well as to reduce the noise factor along with the faults.
References
-
M. Hamadache, D. Lee, E. Mucchi, and G. Dalpiaz, “Vibration-based bearing fault detection and diagnosis via image recognition technique under constant and variable speed conditions,” Applied Sciences, Vol. 8, No. 8, p. 1392, Aug. 2018, https://doi.org/10.3390/app8081392
-
Z. Ji and W. Liu, “Open-circuit fault detection for three-phase inverter based on backpropagation neural network,” Neural Computing and Applications, Vol. 31, No. 9, pp. 4665–4674, Sep. 2019, https://doi.org/10.1007/s00521-018-3663-2
-
L. Li, J. Li, and B. J. Chen, “Wavelet packet and support vector machine for engine fault diagnosis,” Advanced Materials Research, Vol. 230-232, pp. 1–6, May 2011, https://doi.org/10.4028/www.scientific.net/amr.230-232.1
-
Y. Li and J. Liu, “Vibration signal analysis and feature extraction based on wavelet energy spectrum,” in Proceedings of the Conference, Dec. 2006, https://doi.org/10.1142/9789812772428_0025
-
R. B. Randall and J. Antoni, “Rolling element bearing diagnostics-A tutorial,” Mechanical Systems and Signal Processing, Vol. 25, No. 2, pp. 485–520, Feb. 2011, https://doi.org/10.1016/j.ymssp.2010.07.017
-
G. Dhiman et al., “BEPO: A novel binary emperor penguin optimizer for automatic feature selection,” Knowledge-Based Systems, Vol. 211, p. 106560, Jan. 2021, https://doi.org/10.1016/j.knosys.2020.106560
-
G. Dhiman et al., “MOSOA: A new multi-objective seagull optimization algorithm,” Expert Systems with Applications, Vol. 167, p. 114150, Apr. 2021, https://doi.org/10.1016/j.eswa.2020.114150
-
X. Liu, L. Bo, X. He, and M. Veidt, “Application of correlation matching for automatic bearing fault diagnosis,” Journal of Sound and Vibration, Vol. 331, No. 26, pp. 5838–5852, Dec. 2012, https://doi.org/10.1016/j.jsv.2012.07.022
-
J. Zarei, M. A. Tajeddini, and H. R. Karimi, “Vibration analysis for bearing fault detection and classification using an intelligent filter,” Mechatronics, Vol. 24, No. 2, pp. 151–157, Mar. 2014, https://doi.org/10.1016/j.mechatronics.2014.01.003
-
P. M. et al., “Prediction of the price of Ethereum blockchain cryptocurrency in an industrial finance system,” Computers and Electrical Engineering, Vol. 81, p. 106527, Jan. 2020, https://doi.org/10.1016/j.compeleceng.2019.106527
-
G. Rathee, A. Sharma, R. Kumar, F. Ahmad, and R. Iqbal, “A trust management scheme to secure mobile information centric networks,” Computer Communications, Vol. 151, pp. 66–75, Feb. 2020, https://doi.org/10.1016/j.comcom.2019.12.024
-
A. Rai and S. H. Upadhyay, “A review on signal processing techniques utilized in the fault diagnosis of rolling element bearings,” Tribology International, Vol. 96, pp. 289–306, Apr. 2016, https://doi.org/10.1016/j.triboint.2015.12.037
-
W. Zhou, T. G. Habetler, and R. G. Harley, “Bearing condition monitoring methods for electric machines: A general review,” in 2007 IEEE International Symposium on Diagnostics for Electric Machines, Power Electronics and Drives, Sep. 2007, https://doi.org/10.1109/demped.2007.4393062
-
M. Hamadache, D. Lee, and K. C. Veluvolu, “Rotor speed-based bearing fault diagnosis (RSB-BFD) under variable speed and constant load,” IEEE Transactions on Industrial Electronics, Vol. 62, No. 10, pp. 6486–6495, Oct. 2015, https://doi.org/10.1109/tie.2015.2416673
-
R. R. Balraj, M. Barla, and G. Tingarikar, “A review on intelligent fault detection in rolling element bearings,” E3S Web of Conferences, Vol. 184, p. 01044, 2020, https://doi.org/10.1051/e3sconf/202018401044
-
S. Yin, S. X. Ding, X. Xie, and H. Luo, “A review on basic data-driven approaches for industrial process monitoring,” IEEE Transactions on Industrial Electronics, Vol. 61, No. 11, pp. 6418–6428, Nov. 2014, https://doi.org/10.1109/tie.2014.2301773
-
P. Gupta and M. K. Pradhan, “Fault detection analysis in rolling element bearing: A review,” Materials Today: Proceedings, Vol. 4, No. 2, pp. 2085–2094, 2017, https://doi.org/10.1016/j.matpr.2017.02.054
-
P. Agrawal and P. Jayaswal, “A review of fault detection, diagnosis, and prognosis of rolling element bearing using advanced approaches and vibration signature analysis,” in Lecture Notes in Mechanical Engineering, Singapore: Springer Singapore, 2020, pp. 207–219, https://doi.org/10.1007/978-981-15-3746-2_19
-
G. Zurita, V. Sánchez, and D. Cabrera, “A review of vibration machine diagnostics by using artificial intelligence methods,” Investigacion and Desarrollo, Vol. 16, No. 1, pp. 102–114, Jul. 2016, https://doi.org/10.23881/idupbo.016.1-8i
-
J. Antoni, “Fast computation of the kurtogram for the detection of transient faults,” Mechanical Systems and Signal Processing, Vol. 21, No. 1, pp. 108–124, Jan. 2007, https://doi.org/10.1016/j.ymssp.2005.12.002
-
H. Liu, L. Li, and J. Ma, “Rolling bearing fault diagnosis based on STFT-deep learning and sound signals,” Shock and Vibration, Vol. 2016, pp. 1–12, 2016, https://doi.org/10.1155/2016/6127479
-
P. H. Nguyen and J.-M. Kim, “Multifault diagnosis of rolling element bearings using a wavelet kurtogram and vector median-based feature analysis,” Shock and Vibration, Vol. 2015, pp. 1–14, 2015, https://doi.org/10.1155/2015/320508
-
L. Guo, H. Gao, H. Huang, X. He, and S. Li, “Multifeatures fusion and nonlinear dimension reduction for intelligent bearing condition monitoring,” Shock and Vibration, Vol. 2016, pp. 1–10, 2016, https://doi.org/10.1155/2016/4632562
-
M. M. M. Islam and J.-M. Kim, “Time-frequency envelope analysis-based sub-band selection and probabilistic support vector machines for multi-fault diagnosis of low-speed bearings,” Journal of Ambient Intelligence and Humanized Computing, Oct. 2017, https://doi.org/10.1007/s12652-017-0585-2
-
Y. Liu, Q. Qian, F. Liu, S. Lu, Q. He, and J. Zhao, “Wayside bearing fault diagnosis based on envelope analysis paved with time-domain interpolation resampling and Weighted-Correlation-Coefficient-Guided Stochastic Resonance,” Shock and Vibration, Vol. 2017, pp. 1–17, 2017, https://doi.org/10.1155/2017/3189135
-
L. Liao and J. Lee, “A novel method for machine performance degradation assessment based on fixed cycle features test,” Journal of Sound and Vibration, Vol. 326, No. 3-5, pp. 894–908, Oct. 2009, https://doi.org/10.1016/j.jsv.2009.05.005
-
C. Lu, J. Chen, R. Hong, Y. Feng, and Y. Li, “Degradation trend estimation of slewing bearing based on LSSVM model,” Mechanical Systems and Signal Processing, Vol. 76-77, pp. 353–366, Aug. 2016, https://doi.org/10.1016/j.ymssp.2016.02.031
-
M. Hamadache and D. Lee, “Principal component analysis based signal-to-noise ratio improvement for inchoate faulty signals: Application to ball bearing fault detection,” International Journal of Control, Automation and Systems, Vol. 15, No. 2, pp. 506–517, Apr. 2017, https://doi.org/10.1007/s12555-015-0196-7
-
C. P. Mboo and K. Hameyer, “Fault diagnosis of bearing damage by means of the linear discriminant analysis of Stator current features from the frequency selection,” IEEE Transactions on Industry Applications, Vol. 52, No. 5, pp. 3861–3868, Sep. 2016, https://doi.org/10.1109/tia.2016.2581139
-
L. You, W. Fan, Z. Li, Y. Liang, M. Fang, and J. Wang, “A fault diagnosis model for rotating machinery using VWC and MSFLA-SVM based on vibration signal analysis,” Shock and Vibration, Vol. 2019, pp. 1–16, Feb. 2019, https://doi.org/10.1155/2019/1908485
-
D. Neupane and J. Seok, “Bearing fault detection and diagnosis using case western reserve university dataset with deep learning approaches: A review,” IEEE Access, Vol. 8, pp. 93155–93178, 2020, https://doi.org/10.1109/access.2020.2990528
-
C. Abdelkrim, M. S. Meridjet, N. Boutasseta, and L. Boulanouar, “Detection and classification of bearing faults in industrial geared motors using temporal features and adaptive neuro-fuzzy inference system,” Heliyon, Vol. 5, No. 8, p. e02046, Aug. 2019, https://doi.org/10.1016/j.heliyon.2019.e02046
-
A. Shenfield and M. Howarth, “A novel deep learning model for the detection and identification of rolling element-bearing faults,” Sensors, Vol. 20, No. 18, p. 5112, Sep. 2020, https://doi.org/10.3390/s20185112
-
X. Jin, M. Zhao, T. W. S. Chow, and M. Pecht, “Motor bearing fault diagnosis using trace ratio linear discriminant analysis,” IEEE Transactions on Industrial Electronics, Vol. 61, No. 5, pp. 2441–2451, May 2014, https://doi.org/10.1109/tie.2013.2273471
-
T. W., E. M. Do Nascimento, E. D., and F. M., “Pattern recognition based fault diagnosis in industrial processes: Review and application,” in Pattern Recognition Recent Advances, InTech, 2010, https://doi.org/10.5772/9365
-
G. Elia, M. Cocconcelli, E. Mucchi, and G. Dalpiaz, “Combining blind separation and cyclostationary techniques for monitoring distributed wear in gearbox rolling bearings,” Proceedings of the Institution of Mechanical Engineers, Part C: Journal of Mechanical Engineering Science, Vol. 231, No. 6, pp. 1113–1128, Mar. 2017, https://doi.org/10.1177/0954406216636165
-
W. Li, Z. Zhu, F. Jiang, G. Zhou, and G. Chen, “Fault diagnosis of rotating machinery with a novel statistical feature extraction and evaluation method,” Mechanical Systems and Signal Processing, Vol. 50-51, pp. 414–426, Jan. 2015, https://doi.org/10.1016/j.ymssp.2014.05.034
-
W. Li, M. Qiu, Z. Zhu, B. Wu, and G. Zhou, “Bearing fault diagnosis based on spectrum images of vibration signals,” Measurement Science and Technology, Vol. 27, No. 3, p. 035005, Mar. 2016, https://doi.org/10.1088/0957-0233/27/3/035005
-
F. Jia, Y. Lei, J. Lin, X. Zhou, and N. Lu, “Deep neural networks: A promising tool for fault characteristic mining and intelligent diagnosis of rotating machinery with massive data,” Mechanical Systems and Signal Processing, Vol. 72-73, pp. 303–315, May 2016, https://doi.org/10.1016/j.ymssp.2015.10.025
-
Jian Yang, D. Zhang, A. F. Frangi, and Jing-Yu Yang, “Two-dimensional PCA: a new approach to appearance-based face representation and recognition,” IEEE Transactions on Pattern Analysis and Machine Intelligence, Vol. 26, No. 1, pp. 131–137, Jan. 2004, https://doi.org/10.1109/tpami.2004.1261097
-
A. Kaur and I. Kaur, “An empirical evaluation of classification algorithms for fault prediction in open source projects,” Journal of King Saud University – Computer and Information Sciences, Vol. 30, No. 1, pp. 2–17, Jan. 2018, https://doi.org/10.1016/j.jksuci.2016.04.002
-
A. Djeffal, M. C. Babahenini, and A. T. Ahmed, “Fast binary support vector machine learning method by samples reduction,” International Journal of Data Mining, Modelling and Management, Vol. 9, No. 1, 2017, https://doi.org/10.1504/ijdmmm.2017.082555
-
K. Rudaś and S. Jaroszewicz, “Linear regression for uplift modeling,” Data Mining and Knowledge Discovery, Vol. 32, No. 5, pp. 1275–1305, Sep. 2018, https://doi.org/10.1007/s10618-018-0576-8
-
C. K. Madhusudana, H. Kumar, and S. Narendranath, “Fault diagnosis of face milling tool using decision tree and sound signal,” Materials Today: Proceedings, Vol. 5, No. 5, pp. 12035–12044, 2018, https://doi.org/10.1016/j.matpr.2018.02.178
-
Z. Du, B. Fan, X. Jin, and J. Chi, “Fault detection and diagnosis for buildings and HVAC systems using combined neural networks and subtractive clustering analysis,” Building and Environment, Vol. 73, pp. 1–11, Mar. 2014, https://doi.org/10.1016/j.buildenv.2013.11.021
-
X. Ding and Q. He, “Energy-fluctuated multiscale feature learning with deep ConvNet for intelligent spindle bearing fault diagnosis,” IEEE Transactions on Instrumentation and Measurement, Vol. 66, No. 8, pp. 1926–1935, Aug. 2017, https://doi.org/10.1109/tim.2017.2674738
Cited by
About this article

Financial aid program for young backbone teachers of colleges and universities in Henan Province in 2018 (No.: 2018GGJS234).
