Abstract
The signal processing techniques are basically used for the detection of defect in the rotating machines. However, none of the existing approaches consider their localizations especially in gearbox systems where the bearings have the same fundamental characteristic frequencies. In this paper, a novel approach of an analytical Higher-order spectral analysis -based signal processing is investigated to potentially locate the defective rolling-element bearing in the gearbox system. In order to efficiently analyze the vibration signal from bearings for defect detection, experimental studies have shown that the Fast-kurtogram is the most suitable for this purpose. For this reason, we propose a new operation of the Higher-order spectral analysis in order to have both information detection and the localization of the existing defect. This proposed technique offers effective results in terms of detecting and locating the defective bearing.
Highlights
- The vibrations captured, collected and analysed can provide information on the state of a mechanical system in motion.
- An appropriate processing of these vibration signals allows to define a normal or abnormal state of the moving machine as a whole or of one of its elements in particular.
- The work will focus on bearing faults which are among the most frequent and most damaging to a rotating machine.
- Envelope analysis is a very powerful signal processing tool for vibration monitoring. It can easily detect bearing faults, but it is not capable of locating faulty bearings.
- The principal objective of this work is to search for a new processing technique to detect and locate a defective bearing in the gearbox.
- This can be achieved by applying the Fast-kurtogram to the measured vibration signals.
1. Introduction
The bearing is the heart of rotating equipment, and its condition often reflects the operating condition of the machine. However, there are times when a bearing fails. Numerous statistical studies on machines have been carried out from the 1980’s to date. A recent statistical studies by [1] on high-power electrical systems used in many industrial domains shows that 69 % of failures happen in bearings, a percentage that has increased significantly. This distribution confirms that machine failures are mainly due to bearings.
References [2, 3], review a large number of cases of failures, as well as the associated detection techniques. One of the most common causes of failure in industrial environments is bearing defects [4, 5], these defects can be of electrical [7, 8], mechanical [8], thermal [5] or other origin.
Over the last decades, vibration monitoring has been the most widely used method to detect and diagnose bearing faults, and several techniques have been developed to enhance the fault signature in the time or frequency domain [9-15]. Other techniques also based on the use of use of adaptive and self-adaptive filters to remove background noise from the signals obtained through computer simulations and experimental data [16, 17]. For this purpose, an approach is envisaged in which bearing defects induce vibrations [10]. The spectral signatures of the vibrations is thereafter explored [18]. The presented work presents the validation of an indicator for the localization of defective bearings by energy extraction in the Kurtogram of the displacement of the speed reducer pinion.
In this paper, a summary of the mechanical effects of bearing defects and the method of analysis used is given in section II. Section III recalls the formulation of a model of the speed reducer in two modes: healthy and faulty mode. In addition, for several operating points of the drive, the frequency response of the vibration harmonics relative to the oscillations of the pinion displacement is studied in simulation. The frequency response reveals frequencies that are then used to aid in the detection of bearing defects. In section IV, an indicator of the location of defective bearings is presented.
2. Theoretical background
2.1. Higher-order spectral analysis
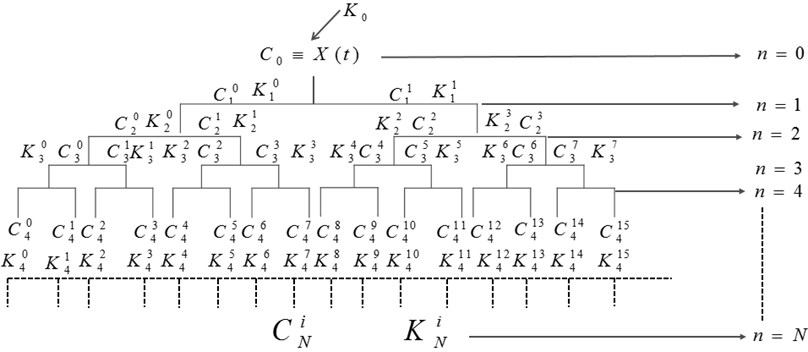
In order to efficiently analyze non-stationary in a signal and overcome the inability of the power spectral density, Dwyer proposes the (Spectral Kurtosis) which is a frequency descriptor. The main idea of this method is based on the calculation of the kurtosis of a signal analyzed at “each frequency” (Fig. 1) in order to discern non-stationary structures and to indicate in which frequency band(s) these occur. This way of calculation is relatively robust with respect to additive stationary noise, unlike the global kurtosis. In table 1 we have given a formal definition of the SK of non-stationary signals from the Wold-Cramér decomposition.
Table 1Main formulas of the higher-order spectral analysis
Function | Description |
Decomposition of signal | : signal to decompose : increment spectral orthogonal. complex envelope of at frequency |
Headings kurtosis spectral of signal | temporal average of a function |
In the presence of additive stationary noise | noise-to-signal ratio as a function of frequency |
Fig. 1Principle of calculation of the higher-order spectral analysis
2.2. Measuring parameters and characteristic frequencies of bearing defect
The defects generated by the bearings induce in the majority of the cases periodic impulsive forces, this is translated on the temporal signal by shocks caused with each contact of the ball with the defect. To characterize these pulses, the dimensions of the bearing (Fig. 2), the location of the defect and the shaft speed are used. The pulses are also characterized by well-defined frequencies. These frequencies are determined from well-established relationships with different fault locations [19, 20].
The calculation of the characteristic defect frequency requires a very precise knowledge of these dimensional characteristics of the bearing.
We consider:
: Shaft rotating frequency
: The number of balls
: Ball Diameter
: Bearing pitch diameter
: Contact angle
The Characteristic defect frequency of a rolling element bearing, are expressed in Table 2.
Fig. 2Geometric parameters of the bearing
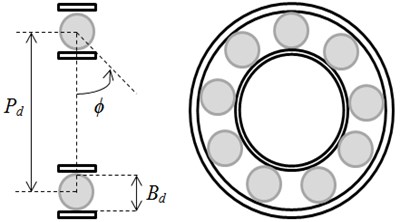
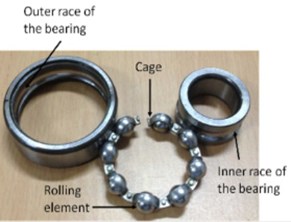
Table 2Bearing characteristic defect frequency
Defect location | Failure frequency |
Outer race | |
Ball | |
Inner race |
Bearing vibration can be caused by a variety of sources characterized by forces. Bearing defects, imbalance and misalignment are the most common sources. The Table 3 presents the characteristic forces associated with the most common sources of vibrations.
Table 3Fault functions parameters
Vibration sources | Force function |
The mass imbalance | |
Misalignment | |
Bearing defects |
The main notation used for the description of the bearing defect functions are given in Table 4.
Table 4Main notation of the Fault functions
Parameters | Description |
Amplitude value created by the imbalance | |
Amplitude value for the th harmonic | |
Initial Magnitude value for the th harmonic | |
Rotation frequency | |
Fault frequency associated with the bearing | |
Phase angle appropriate | |
Value of the phase for the th harmonic | |
Harmonics number in the impulse train |
2.3. Measuring parameters and characteristic frequencies of bearing defect
In order to locate the bearing fault, i.e. the faulty bearing in the gearboxes, from which the fault signature will be extracted, we propose to use the spectral kurtosis according to the algorithm developed by [20]. Contrary to the approach used by [21] which consists in calculating the kurtosis of each MFI, our approach consists in calculating the spectral kurtosis of the signal. The latter allows a 3D visualization called kurtogram, which gives an overview of the kurtosis values as a function of the signal frequencies, and thus allows to target the optimal frequency bands that contain the maximum kurtosis values. This approach is very useful to choose the bandwidth of a filter for an envelope analysis for example. In our case, the spectral kurtosis will be used as a criterion to locate the faulty bearing in the gearbox.
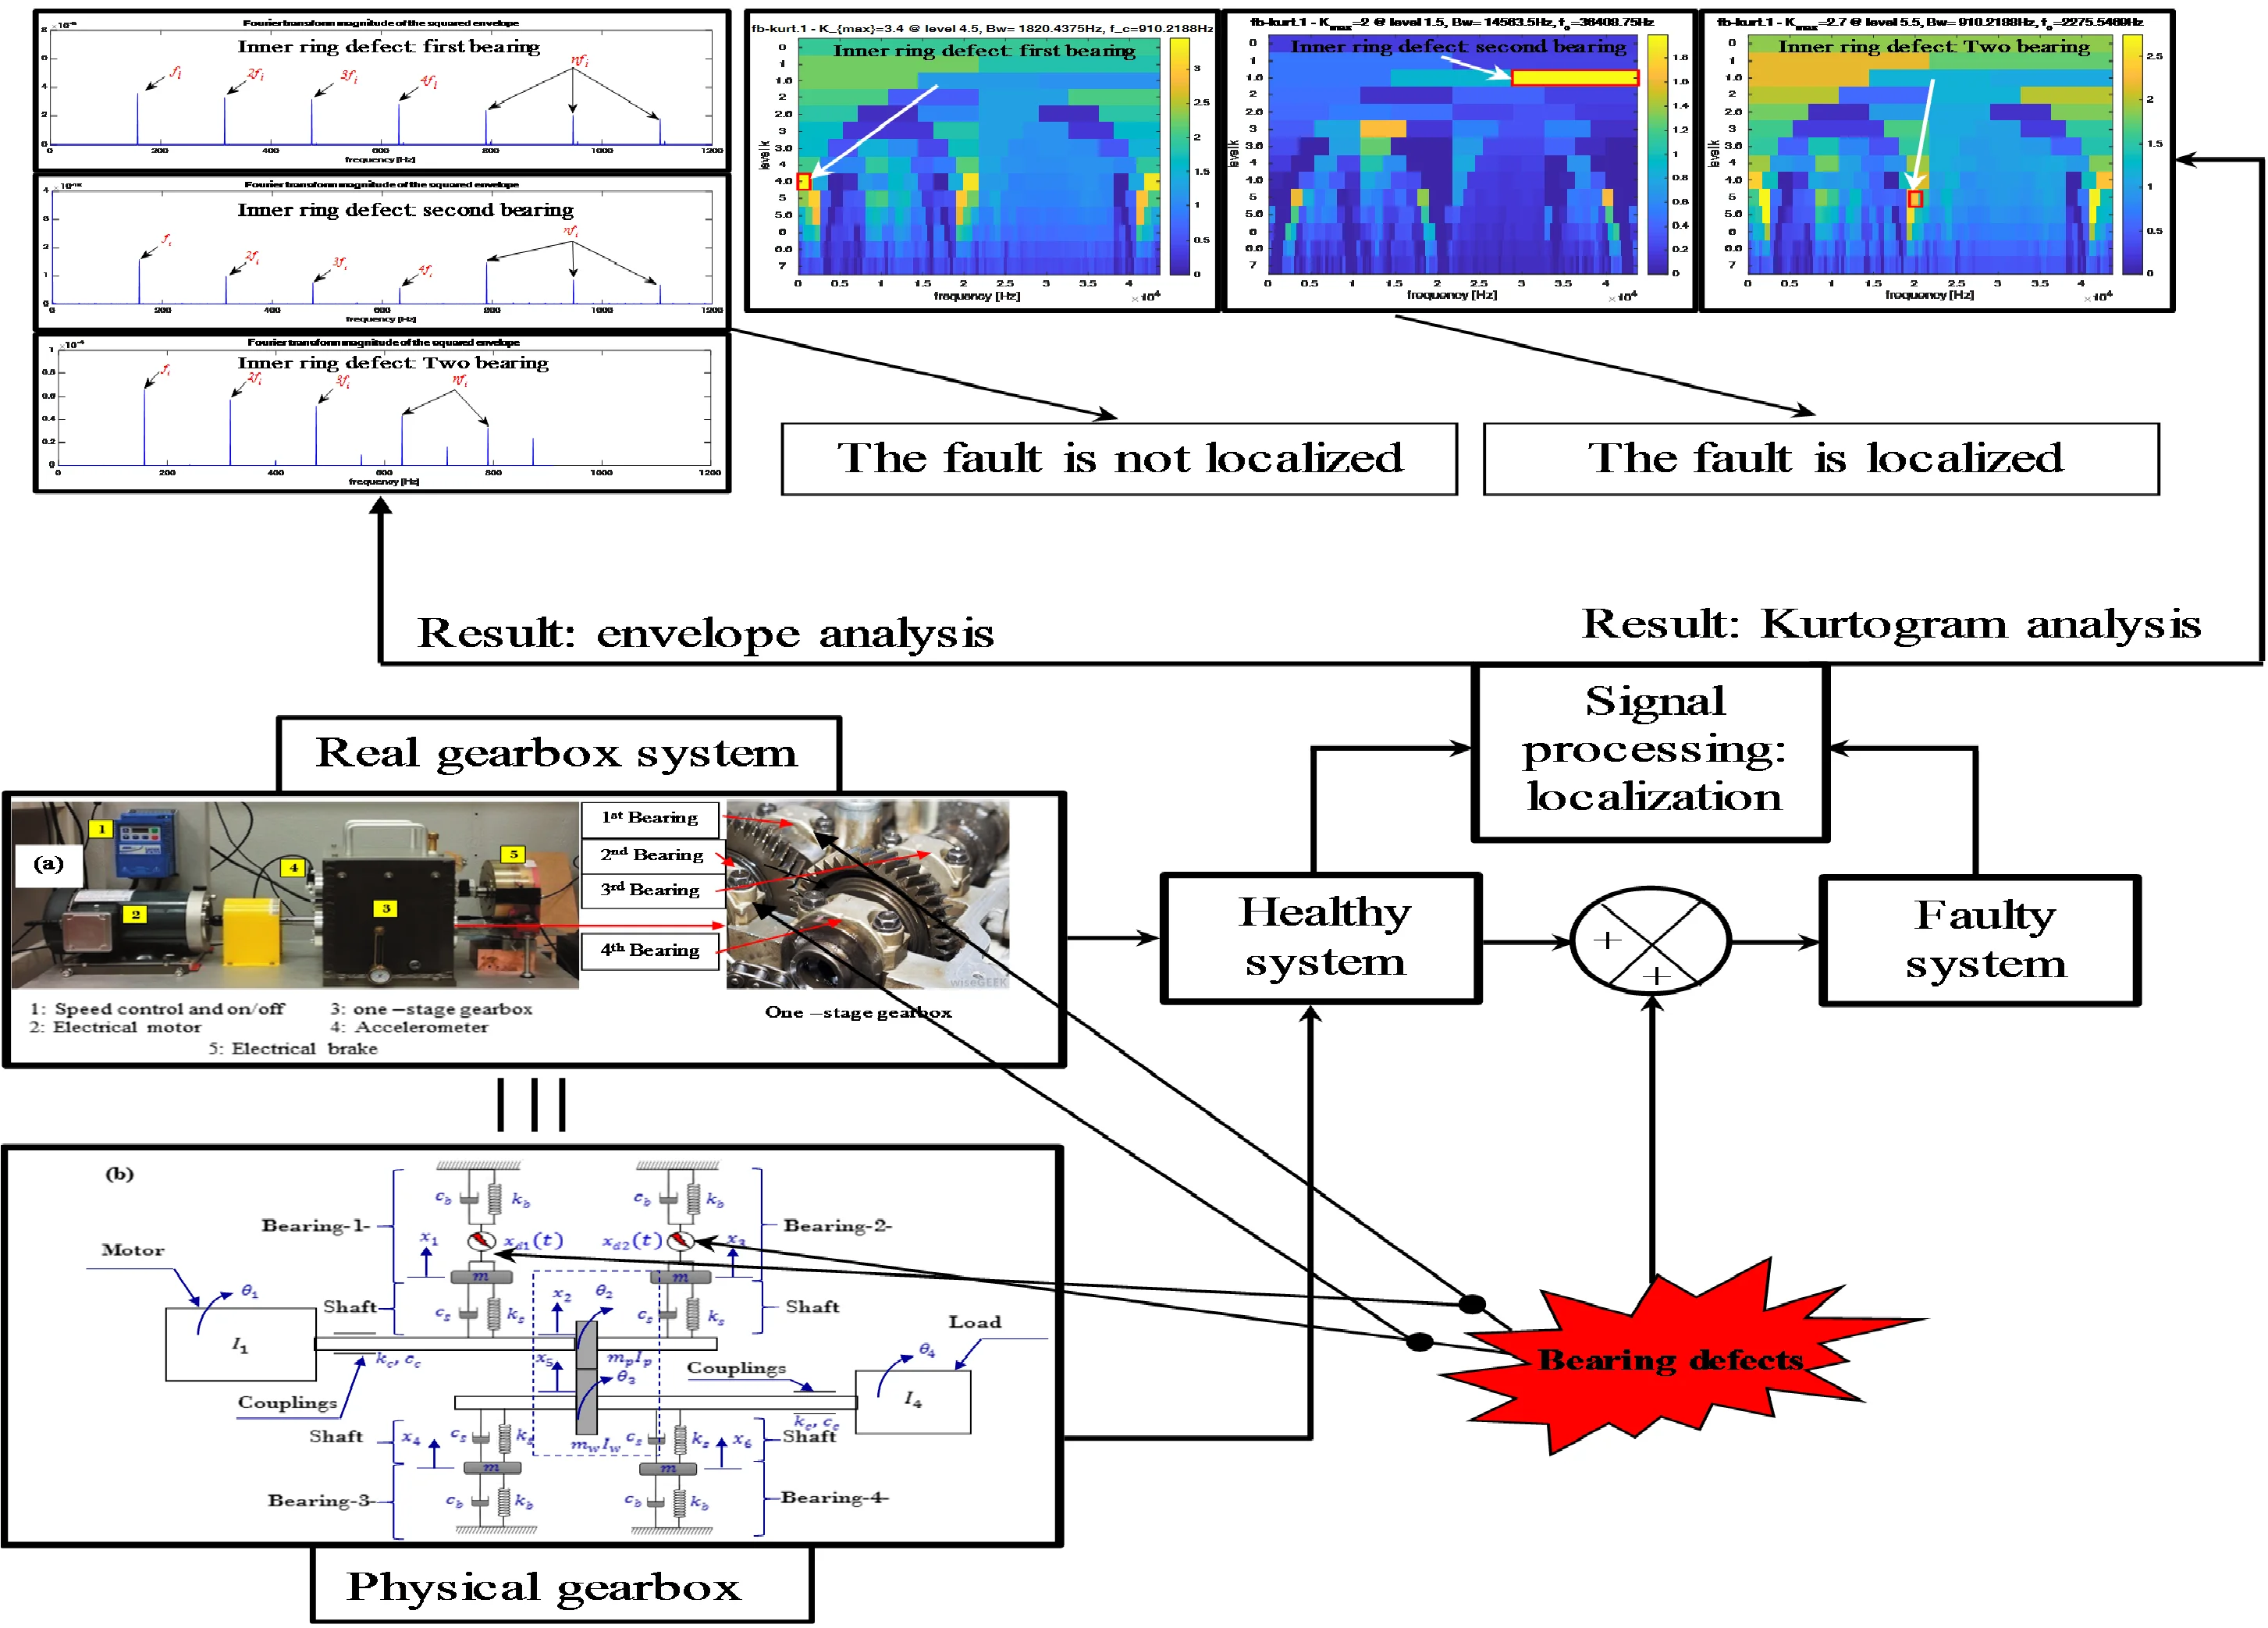
Fig. 3Considered gearbox system: a) real gearbox system; b) physical gearbox system
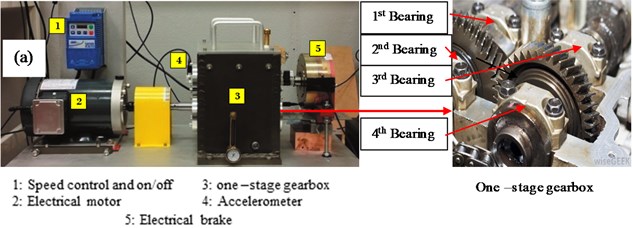
a)
b)
3. Model description
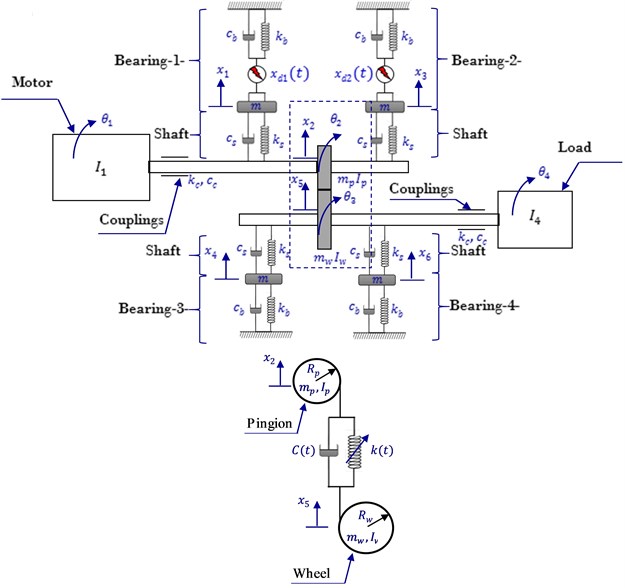
A mathematical simulation model Eq. (1-11) obtained from the application of the laws of physics on the physical model presented in Fig. 3 has been proposed to detect the defect of rolling element bearing and locate the defect bearing in gearbox system. The model was assumed to work with and without defects, i.e. with and without defective rolling-element bearing.
The physical model is a model of 10 degrees of freedom with 10 generalized coordinates, three angular variables: the rotational angle of the motor, and are the pinion and the wheel rotational angles respectively, is the load rotational angle, and six displacement variables: , , , are the radial displacement of 1st bearing, 2nd bearing, 3rd bearing , and 4th bearing respectively, , are the radial displacement of pinion and wheel respectively.
According to the movement of this system we can distinguish three equations of motion. Using the Newtonian method, the mathematical system describing the system to be diagnosed is written as Eqs. (1-11).
Circular motion:
Movement straight:
4. Results and discussion
4.1. Frequency spectrum of squared envelope signal
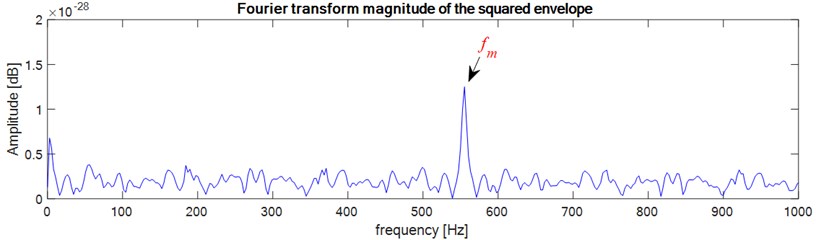
In search of a result that characterizes the system, we will apply Fourier analysis on the envelope signal obtained using the Kurtogram. Fig. 4 is a frequency analysis of the healthy envelope signal, the only frequency that can be observed in this figure is the (meshing frequency). On the other hand, we also notice that there is no another frequency that characterizes the rolling failure, this shows that there is no displacement fluctuation and thus confirms that the system is in a healthy state.
Fig. 4Healthy bearings: Fourier transform magnitude of the squared envelope for healthy bearings
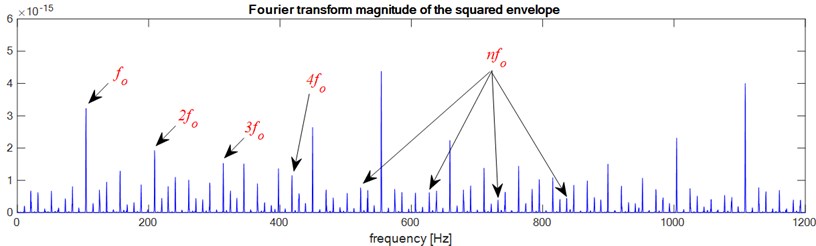
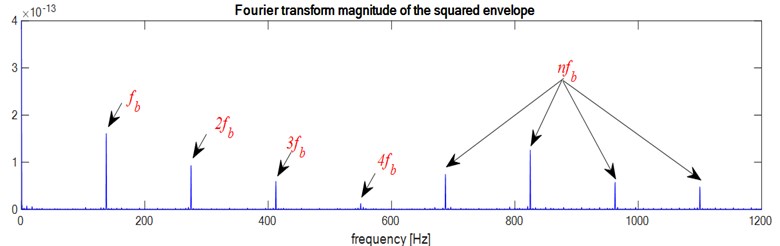
We will study the impact of the turnover failure on the time evolution we used in the healthy diet. We start from the fact that the rolling defect (Defect on the inner ring, defect on the outer ring and defect on the ball) causes impulses that will be transmitted to the mechanical quantities. These impulses are modelled according to Equations in the Table 3. We have generated cycle stationary fluctuations, of cyclic frequency Hz ( is o, i or b) and maximum amplitude equal to the value of . This modelling was done in three cases: case 1: defect in the bearing 1, case 2: defect in the bearing 2, case 3: defect in both bearings at faith.
Fig. 5Faulty bearings (outer-race defect): a) the first bearing b) the second bearing c) two bearings defects
a)
b)
c)
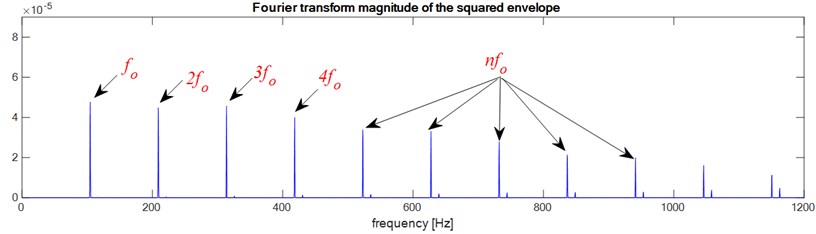
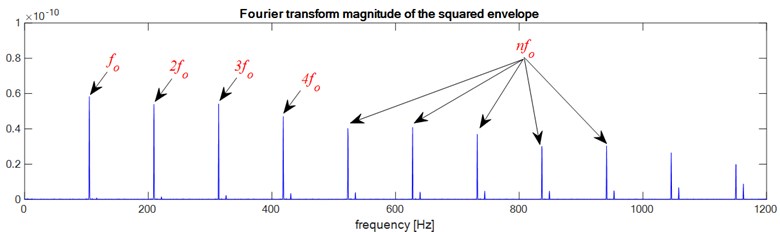
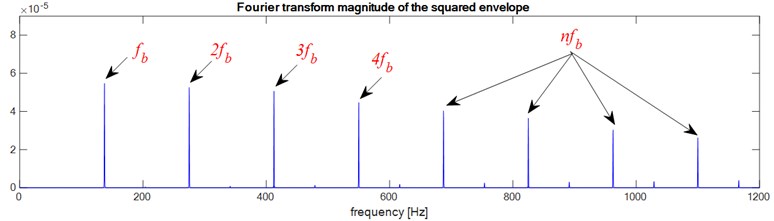
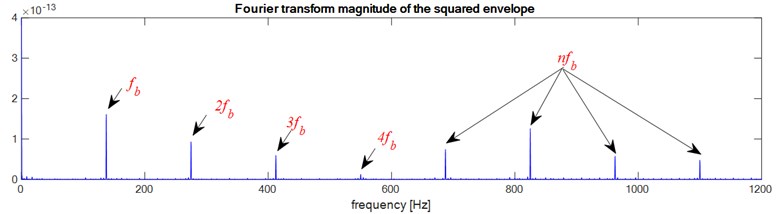
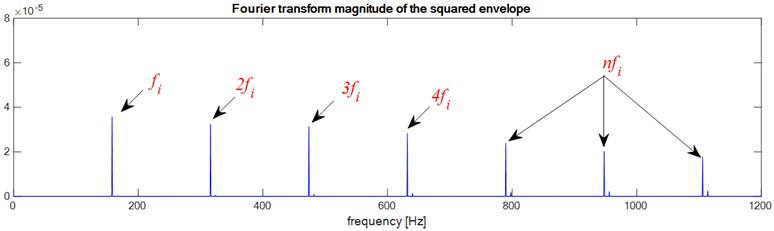
In order to ensure complete consistency of the information, we will apply Fourier analysis on the envelope signal for these three cases and the result obtained from this analysis is presented in Fig. 5, Fig. 6 and Fig. 7.
Fig. 6Faulty bearings (Ball defect): a) the first bearing b) the second bearing c) two bearings defects
a)
b)
c)
According to these results we notice that the envelope method allows to detect the bearing defect whatever the type of defect, Outer race defect, Ball defect or inner race defect, and as the bearings have the same dimensions and the same rotation frequency ( and ) the envelope analysis does not allow to localize the defect, is it in the bearing 1 or in the bearing 2 or in both bearings at the same time.
Fig. 7Faulty bearings (Inner-race defect): a) the first bearing b) the second bearing c) two bearings defects
a)
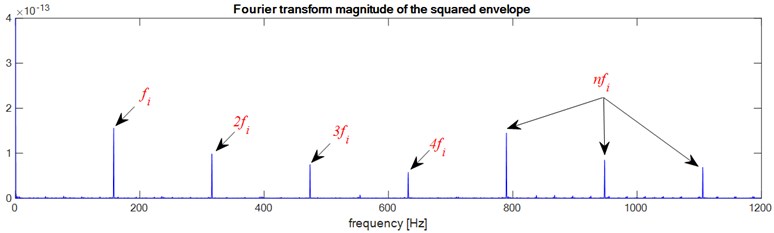
b)
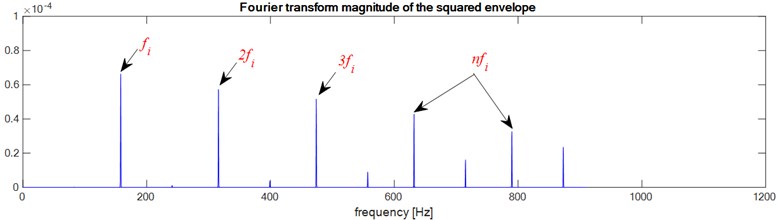
c)
To achieve the objective of this study, we propose a higher order spectral analysis based on the kurtogram, the results obtained for its application are presented in the following section.
4.2. Kurtogram application for localizing defective rolling-element bearing
This part illustrates the use of the kurtogram for diagnosing a defect in the inner ring of a bearing, which manifests itself on the vibratory measurements by a series of pulses generally of low amplitude compared to the surrounding background noise. In order to detect them, it is usual to demodulate the signal in different frequency bands until the one that maximizes the signal-to-noise ratio is found.
4.2.1. Healthy system
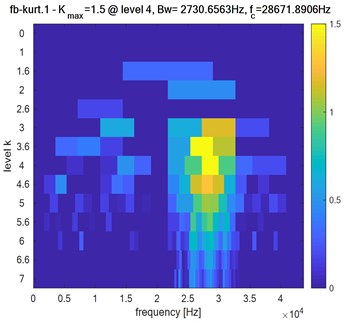
Fig. 8 shows the results of processing the signal by using the FK method for the healthy system. It can be concluded from the figure that the maximum value of the spectral kurtosis is ( 1.5) on the dyad ( 2730.6563 Hz, 28671.8906 Hz).
Fig. 8Healthy system: Kurtogram of pinion response
4.2.2. Faulty system
To illustrate the advantages of the proposed method, Figs. 9, 10 and 11 shows the results by the proposed method for the same vibration signal recording location in the presence of bearing defects and for following cases:
First case: Outer race defect as shown in Fig. 9.
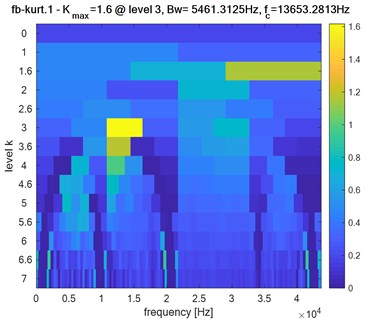
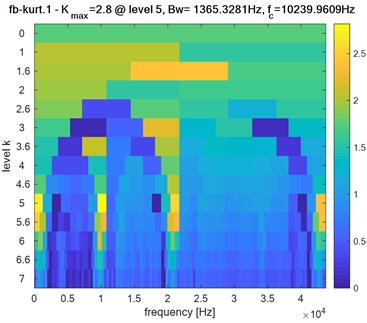
Fig. 9Faulty system: Kurtogram of pinion response of bearing in presence of defect on the outer ring: a) first bearing, b) second bearing, c) two bearings
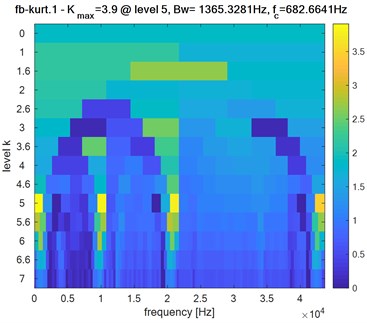
a)
b)
c)
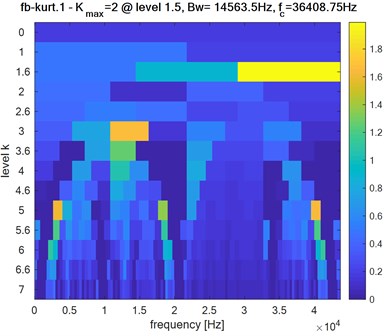
Second case: Ball defect as shown in Fig. 10.
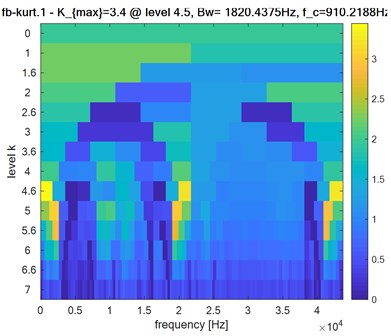
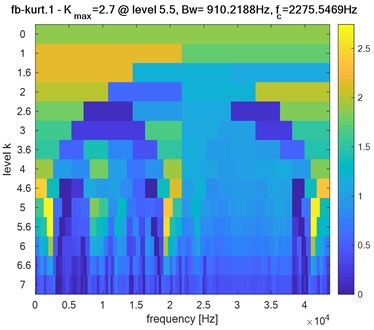
Third case: Inner race defect as shown in Fig. 11.
Obviously, the obtained Kurtogram’s results of Fig. 9, Fig. 10 and Fig. 11 show clearly the difference in the maximum spectral kurtosis and level values where:
Outer race defect:
First bearing: 3.9: level = 5: = 1365.3281 Hz: = 682.6641 Hz.
Second bearing: 1.6: level = 3: 5461.3125 Hz: 13653.2813 Hz.
Two bearings: 2.8: level = 5: 1365.3281 Hz: 10239.9609 Hz.
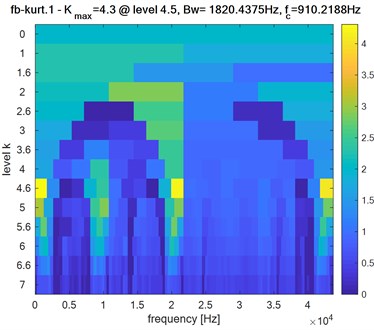
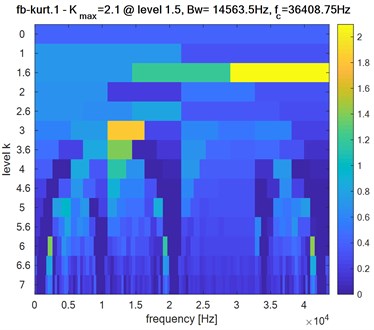
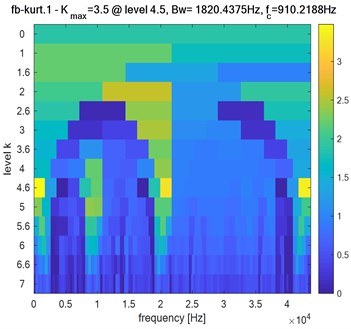
Ball defect:
First bearing: 4.3: level = 4.5: 1820.4375 Hz: 910.2188 Hz.
Second bearing: 2.1: level = 1.5: 14563.5 Hz: 36408.75 Hz.
Two bearings: 3.5: level =4.5: 1820.4375 Hz: 910.2188 Hz.
Inner race defect:
First bearing: 3.4: level = 4.5: 1820.4375 Hz: 910.2188 Hz.
Second bearing: 2: level = 1.5: 14563.5 Hz: 36408.75 Hz.
Two bearings: 2.7: level =5.5: 910.2188 Hz: 2275.5469 Hz.
Based on the obtained results, we can easily detect the different bearing defects and potentially locate the defective bearing by exploiting the maximum value of kurtosis , the level of signal decomposition, bandwidth and center frequency .
Fig. 10Faulty system: Kurtogram of pinion response of bearing in presence of defect on the ball: a) first bearing, b) second bearing, c) two bearings
a)
b)
c)
Fig. 11Faulty system: Kurtogram of pinion response of bearing in presence of defect on the inner ring: a) first bearing, b) second bearing, c) two bearings
a)
b)
c)
In brief, the information provided by the Kurtogram for the different signals analyzed (maximum Kurtosis (), level of decomposition (level), frequency resolution () and central frequency ()) allow to detect the different types of bearing defects, and to locate the defective bearing in the gearbox systems.
5. Conclusions
The ultimate aim of this work was to locate the defective bearings in the gearbox system using Higher-order spectral analysis method. We have first introduced the main steps of the proposed method. Thereafter, we have briefly described the mathematical system in which we have illustrated this approach by including a dynamic model of the gearbox.
The illustration of this approach was initiated by a system analysis with healthy bearings and then with faulty bearings analyzed according to the faults’ positions. The envelope analysis showed that the bearing defects manifest their presence by the appearance of new frequencies called characteristic frequencies of the bearing, but without providing us any information on the location of the defective bearing. For both states, the Kurtogram gave us different values of kurtosis, level of decomposition, bandwidth frequency, and critical frequency regardless of the position of the defect, which allowed us to efficiently and easily locate the defective bearing in the gearbox. The results obtained showed that this approach could be a very sensitive and efficient way to easily locate the defective bearing in gearbox systems. Furthermore, the described approach can be enriched by using some artificial intelligence technique. The obtained results can be used as a training data to be further used for classification and decision-making.
References
-
A. Bonnett and C. Yung, “Increased efficiency versus increased reliability,” IEEE Industry Applications Magazine, Vol. 14, No. 1, pp. 29–36, Jan. 2008, https://doi.org/10.1109/mia.2007.909802
-
S. B. Lee et al., “Condition monitoring of industrial electric machines: state of the art and future challenges,” IEEE Industrial Electronics Magazine, Vol. 14, No. 4, pp. 158–167, Dec. 2020, https://doi.org/10.1109/mie.2020.3016138
-
R. Azeddine, R. Chemseddine, B. Djamel, O. B. Belkacem, and M. Boualem, “Detection of shaft crack fault in gearbox using Hilbert Transforms,” in 2017 6th International Conference on Systems and Control (ICSC), pp. 422–425, May 2017, https://doi.org/10.1109/icosc.2017.7958660
-
P. Agrawal and P. Jayaswal, “Diagnosis and classifications of bearing faults using artificial neural network and support vector machine,” Journal of The Institution of Engineers (India): Series C, Vol. 101, No. 1, pp. 61–72, Feb. 2020, https://doi.org/10.1007/s40032-019-00519-9
-
A. Ratni and D. Benazouz, “Mathematical modelling of rolling element bearings fault for the diagnosis in the gearbox-induction machine,” Mathematical Models in Engineering, Vol. 6, No. 1, pp. 1–12, Mar. 2020, https://doi.org/10.21595/mme.2020.21206
-
F. He, G. Xie, and J. Luo, “Electrical bearing failures in electric vehicles,” Friction, Vol. 8, No. 1, pp. 4–28, Feb. 2020, https://doi.org/10.1007/s40544-019-0356-5
-
X. Yan, Y. Xu, and M. Jia, “Intelligent fault diagnosis of rolling-element bearings using a self-adaptive hierarchical multiscale fuzzy entropy,” Entropy, Vol. 23, No. 9, p. 1128, Aug. 2021, https://doi.org/10.3390/e23091128
-
J. R. Stack, T. G. Habetler, and R. G. Harley, “Experimentally generating faults in rolling element bearings via shaft current,” IEEE Transactions on Industry Applications, Vol. 41, No. 1, pp. 25–29, Jan. 2005, https://doi.org/10.1109/tia.2004.840966
-
A. Ratni, C. Rahmoune, and D. Benazzouz, “A new method to enhance of fault detection and diagnosis in gearbox systems,” Journal of Vibroengineering, Vol. 19, No. 1, pp. 176–188, Feb. 2017, https://doi.org/10.21595/jve.2016.17214
-
Z. Liu, L. Zhang, and J. Carrasco, “Vibration analysis for large-scale wind turbine blade bearing fault detection with an empirical wavelet thresholding method,” Renewable Energy, Vol. 146, pp. 99–110, Feb. 2020, https://doi.org/10.1016/j.renene.2019.06.094
-
J. Li, Q. Yu, X. Wang, and Y. Zhang, “An enhanced rolling bearing fault detection method combining sparse code shrinkage denoising with fast spectral correlation,” ISA Transactions, Vol. 102, pp. 335–346, Jul. 2020, https://doi.org/10.1016/j.isatra.2020.02.031
-
M. Pająk, Muślewski, B. Landowski, T. Kałaczyński, M. Kluczyk, and D. Kolar, “Identification of Reliability States of a Ship Engine of the Type Sulzer 6AL20/24,” SAE International Journal of Engines, Vol. 15, No. 4, Nov. 2021, https://doi.org/10.4271/03-15-04-0028
-
D. Kolar, D. Lisjak, M. Pająk, and D. Pavković, “Fault diagnosis of rotary machines using deep convolutional neural network with wide three axis vibration signal input,” Sensors, Vol. 20, No. 14, p. 4017, Jul. 2020, https://doi.org/10.3390/s20144017
-
Z. Qi, Y. Tian, and Y. Shi, “Robust twin support vector machine for pattern classification,” Pattern Recognition, Vol. 46, No. 1, pp. 305–316, Jan. 2013, https://doi.org/10.1016/j.patcog.2012.06.019
-
M. Pająk, Muślewski, B. Landowski, and A. Grządziela, “Fuzzy identification of the reliability state of the mine detecting ship propulsion system,” Polish Maritime Research, Vol. 26, No. 1, pp. 55–64, Mar. 2019, https://doi.org/10.2478/pomr-2019-0007
-
V. N. Patel, N. Tandon, and R. K. Pandey, “Improving defect detection of rolling element bearings in the presence of external vibrations using adaptive noise cancellation and multiscale morphology,” Proceedings of the Institution of Mechanical Engineers, Part J: Journal of Engineering Tribology, Vol. 226, No. 2, pp. 150–162, Feb. 2012, https://doi.org/10.1177/1350650111425750
-
I. Khemili and M. Chouchane, “Detection of rolling element bearing defects by adaptive filtering,” European Journal of Mechanics – A/Solids, Vol. 24, No. 2, pp. 293–303, Mar. 2005, https://doi.org/10.1016/j.euromechsol.2004.10.003
-
M. Blodt, M. Chabert, J. Regnier, and J. Faucher, “Mechanical load fault detection in induction motors by stator current time-frequency analysis,” IEEE Transactions on Industry Applications, Vol. 42, No. 6, pp. 1454–1463, Nov. 2006, https://doi.org/10.1109/tia.2006.882631
-
E. Fournier, A. Picot, J. Regnierl, M. T. Yamdeu, J.-M. Andrejak, and P. Maussion, “On the use of spectral kurtosis for diagnosis of electrical machines,” in 2013 9th IEEE International Symposium on Diagnostics for Electric Machines, Power Electronics and Drives – (SDEMPED 2013), pp. 77–84, Aug. 2013, https://doi.org/10.1109/demped.2013.6645700
-
J. Antoni, “Fast computation of the Kurtogram for the detection of transient faults,” Mechanical Systems and Signal Processing, Vol. 21, No. 1, pp. 108–124, Jan. 2007, https://doi.org/10.1016/j.ymssp.2005.12.002
-
A. Patel and P. Shakya, “Spur gear crack modelling and analysis under variable speed conditions using variational mode decomposition,” Mechanism and Machine Theory, Vol. 164, p. 104357, Oct. 2021, https://doi.org/10.1016/j.mechmachtheory.2021.104357
About this article

