Abstract
The operation noise level of air conditioners has been a main concern to consumers. The friction-induced vibration and noise have a contribution to the overall operation noise level of air conditioners. In this paper, two rotary compressors were tested to measure the vibration and noise of the compressors. The friction-induced vibration signals were extracted using a combination of the harmonic wavelet transform and the envelope spectrum analysis. The two rotary compressors were disassembled to check whether the compressor parts have been worn after testing. Results show that when the crankshaft was worn, the friction-induced vibration of compressors is strong. At low rotational speeds of the rotary compressor, the friction-induced vibration is easily excited, which is probably attributed to the boundary lubrication at the interface between the crankshaft and bearing. At high rotational speeds of the rotary compressor, the friction-induced vibration is not easy to be excited, which is probably attributed to the aerodynamic lubrication at the interface between the crankshaft and bearing.
Highlights
- Vibration and noise signals of two rotary compressors were measured in an anechoic room. The characteristics of the vibration and noise were analyzed in the time and frequency domains.
- The components of the friction-induced vibration and noise were identified by a combination of the harmonic wavelet transform and the envelope spectrum analysis. The signals of the friction-induced vibration and noise were a sum of the identified components of the friction-induced vibration and noise.
- The friction-induced vibration and noise of rotary compressors are easily excited at low rotational speed. Strong friction-induced vibration and noise of rotary compressors are probably correlated with the wear of parts of rotary compressors.
1. Introduction
In the burning hot summer, air conditioners bring people a comfortable living and working environment. With the improvement of the living quality, people's requirements for air conditioners are also changing. It is worth noting that air-conditioning products not only create a comfortable living environment for human beings, but also bring increasingly serious environmental pollution problems. Among many complaints about air-conditioning products, noise pollution accounts for more than 67 %. It is generally believed that when the sound pressure level of noise is controlled below 30-40 dB, the noise will have no impact on human beings, and the noise whose sound pressure level is higher than this level will cause a certain harm to human beings. The noise with a sound pressure level above 70 dB will upset people and affect people's regular living and work. If one lives or works in a noisy environment with a sound pressure level above 90 dB for a long time, the noise will seriously affect his auditory system and lead to some other diseases. With the popularity of air conditioners in recent years, the noise problem of air conditioners has increasingly become an important factor affecting people's purchase decision.
From the structure, working principle and related test results of air conditioners, the air-conditioner noise is mainly composed of aerodynamic noise [1-2], electromagnetic noise and mechanical noise [3-4]. The aerodynamic noise of the air conditioner mainly includes fan noise and pipe noise. Among them, the fan noise is an aerodynamic noise, and its intensity is related to the shape of the fan blade, the speed of the fan impeller, and the wind speed in the fan. The electromagnetic noise of the air conditioner is due to the fact that the stator and rotor of the motor will periodically vibrate under the action of the alternating magnetic field, causing the iron core of the motor to undergo magnetostriction and periodic bending, which in turn stimulates the continuous fluctuation of the surrounding air pressure. Electromagnetic noise is mainly affected by the frequency and amplitude of the air gap harmonic magnetic field, the number of poles of the motor, and the vibration characteristics of the stator. The mechanical noise of the air conditioner is mainly caused by the rotating parts such as the motor, fan, and compressor inside the air conditioner. The compressor and the fan are the two main noise sources. When the air-conditioning compressor is running, it will also cause resonance of the connected box, four-way valve and other components, thereby increasing the intensity of the noise. Mechanical noise is mainly related to factors such as the manufacturing and installation accuracy of bearings, the design of structural parts, and the performance of lubricants [5].
The compressor of air conditioners is the heart of air conditioners, and its noise makes a significant contribution to the overall noise level of air conditioners [6-7]. Therefore, the compressor noise control has also become the focus of the air-conditioner noise control. Reducing the operating noise has always been a main content of the key technology research on the core components of the refrigeration and air conditioning equipment. The research shows that the friction noise of refrigeration compressors is a main part of the mechanical noise of compressors, which accounts for a large weight in the total noise level of compressors [8]. In order to reduce the noise level of compressors, the friction-induced noise of compressors must be reduced as much as possible [9-12].
The purpose of the present paper is to study an extraction method of the friction-induced noise of a rotary compressor to understand the characteristics of the friction-induced noise, which is helpful to suppress the noise level of air conditioners.
2. Rotary compressor structure and test details
2.1. Rotary compressor structure
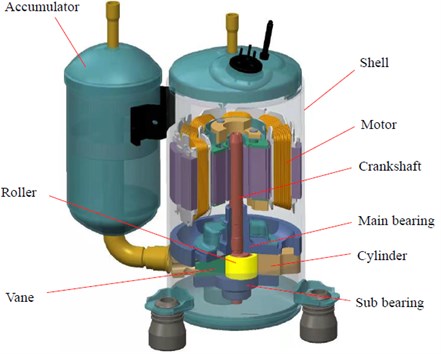
At present, rotary compressors are commonly used in household air conditioners. The rotary compressor has the characteristics of small size, simple structure, stable operation, etc., which can reliably work under the most working conditions. Fig. 1 shows a rotary compressor structure. It mainly consists of a motor, a main bearing, a crankshaft, a cylinder, a roller, a vane, a sub bearing, and an accumulator, etc. There are several friction pairs in the rotary compressor, which include those friction pairs between the crankshaft and bearings, and between the roller and vane.
Fig. 1Structure diagram of a rotary compressor
2.2. Test details
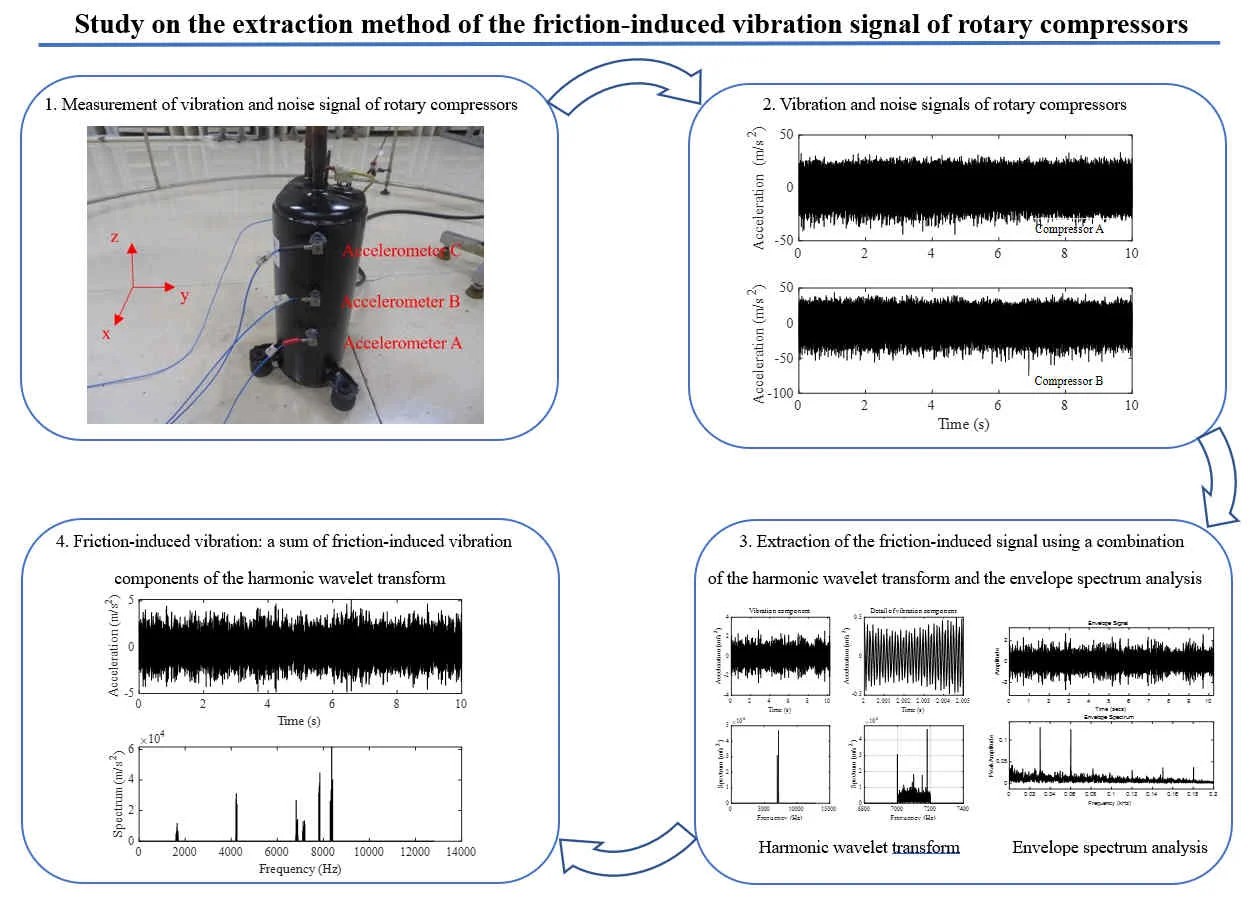
A series of tests on the friction-induced vibration and noise of rotary compressors was performed in an anechoic room. The rotary compressor was located in the center of the anechoic room as shown in Fig. 2. The compressor was fixed on three elastic pads, and these three elastic pads were located freely on the ground. Three 3-D accelerometers were fixed on the different positions of the rotary compressor. Three sound sensors were fixed on the auxiliary frame. All vibration and sound signals were simultaneously collected with a data-acquisition system at a sampling frequency of 25600 Hz. All vibration and sound signals were input to the data acquisition system by using AC coupling. The data-acquisition system was equipped with anti-alias filters to ensure the correctness of the measured signals.
Two different rotary compressors were tested. Each compressor was tested at electric current frequencies of 30, 40, 50, 60, 70, 80, and 90 Hz, which corresponded to rotational speeds of 1800, 2400, 3000, 3600, 4200, 4800, and 5400 rpm, respectively. At each rotational speed of 1800-5400 rpm, the compressors were run for about twenty minutes, then the vibration and noise signals of the compressors were collected.
After all tests were carried out, the compressors were disassembled to check which one of the compressor parts has been worn.
Fig. 2Measurement environment of the friction-induced vibration and noise of rotary compressors
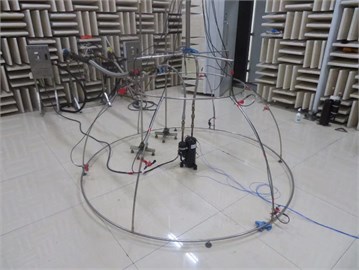
a) Overview of the test site
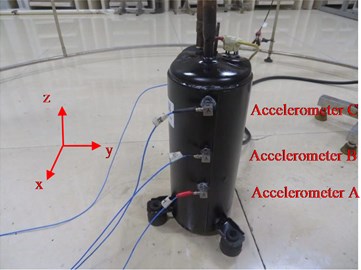
b) Measurement positions of the compressor vibration
2.3. Extraction method of the frictional vibration signal
For high-speed rotating machinery, the rotation conditions are more complicated. Especially when the rotating parts have abnormal phenomena such as eccentricity, bearing defects, oil film turbulence, friction, trapping flow, etc., the vibration of the rotating machinery is more complicated, including many vibration modulation components. At this time, it is difficult to extract the characteristic signals of rotating machinery faults by a simple frequency analysis.
There are several extraction methods of the characteristic signals of rotating machinery faults [13-17]. They are divided into two categories: those are based on the time-domain analysis, including dimensional parameters such as maximum value, mean value, variance, extreme value, peak-to-peak value, etc., as well as dimensionless evaluation parameters such as kurtosis, margin factor, coefficient of variation, and smoothing factor. Those methods are based on the frequency-domain analysis, including amplitude spectrum and power spectrum analysis, cepstrum analysis, envelope spectrum analysis, etc. More recently, the wavelet transform and t are often applied to extract the characteristic signals of rotating machinery faults.
The authors have made many endeavors to extract the characteristic signals of the frictional vibration of the rotary compressors, and have found that using a combination of the harmonic wavelet transform and the envelope spectrum analysis, the characteristic signals of the frictional vibration of the rotary compressors could be extracted.
Newland [18] proposed a harmonic wavelet packet transform in 1993, which was based on the harmonic wavelet family. The harmonic wavelet packet transform is actually a completely ideal bandpass filter, which consists of a complex wavelet with a box-like spectrum. The harmonic wavelet family’s expression in the frequency domain is presented as follows:
where, , are positive real numbers, and . , determine the frequency band range of the harmonic wavelet. Taking the inverse Fourier transform of Eq. (1), the time domain expression is obtained as follows:
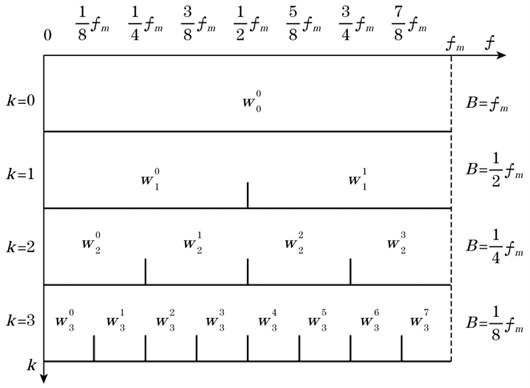
The harmonic wavelet packet transform is the natural extension of the harmonic wavelet transform after translation and expansion. It not only inherits the excellent orthogonal and filtering characteristics of the harmonic wavelet transform, but also breaks through the limitations of the harmonic wavelet in the frequency band division, and realizes the equal division of high and low frequency parts of signals. The frequency domain distribution of the harmonic wavelet packet decomposition is shown in Fig. 3, where is the number of decomposition levels; is the wavelet coefficient of the -th band after -level harmonic wavelet packet decomposition; is the Nyquist frequency; is the bandwidth of each subband; and the upper and lower limits and of the analysis frequency of each frequency band are respectively determined by Eq. (3) and Eq. (4):
Fig. 3Frequency domain distribution of the harmonic wavelet packet decomposition
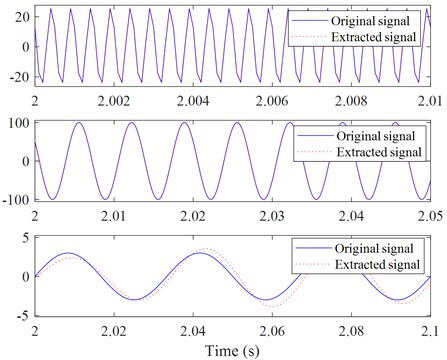
More knowledge of the harmonic wavelet packet transform can be found in Newland’s publication [19]. A numerical example was presented so that readers can roughly know the harmonic wavelet packet transform. Assuming that a signal consists of three waveforms with different frequencies (30, 150, and 2000 Hz, respectively) and amplitudes (3, 100, and 26, respectively) and a random signal as follows:
where is time. The sampling frequency is assumed to equal to 10000 Hz. Fig. 4 shows a comparison between the original signal components and the extracted signal components using the harmonic wavelet packet transform. From Fig. 4, it is seen that the extracted signal components are in good agreement with the original signal components.
The envelope spectrum of vibration signals removes the high-frequency sinusoidal components and focuses on the lower-frequency repetition behavior [20]. This is why the envelope spectrum is a useful tool for the defect analysis of rotational machinery. In the bearing fault diagnosis, for example, the envelope spectrum of vibration signals is generally used to identify bearing faults. Software MATLAB has provided the analysis capability of the envelope spectrum.
Fig. 4Comparison between the original and the extracted signal components
3. Test results and discussion
3.1. Vibration signal analysis
In the present test work, compressor A and compressor B were tested to measure vibrations of their shells. Fig. 5 shows time history records of two compressor vibrations in -direction. From Fig. 5, it is seen that there is not an obvious difference between the vibrations of compressor A and compressor B in amplitude. In comparison with Fig. 5(a) and 5(c), it is found that the amplitude of the vibration increased with increasing electric current frequency.
Fig. 5Time history records of the two compressors vibrations in x-direction
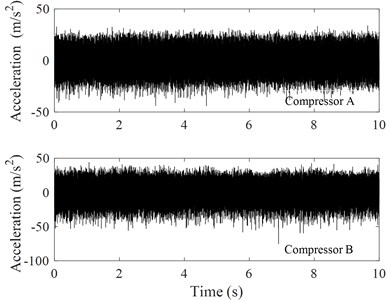
a) Electric current frequency 30 Hz
b) Details of the signal shown in Fig. 5(a)
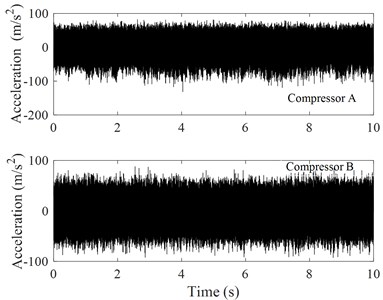
c)90 Hz
d) Details of the signal shown in Fig. 5(c)
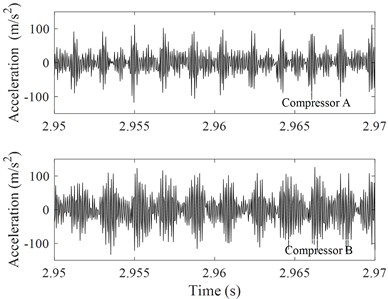
Fig. 6Amplitude spectrum analysis of the vibrations of compressors A and B in x-direction
a)30 Hz
b)90 Hz
Fig. 6 shows an amplitude spectrum analysis of compressors A and B. From Fig. 6(a), it is obviously found that about 9819.23 Hz and 10000.00 Hz vibration components of compressor B are stronger than those of compressor A. From Fig. 6(b), it is seen that the 10000.00 Hz vibration component of compressors B and A is still the strongest.
It needs to be mentioned that the characteristics of the vibrations in - and -directions were similar to those of the vibrations in -direction. Therefore, they were not presented in the paper.
3.2. Cepstrum analysis of vibration signals
Fig. 7 shows a cepstrum analysis of the vibration signals. It is found that there is a characteristic frequency which is corresponding to the rotational frequency of the compressor crankshaft, and there are several lower harmonic frequencies. Form Fig. 7(a), one can see that at the rotational frequency of 30 Hz, the characteristic frequency of the vibration is 1/0.0333 = 30 Hz. Low harmonic frequencies are 1/0.0666 = 15 Hz, 1/0.0999 =10 Hz, and 1/0.01332 = 7.5 Hz, respectively. Form Fig. 7(b), one can see that at the rotational frequency of 90 Hz, the characteristic frequency of the vibration is 1/0.0111 = 90 Hz. Low harmonic frequencies are 1/0.0222 = 45 Hz, 1/0.0333 = 30 Hz, and 1/0.0444 = 22.5 Hz, respectively.
Fig. 7Cepstrum analysis of the vibrations of compressors A and B in x-direction
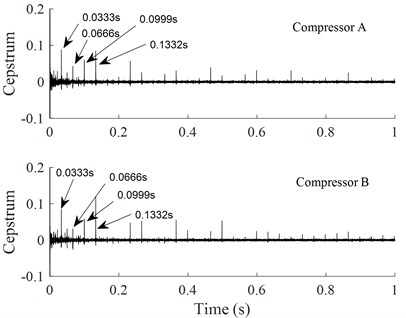
a)30 Hz
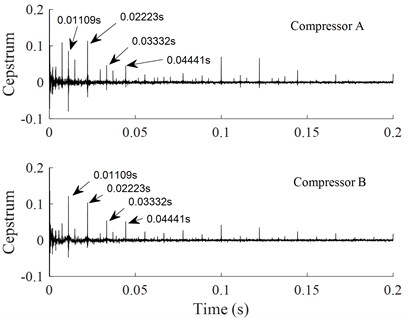
b)90 Hz
3.3. Harmonic wavelet packet transform of the vibration signals
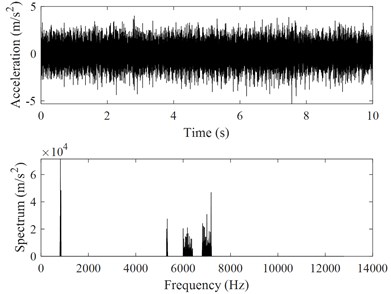
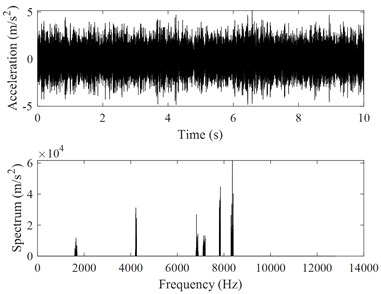
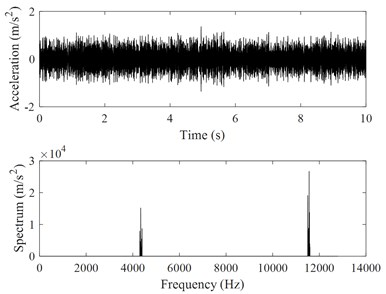
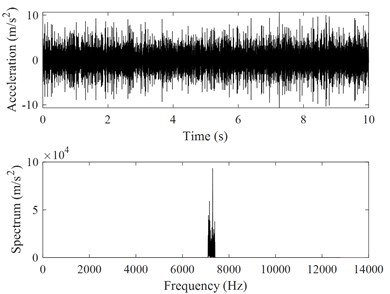
As mentioned in Section 2.3, the envelope spectrum analysis of vibration signals is a useful tool for the defect analysis of rotational machinery. In the present work, the envelope spectrum analysis is also applied to identify the friction-induced vibration of rotary compressors. Since the vibration of the rotational machinery is more complicated, including many vibration modulation components due to complicated work conditions such as eccentricity, bearing defects, oil film turbulence, friction, trapping flow, etc. In order to identify the friction-induced vibration signal, it is necessary to firstly remove those signals that are not related to the friction-induced vibrations. The harmonic wavelet packet transform of the vibration signals was used to identify the friction-induced vibration components of rotary compressors. After the harmonic wavelet packet transform, a series of vibration components was obtained. If the characteristic frequency of the envelope spectrum of a vibration component is equal to the rotational frequency of the compressor crankshaft, the corresponding vibration component is thought to be a friction-induced vibration component of rotary compressors. From Fig. 6, it is seen that the frequency components of compressor vibrations are very rich. Therefore, an 11-layer harmonic wavelet transform was used to decompose the measured compressor vibration signals into a series of components with 2048 frequency bands at a bandwidth of 6.25 Hz. 489 vibration components were obtained, whose frequency bands did not overlap with each other. The harmonic wavelet packet transform was an accurate transform, and the sum of the transformed vibration components was the same as the original signal. Fig. 8 show characteristics of four vibration components in time and frequency domains among these 489 vibration components. From Fig. 8(a) and Fig. 8(b), it is found that vibration components of frequencies 30 Hz and 60 Hz were excited by the rotational frequency of the compressor crankshaft. From Fig. 8(c) and Fig. 8(d), it is found that vibration components of dominant frequencies 819.62 Hz and 7181.03 Hz were excited by the rotational frequency of the compressor crankshaft. It is clearly found that there are two dominant frequencies in each vibration component shown in Fig. 8(c) and Fig. 8(d), suggesting that the vibration components of dominant frequencies 819.62 Hz and 7181.03 Hz have been modulated. Fig. 9 shows an envelope spectrum analysis of the vibration components of dominant frequencies 819.62 Hz and 7181.03 Hz. It is seen that the characteristic frequencies of the envelope spectrums are all equal to the rotational frequency of the compressor crankshaft, suggesting that the vibration components of dominant frequencies 819.62 Hz and 7181.03 Hz are the friction-induced vibration of the compressor.
Fig. 8Extracted four vibration components of the compressor B at the rotational frequency of 30 Hz from the harmonic wavelet packet transform
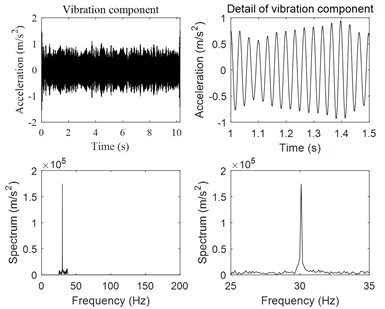
a)
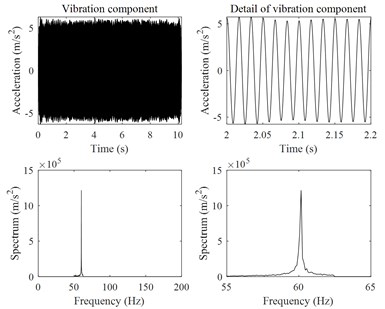
b)
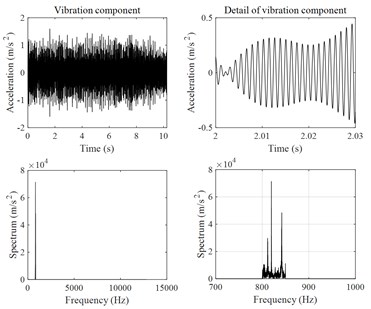
c)
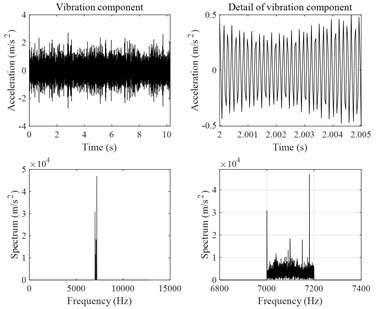
d)
Fig. 9Envelope spectrum analysis of the vibration components of dominant frequencies 819.62 Hz and 7181.03 Hz
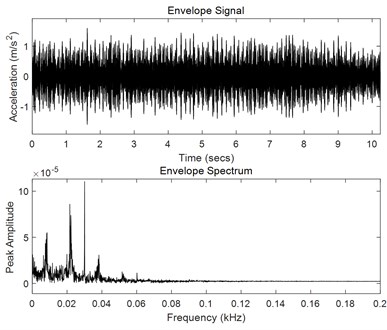
a)
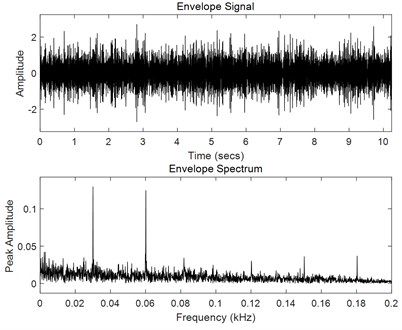
b)
3.4. Extraction of the friction-induced vibration signals
From Fig. 6, it is seen that the vibration of rotary compressors consists of many different-frequency vibration components. Some vibration components are excited by friction, but some are excited by other factors. In the present work, the friction-induced vibration signals are considered to be the sum of all vibration components whose characteristic frequencies are equal to the rotational frequency of the compressor crankshaft.
Fig. 10Extracted friction-induced vibration signals
a)30 Hz for compressor A
b)30 Hz for compressor B
c)60 Hz for compressor A
d)60 Hz for compressor B
Fig. 10 shows four friction-induced vibration signals and their power spectrum analyses. Comparing Fig. 10(a)-10(b) with Fig. 5 and Fig. 6, it is seen that the amplitudes of the friction-induced vibration signals are much less than those of the overall vibrations of the compressor, and the number of the friction-induced vibration frequencies is less than that of the overall vibration frequencies of the compressor.
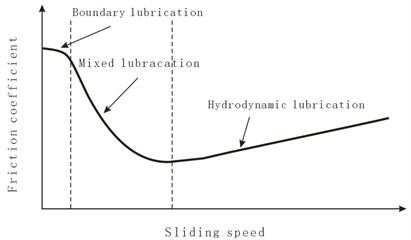
The authors have found that the number of the friction-induced vibration components obtained through the harmonic wavelet packet transform decreases with increasing rotational frequency of the compressor crankshaft. When the rotational frequency of the compressor crankshaft is equal to 80 Hz or 90 Hz, no friction-induced vibration component was detected. This phenomenon is attributed to the relation between the friction coefficient and sliding speed (Stribeck curve) as shown in Fig. 11. From Fig. 11, it is seen that when the rotational frequency of the compressor crankshaft is low, the compressor crankshaft and bearings work under the boundary lubrication. In this case, the friction between the compressor crankshaft and bearing is the largest, suggesting the compressor crankshaft is probably pressed into contact with the bearing, which induces friction-induced vibration of the compressor. When the rotational frequency of the compressor crankshaft is higher, the compressor crankshaft and bearings work under the mixed lubrication or hydrodynamic lubrication. In these cases, the friction between the compressor crankshaft and bearing is lower, suggesting the compressor crankshaft is not probably pressed into contact with the bearing, which is not able to induce friction-induced vibration of the compressor.
Fig. 11Stribeck curve
3.5. Noise signal analysis
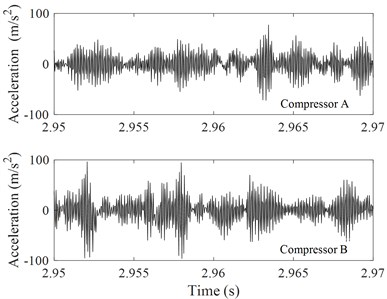
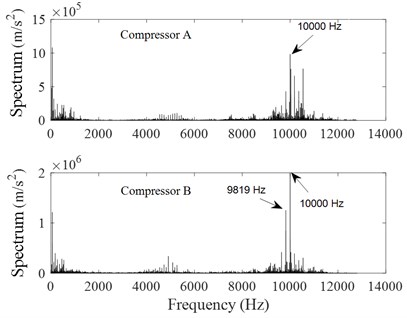
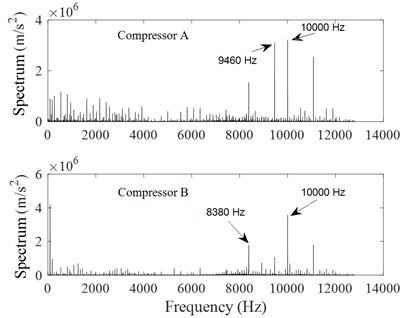
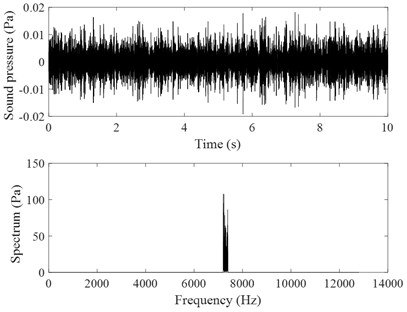
In the test, noise signals of the rotary compressors were also measured. Fig. 12 shows time history recorders of both compressor A and compressor B and their spectrum analysis. It is seen that two dominant frequencies of the noise signal of compressor A are 960.8 Hz and 10360 Hz, respectively. Two dominant frequencies of the noise signal of compressor B are 1080 Hz and 9640 Hz, respectively. Using the same method as in Section 3.4, friction-induced noise components were extracted as shown in Fig. 13. It is seen that the dominant frequencies of the friction-induced noise components of both compressor A and compressor B are close to those of the friction-induced vibrations shown in Fig. 10(c) and Fig. 10(d).
4. Wear observation of the crankshafts
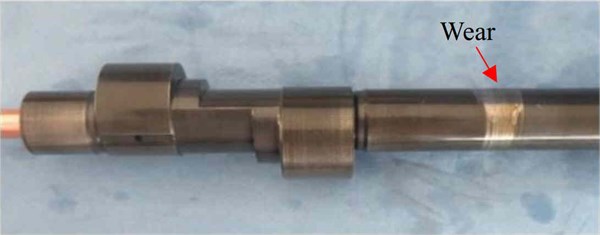
After the test, both compressors A and B were disassembled to check whether the parts of the compressor are worn. Fig. 14 shows a picture of the compressor crankshaft. It is seen that the surface, mating with the bearing, of the crankshaft of compressor B has been worn. We also found that the crankshaft of compressor A was not worn. Comparing Fig. 10(a), 10(c) with Fig. 10(b), 10(d), it is found that the friction-induced vibrations of compressor A are always less than those of compressor B in amplitude, suggesting that the wear of compressor A is weaker than that of compressor B.
Fig. 12Time history records of the two compressors noise signals, electric current frequency f= 60 Hz
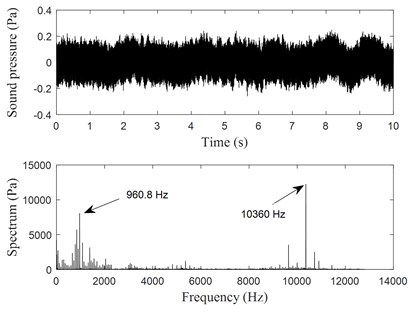
a) Corresponding to compressor A
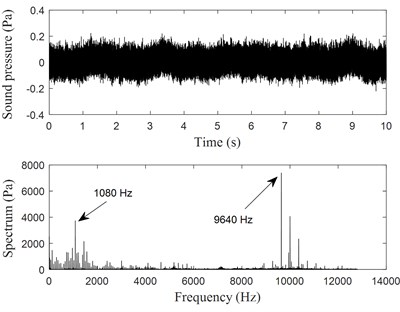
b) Corresponding to compressor B
Fig. 13Extracted noise components related to the friction-induced vibration of the compressors
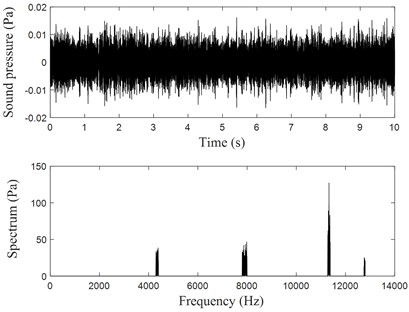
a) Corresponding to compressor A
b) Corresponding to compressor B
Fig. 14Picture of the crankshaft of compressor B
5. Conclusions
In the present paper, a series of tests was carried out to obtain vibration signals of rotary compressors. Several signal analysis techniques were used to extract the friction-induced vibration. The following conclusions can be drawn:
1) The overall vibration of rotary compressors consists of many different-frequency vibration components. Some vibration components are induced by friction. One of the characteristics of the friction-induced vibration is that its frequency is equal to the rotational frequency of the compressor.
2) A combination of the 11-layer harmonic wavelet packet transform with 2048 frequency bands at a bandwidth of 6.25 Hz, and the envelope spectrum analysis can be used to extract the friction-induced vibration of compressors from the overall vibration of compressors.
3) When the rotational frequency of compressors is low, the friction-induced vibration is easily excited. But when the rotational frequency of compressors is higher, the friction-induced vibration is difficult to be excited.
4) A strong friction-induced vibration of compressors is probably correlated with the wear of compressor crankshafts.
References
-
J. Tian, H. Ouyang, and Y. Wu, “Experimental and numerical study on aerodynamic noise of outdoor unit of room air conditioner with different grilles,” International Journal of Refrigeration, Vol. 32, No. 5, pp. 1112–1122, Aug. 2009, https://doi.org/10.1016/j.ijrefrig.2008.07.009
-
A. Almeneessier et al., “The effect of air conditioner sound on sleep latency, duration, and efficiency in young adults,” Annals of Thoracic Medicine, Vol. 14, No. 1, p. 69, 2019, https://doi.org/10.4103/atm.atm_195_18
-
H. S. Han, W. B. Jeong, S. Aoyama, and J. Y. Mo, “Experimental analysis for reducing refrigerant-induced noise of 4-way cassette type air conditioner,” Journal of Mechanical Science and Technology, Vol. 23, No. 5, pp. 1456–1467, May 2009, https://doi.org/10.1007/s12206-008-1128-8
-
Yoshiharu Soeta, Ryota Shimokura, and Yasutaka Ueda, “Sound quality evaluation of air conditioner noise,” in ICHES2016 – Fifth International Conference on Human-Environment System, pp. 11–19, Oct. 2016.
-
Sugio T. et al., “Noise sources of room air conditioners and their reduction techniques,” Turbomachinery, Vol. 26, pp. 80–86, 1998.
-
S. Jang, H. Choung, S. Park, and S. Lee, “Investigation on noise of rotary compressors using fluid-structure interaction,” Journal of Mechanical Science and Technology, Vol. 33, No. 11, pp. 5129–5135, Nov. 2019, https://doi.org/10.1007/s12206-019-1002-x
-
J. Lee and U. Y. Lee, “Design optimization of an accumulator for reducing rotary compressor noise,” Proceedings of the Institution of Mechanical Engineers, Part E: Journal of Process Mechanical Engineering, Vol. 226, No. 4, pp. 285–296, Nov. 2012, https://doi.org/10.1177/0954408911429214
-
H. C. Kim, M. G. Cho, J. Kim, J. H. Park, and J. Shim, “Coherence technique for noise reduction in rotary compressor,” Journal of Mechanical Science and Technology, Vol. 26, No. 7, pp. 2073–2076, Jul. 2012, https://doi.org/10.1007/s12206-012-0517-1
-
H. Lü, W. Shangguan, and D. Yu, “Squeal reduction of a disc brake system with fuzzy uncertainties,” Journal of Vibroengineering, Vol. 18, No. 6, pp. 3981–4001, Sep. 2016, https://doi.org/10.21595/jve.2016.17055
-
N. M. Kinkaid, O. M. O. ’Reilly, and P. Papadopoulos, “Automotive disc brake squeal,” Journal of Sound and Vibration, Vol. 267, No. 1, pp. 105–166, Oct. 2003, https://doi.org/10.1016/s0022-460x(02)01573-0
-
G. Corradi, J.-J. Sinou, and S. Besset, “Performances of the double modal synthesis for the prediction of the transient self-sustained vibration and squeal noise,” Applied Acoustics, Vol. 175, p. 107807, Apr. 2021, https://doi.org/10.1016/j.apacoust.2020.107807
-
A. Lazzari, D. Tonazzi, and F. Massi, “Squeal propensity characterization of brake lining materials through friction noise measurements,” Mechanical Systems and Signal Processing, Vol. 128, pp. 216–228, Aug. 2019, https://doi.org/10.1016/j.ymssp.2019.03.034
-
P. Li, Qingbo He, and Fanrang Kong, “An approach for fault diagnosis of bearings using wavelet-based fractal analysis,” in Proceedings of the IEEE International Conference on Information and Automation (ICIA), 2010.
-
Hang S., Xu M., Li Y., Zhao H., and Wang R., “Valve fault diagnosis of reciprocating compressor based on hybrid method,” Journal of Vibration and Shock, Vol. 35, pp. 167–173, 2016.
-
Wang J., Wei W., Li H., and Li X., “Multifractal features extraction of bearing faults for reciprocating compressor,” Journal of Vibration and Shock, Vol. 27, pp. 313–315, 2008.
-
J. Lin and Q. Chen, “Fault diagnosis of rolling bearings based on multifractal detrended fluctuation analysis and Mahalanobis distance criterion,” Mechanical Systems and Signal Processing, Vol. 38, No. 2, pp. 515–533, Jul. 2013, https://doi.org/10.1016/j.ymssp.2012.12.014
-
J. H. Kim, “Fault detection for manufacturing home air conditioners using wavelet transform,” International Journal of Precision Engineering and Manufacturing, Vol. 17, No. 10, pp. 1299–1303, Oct. 2016, https://doi.org/10.1007/s12541-016-0154-1
-
D. E. Newland, “Wavelet analysis of vibration: part 1-theory,” Journal of Vibration and Acoustics, Vol. 116, No. 4, pp. 409–416, Oct. 1994, https://doi.org/10.1115/1.2930443
-
Newland D. E., “Harmonic wavelet analysis,” Proceedings of the Royal Society of London. Series A: Mathematical and Physical Sciences, Vol. 443, No. 1917, pp. 203–225, Oct. 1993, https://doi.org/10.1098/rspa.1993.0140
-
H. Nguyen, J. Kim, and J.-M. Kim, “Optimal sub-band analysis based on the envelope power spectrum for effective fault detection in bearing under variable, low speeds,” Sensors, Vol. 18, No. 5, p. 1389, May 2018, https://doi.org/10.3390/s18051389
About this article

The authors are grateful for financial support from the State Key Laboratory of Air-conditioning Equipment and System Energy Conservation (ACSKL2019KT01).
