Abstract
In order to solve the problem that the reconstruction accuracy and integrity are affected due to the large amount of point cloud data in the process of building space reconstruction, the visual reconstruction method of building space under laser point cloud big data is studied. The three-dimensional laser scanner is used to collect the laser point cloud big data in the building space, and the laser point cloud big data is organized and processed through three steps: hierarchical calculation of the point cloud pyramid, thinning treatment and block treatment. From the processing results of laser point cloud big data, the line features of building space are extracted based on the improved Mean-shift method, and the continuous broken lines in the point cloud data of building space are extracted by using the double radius threshold line tracing method. According to the feature extraction results of point cloud data in building space, the visual reconstruction of building space is completed through the process of translation matching and space matching. The experimental results show that this method can realize the visual reconstruction of architectural space, and the average reconstruction accuracy is higher than that of 97 %, and the reconstruction completion and smoothness are higher than 95 %.
1. Introduction
With the rise of digital city construction, the three-dimensional model of buildings plays an important role in urban planning, urban management, geological mapping, urban transportation and other fields [1]. The traditional three-dimensional modeling of buildings adopts manual photogrammetry technology, which has high time and labor costs. Therefore, it is not suitable for digital city projects with a large number of building models and complex structures and types [2]. The cost of laser scanning technology is low, and it can quickly obtain massive spatial point data, and the obtained data has the characteristics of high point cloud density and high integrity [3]. Three-dimensional laser scanning technology makes up for the shortcomings of traditional measurement methods. It obtains the data of the scanned object surface by three-dimensional scanning, and after subsequent processing and analysis [4], it can get more valuable information, which has become an important technical means of spatial data acquisition. Three-dimensional laser scanning technology combines surveying and mapping, computer, communication, instrument processing and manufacturing, graphic image and other technologies [5], which can not only directly obtain the three-dimensional coordinates of the target surface, but also obtain information such as gray value and reflection intensity value. Moreover, through data processing [6], it can obtain information such as normal vector and curvature from point cloud data, which can better reflect the detailed characteristics of the target. Three-dimensional laser scanning technology can quickly obtain data [7], which is less affected by external environment and has strong real-time performance; The obtained data is large in quantity and high in accuracy; Data is rich in information. Combined with the above characteristics, 3D laser scanning technology plays an important role in virtual reality, digital city, ancient building protection, planning and design, and other fields.
Buildings are the main components of urban scenes [8], and the research on three-dimensional reconstruction of buildings has always been the focus of research on three-dimensional reconstruction of urban scenes. In this paper, facing the actual needs of 3D reconstruction of building space, aiming at the shortcomings of 3D point cloud data generation, processing and model generation, the 3D reconstruction of building is deeply studied. Visual reconstruction of architectural space has become a key issue in the field of computer vision [9], which has the same high application value as face recognition and target tracking. Three-dimensional reconstruction was first established on the basis of binocular vision, and then developed into multi-view reconstruction.
At present, there are many researchers who study the visual reconstruction of architecture. Nguyen et al. studied the reconstruction of buildings in civil engineering [10]. This method applied the distributed computing method to large-scale point cloud data processing, and introduced the solution of B-EagleV to realize the visualization of buildings in civil engineering, which provided a foundation for data management, progress monitoring and other applications in the construction process. Anazco et al. used the deep convolution neural network to reconstruct the three-dimensional view [11]. This method set up a three-dimensional shape reconstructor, and used full convolution blocks to improve the accuracy of material reconstruction and reduce the calculation of three-dimensional reconstruction. Omati et al. applied synthetic aperture radar tomography technology to the three-dimensional reconstruction of urban technology [12]. This method can improve the performance of building reconstruction by collecting a large number of radar images and performing tomographic inversion. Although the above methods can realize the three-dimensional reconstruction of buildings, there are some defects that the reconstruction process is too complicated and the reconstruction time is too long because the laser point cloud data is not preprocessed. Aiming at the problems of the above methods in the visual reconstruction of architecture, this paper studies the visual reconstruction method of architectural space under laser point cloud big data. The laser scanning system is used to scan the point cloud data of the building space, and the visual reconstruction of the building space is carried out according to the collected point cloud data, so that the three-dimensional building model is more applicable.
2. Visual reconstruction method of architectural space visualization
2.1. Building space laser point cloud big data collection and organization methods
2.1.1. Laser point cloud big data collection in building space
In order to obtain the complete 3D laser point cloud data, the following layout principles of 3D laser scanners should be followed: First, through on-the-spot reconnaissance, the operation scope should be arranged according to the topographic features and features of the survey area, and scanning stations should be arranged, and the positions of scanning instruments should be reasonably arranged to ensure that the data of adjacent stations have overlapping parts [13]. At the same time, the number of stations should be reduced as much as possible, so as to reduce the amount of data and the splicing error before the stations. Secondly, ensure less occlusion and avoid interference from other people, so that the data contains complete building space information.
When collecting the big data of laser point cloud in building space, the building is scanned by Rigel VZ-600 3D laser scanner, the scanning speed is 127,000 pts/s, and the point spacing of the scanner is < 1 mm; The distance accuracy is ±6 mm, and the scanning field of view is 360°×100° (horizontal× vertical). Set the scanning mode of collecting laser point cloud big data in building space as long distance mode. The three-dimensional point cloud data of building space is obtained at different sites, so that the building can be completely scanned and the building target can not be missed.
2.1.2. Laser point cloud big data organization method based on point cloud pyramid
The big data of building laser power supply collected by three-dimensional laser scanner contains massive point cloud data. The point cloud pyramid method is used to organize and process the collected building laser point cloud big data, which simplifies the visual reconstruction process of building space visualization. Point cloud pyramid is a kind of point cloud data organization structure similar to image pyramid type. Its basic principle is the same as that of the image pyramid, that is, the idea of layering and blocking is used to organize point cloud data [14], but the difference is that the image data adopts the method of image resampling and two-dimensional blocking, while the point cloud pyramid uses point cloud data thinning and spatial blocking to organize point cloud data. The pyramid structure with a factor of 2 is adopted. During the construction, the laser point cloud data of the original building are thinned out according to the different thinning ratios [15]. The point cloud data size of the upper layer in the pyramid structure is 1/4 of that of the lower layer, and the data range is 4 times that of the lower layer. The construction method of point cloud pyramid is similar to that of image pyramid, which is mainly divided into two steps: data thinning and data blocking. The specific steps are as follows.
2.1.2.1. Hierarchical calculation of point cloud pyramid
The first step of constructing a point cloud pyramid is to calculate the levels. The number of pyramid levels will directly affect the size of the partitioned data block, so its level depth will affect the efficiency and visualization effect of reading and displaying point cloud data. Data block is the smallest unit of point cloud rendering, and the size of data block has a great influence on the final rendering speed [16]. The larger the block, the more data each block has, and the slower the scheduling display speed; On the contrary, the smaller the block, the more trivial the data block, which is not conducive to data organization and management. Number of levels of pyramidis determined by the number of original point cloud data points and the number of top point cloud data points, and the calculation formula is as follows:
where, is the number of points in the original point cloud data, is that numb of points in the top point cloud data, is the thinning ratio, in order to ensure the consistency of the data volume of point cloud blocks in each layer, set is 4. For thelayer point cloud except the top layer, the number of points is:
The set of all layer points is consistent with the number of original data points to avoid data redundancy.
2.1.2.2. Thinning of laser point cloud big data
The point cloud data density of laser scanning hardware is very high, which meets the accuracy requirements of various applications. According to the requirements of different applications for point cloud data, the original point cloud data are thinned to different degrees. Point cloud pyramid is a hierarchical data structure, which requires multi-resolution thinning of point cloud data. For rapid visualization of point cloud data, it is required to read point cloud data as few times as possible and minimize data redundancy [17]. The multi-resolution point cloud data thinning method based on dot number is used to dilute the laser point cloud data. The basic flow of this method is as follows:
(a) Sort all point cloud data from 0.
(b) Setting the thinning ratio as follows, first take out data point with integer times of point number but not integer times of . The point cloud data taken out is the point cloud data of layer 0.
(c) In respect of the layer data, take out data point with integer times of point number but not integer times of , the point cloud data taken out is the layer data.
(d) For alayer point cloud data model, take out the point cloud data with an integer multiple of the point number is the data of layer .
The above method can complete the whole thinning process only by circulating the point cloud data of the whole building once, and the thinning algorithm has high efficiency and low complexity; In terms of data accuracy, the data accuracy of the original point cloud data is completely preserved [18]. The total data volume after thinning is the same as the original point cloud data volume, and the point cloud data of each layer is unique, so there is no data redundancy.
2.1.2.3. Block processing of laser point cloud big data
Point cloud data with different resolutions are formed after thinning, so it is necessary to block the point cloud data with different resolutions. The size of data block directly affects the effect and efficiency of data visualization. Building laser point cloud big data is a three-dimensional spatial distribution data type [19], and its data distribution range in the horizontal direction is much larger than that in the elevation direction, which can be regarded as a two-dimensional data.
According to the actual characteristics of building laser point cloud big data, the sparse point cloud data is divided into blocks by using the hybrid spatial grid division method, and for the data range is point cloud data, setting , the minimum square side length surrounding the whole point cloud data area is. The block processing process is as follows:
(a) For the top-level point cloud data aft thinning is not processing in blocks, and the file is named by using the data range of the data block.
(b) For the point cloud data of the second layer, judging if is greater than , if yes, the point cloud data of this layer is divided into grid blocks in the plane direction, and the grid size is ; If not, block the point cloud data of this layer with a spatial grid with the size of .
(c) For the layer point cloud data, judging if is greater than . If yes, divide the point cloud data of this layer into four equal parts in the plane direction and divide them into four sides with the length of point cloud data block; If not, divide the point cloud data of this layer into eight equal parts in space, and divide them into eight sides with the length of point cloud data block.
(d) Performing point cloud blocking in step (b) on the thinned point cloud data of all levels until the thinning point cloud data of all levels are blocked.
The segmented building laser point cloud big data forms a tower-shaped data structure similar to the image golden pagoda, that is, the point cloud golden pagoda data model.
2.2. Feature extraction of laser point cloud big data in building space
The characteristics of laser point cloud big data in building space are extracted from the results of laser point cloud big data organization and processing.
2.2.1. Feature extraction of building space lines based on improved mean-shift
The amount of three-dimensional point cloud data in building space is huge, so it takes a long time to directly use point cloud data for plane segmentation, although the method is intuitive. At the same time, when the three-dimensional laser point cloud data of building space contains curved walls, building curved walls by plane or piecewise linear fitting will cause the model to be imprecise, and surface modeling can be transformed into curve extraction by building slices, so an effective curve feature extraction method is needed. Using the improved Mean-shift point cloud line feature extraction method, the building space line feature is extracted. Firstly, the concepts of straight line and curve are defined. Line features include straight line segments and non-straight curve segments. A straight line is a series of points with the same direction. On the contrary, the direction of a curve will change from one point to another. The curve is represented by a series of uniform sampling points, while the straight line can be represented by both uniform sampling points and two points, depending on the specific situation. In order to simplify the problem of feature extraction, the original unordered point cloud is transformed into an orderly organization form of hierarchical structure [20], that is, it is processed by slicing. The basic idea of the point cloud slicing method is that the original point cloud is segmented by a set of parallel planes along a given direction and at a given interval, and the layered point cloud is projected onto the corresponding reference plane to form an outline point cloud slice. Point cloud slicing technology can segment scattered point clouds in layers, and the segmentation direction can be user-defined direction or along the axis, axis or axis.
Based on the assumption of Manhattan space, the reconstruction direction is generally select axis direction when building space modeling, the number of division layers is user-defined. Suppose there are scattered point clouds , , point cloud coordinate range can be recorded as . Suppose along axis direction for hierarchical segmentation of building space point cloud data, the number of layers is , the thickness of each layer is:
where, is the layered thickness.
The layered point cloud is sliced by the projection plane method. For the layered point cloud, the middle position is defined as the projection reference plane of the layer, and all the data points in the layer are projected to the reference plane to form a point cloud slice.
The calculation formula of each reference plane is as follows:
where, represents the projection reference plane of the layer , and the normal vector of the plane points in the positive direction of the axis, representsvalue of the lowest projected reference plane.
2.2.2. Line tracing with double radius threshold
The double radius threshold line tracing method is used to extract the continuous polyline from the point cloud data of building space. Using distance threshold speed up the search and ensure the continuity and smoothness of the building polyline. The basic steps of line tracing algorithm with double radius threshold are as follows:
(1) Construct a tree of the point cloud slice;
(2) Randomly select a point and search for the nearest neighbor within its radius, computing the main direction of the point cloud according to the nearest neighbor set . Search along the main direction, and then search along the reverse direction of the main direction.
(3) Perthrough the nearest neighbor within the radius to obtain all points whose distance to the current point is greater than , the point with the smallest angle was added to the curve branch as new points and marked as a node. All points that less than are marked as visited.
(4) Until there are no neighboring points that meet the conditions, merge two curves searched in opposite directions and return the curves.
(5) Repeat steps (2)-(4) until all slicing points are marked as visited and branching points.
2.2.3. Straight line discrimination of building space
The curve obtained by tracing consists of a series of nodes, and the distance between adjacent nodes is relatively uniform. After the online tracking step, the detected building wall lines need to be divided into straight lines and curves. It is assumed that the detected building curve can be defined by defining a pair to represent, in which is a point on a straight line, is the direction vector of a straight line. The value of takes the median of all vertex positions in the polyline. is a normalized direction vector, and its value is determined by the median of the direction vector of each component straight line segment of a polyline:
The calculation formula of the distance from each vertex of the building to the estimated straight line is as follows:
The angle between the vector from each point to the center point and the linear direction vector is calculated as follows:
When and established simultaneously at the same time, is a straight line; Otherwise, is a curve.
2.2.4. Regularization of building space
Walls, doors, windows and other structures in architectural space usually present plane or straight-line geometric characteristics, mostly parallel or orthogonal. There is noise in 3D laser point cloud data, and the line feature extraction results will deviate from these rules. Therefore, it is necessary to regularize 3D laser point cloud data of buildings. The initial values of parameters of straight line segment are obtained by using the median of line point coordinates and the median of line direction. The straight line parameter is expressed as , record the included angle between other straight lines and reference straight lines as , is the angle threshold, and the expression can be obtained as follows:
If the first line refers to a straight line containing the maximum number of point clouds , then the conditional rules of the other orthogonal and parallel lines are defined as: When is parallel; When is orthogonal.
In the process of point cloud data regularization, in order to obtain the optimal straight line parameters for each straight line, the constrained least square method is used to solve this problem. For each straight line, it can be expressed by a straight line equation as follows:
The straight line equation corresponding to the straight line segment projected by the reference wall line can be expressed as:
If the line is parallel to the reference line, there are:
If the line is perpendicular to the reference line, there are:
Using the above process, a linear equation group is obtained. , in which is a coefficient matrix representing a system of linear equations, represents an unknown parameter vector, because , can get . QR decomposition is made with coefficient matrix , make the singular value SVD decomposition of the triangular array in the decomposition result to obtain the final solution of . After the wall lines of buildings are regularized vertically and parallelly, the collinearity rule is used to merge the parallel straight line segments whose mutual distance is less than a given threshold, and the collinearity line segments are merged by the average method.
2.3. Visual reconstruction method of architectural space visualization
2.3.1. Translation matching of characteristic points of building laser point cloud big data
The initial value of translation matrix of laser point cloud big data in building space is determined, which provides the basis for feature point matching. For the selection of the initial value of the translation matrix, the centroid of two reconstructed point clouds is obtained. Let an arbitrary set of three-dimensional point clouds , which should contain complete three-dimensional structural information of the target, and solve the number of point clouds in each point domain, determines the weight of a single point, which is inversely proportional to the number of point clouds, that is, when the neighborhood of a certain point its number of inner point clouds is , its weight is ( is constant). When the number of point clouds in the neighborhood is 0, this point is likely to be a wrong matching point, so its weight is defined as 0, and then the weighted average coordinates of all points are calculated:
Similarly, it can be calculated , and finally get the point which is the geometric center coordinate of the point cloud, and then, the weighted average distance from all point clouds to is calculated as follows:
Similarly, the weighted average distance from point to within point set can be calculated, and the initial scale factor can be calculated by formula .
The coordinate difference between two groups of point clouds is used as the initial value of translation matrix and applied to plane registration of point cloud data:
Finally get is the initial value of registration.
2.3.2. Spatial matching of big data features of building laser point clouds
Through multi-view model registration, the visual reconstruction of architectural space is completed. The process of model registration is to match and align the point clouds obtained from different viewpoints, which is an important step in the process of obtaining the object surface contour and 3D reconstruction of the scene. Find the two closest points in two point clouds on the object, and use them as corresponding points in the process of processing, find out all such point pairs, and then calculate the rotation and translation transformation between the two point clouds according to these point pairs. The purpose of model registration is to find a rigid transformation between two local point clouds, so that one point cloud can overlap with the other point cloud best after transformation. Iterative Corresponded Point, ICP method (ICP) is used to reconstruct the architectural space visually. This method gives two three-dimensional data points set in different coordinate systems, and solves the spatial transformation of these two three-dimensional data points sets, so that they can accurately match in space.
If the first three-dimensional data point set is represented by , the second three-dimensional data point set is represented by , the objective function of two point sets alignment matching is as follows:
ICP algorithm is actually an optimal matching algorithm based on the least square method, which repeatedly executes the process of “determining the corresponding relation point set-calculating the optimal rigid body transformation” until it meets a convergence criterion representing correct matching. The purpose of ICP algorithm is to find the rotation matrix between the reference point set and the target point set and translation vector the transformation between two sets of matching data can meet the optimal matching under a certain metric criterion. Make the coordinate of the target point set is to be , the coordinates of reference point set is , in the iteration, the point coordinate corresponding to the coordinate of the point set is , solve the transformation matrix between and , the original transformation is updated until the average value of the distance between the data is less than the given threshold. The detailed steps are as follows:
(1) Take a subset contained in the target point set .
(2) Solve a reference point set with its corresponding point , make .
(3) Determine the rotation matrix and translation vector , to satisfy the value of its smallest .
(4) Calculate .
(5) Calculate .
(6) If is greater than or equal to a given value , return (2) until or the number of iterations is more than the preset maximum number of iterations.
The ICP algorithm is calculated by the optimal analytical method and with its corresponding points in the two-point set are matched by the transformation between them, and the registration parameters between the data sets are optimized by iteration. The singular value decomposition method is used to optimize the analysis. If the motion parameters are represented by matrix , point set of and are given at the same time. At any point , after transformation, it is a point such as . The error of that corresponds to the corresponding point is . The total error is:
In order to convert the rotation matrix and displacement vector we subtract the coordinates of all points from the coordinates of the center of mass of these points. Set is the center of mass of point set , set is the center of mass of point set , then the displaced point is: , . Use a unit quaternion represent rotation matrix , where the unit quaternion meet the conditions: , .
The cross covariance matrix of point set and point set is:
Among them, and respectively represent the center of mass point sets and . Using anti-symmetric matrix and column vector construct a 4×4 symmetric matrix:
Among them, is a 3×3 identity matrix. The unit eigenvector corresponding to the maximum eigenvalue of matrix is the quaternion that satisfies the rotation matrix, and the rotation matrix is calculated. After calculating the rotation matrix , combined with the translation matrix , each point in the 3D point cloud reconstructed by one viewpoint using and , is transformed according to equation to obtain the coordinate value of this point cloud under the coordinate system of the 3D point cloud reconstructed from another perspective, the two groups of point clouds are placed in the same coordinate system to obtain the final visual reconstruction result of architectural space visualization. The results of visual reconstruction of architectural space are visually displayed by Lumoin3D software, which is a three-dimensional visualization software, including a rich model base, and intuitively displays the results of three-dimensional visual reconstruction of architectural space.
3. Results
In order to verify the visual reconstruction method of building space based on laser point cloud big data and to reconstruct the effectiveness of building space, a building in a commercial district of a city is selected as the research object, and the building space of this building is visually reconstructed by this method.
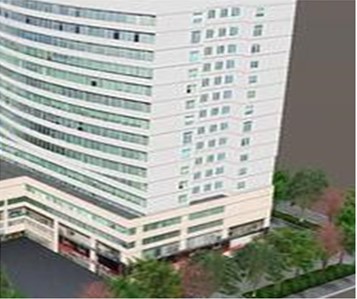
The three-dimensional laser scanner used in this method is used, and the building laser data collected are shown in Fig. 1.
From the experimental results in Fig. 1, it can be seen that the three-dimensional laser scanner can be used to effectively collect the laser scanning data of buildings.
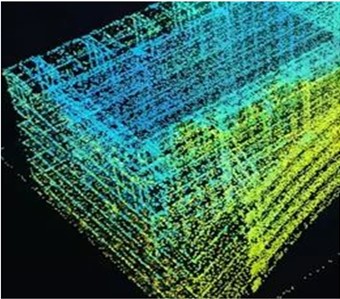
From the laser scanning data of the building, the laser point cloud data of the building space is extracted, and the collection result of the laser point cloud data of the building space is shown in Fig. 2.
From the laser point cloud data in Fig. 2, it can be seen that the laser point cloud data can be effectively extracted from the laser scanning results by this method. This method takes laser point cloud data as the basis of visual reconstruction of architectural space visualization, and realizes visual reconstruction of architectural space visualization by processing the laser point cloud data of architectural space.
Fig. 1Results of laser scanning of buildings by 3D laser scanner
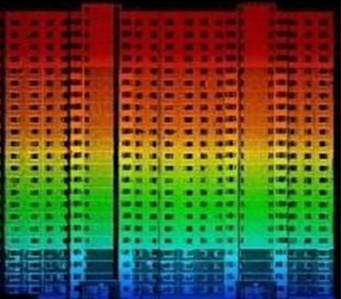
Fig. 2Laser point cloud data
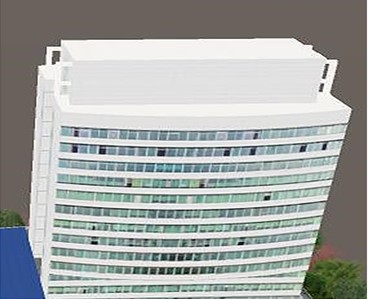
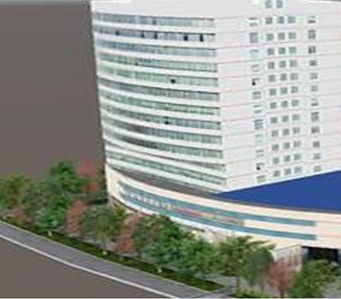
By using the collected laser point cloud data of building space, the visual reconstruction of building space is carried out by this method. The results of visual reconstruction of architectural space from different angles are shown in Fig. 3.
Fig. 3Visual reconstruction results of architectural space visualization
a)
b)
c)
As can be seen from the experimental results in Fig. 3, the architectural space can be visually reconstructed according to the laser point cloud big data of the architectural space. Further analysis of the visual reconstruction results in Fig. 3 shows that the reconstruction results of architectural space from different angles are highly unified, which verifies that the visual reconstruction of architectural space with this method can obtain architectural space from different visual angles and improve the application of the reconstruction results of architectural space.
Ten test points are randomly selected from the results of visual reconstruction of architectural space by this method. The corresponding relationship between the actual coordinates of the selected test points and the coordinate points in the 3D reconstruction results of the building space is counted, and the error value and error ratio of each test point are calculated. The calculation process is shown in Eq. (21) to (22):
Among them, represents the actual coordinate point, represents the reconstructed coordinate point, represents the mean error after reconstruction for 10 test points, and represents the mean error ratio after reconstruction for 10 test points.
The results obtained by statistics and the final error value and error ratio results are shown in Table 1.
Table 1Coordinate comparison of test points
Test point sequence number | Actual coordinate point / m | Reconstructed coordinate point / m | Value of error | Ratio of error / % | ||||
X-axis | Y-axis | Z-axis | X-axis | Y-axis | Z-axis | |||
1 | 25.6 | 84.7 | 16.4 | 25.3 | 84.3 | 16.5 | 0.5099 | 0.57 |
2 | 305.4 | 186.4 | 13.5 | 305.6 | 186 | 13.4 | 0.4583 | 0.13 |
3 | 1052.6 | 1564.5 | 9.9 | 1052.5 | 1564.3 | 9.6 | 0.3742 | 0.02 |
4 | 864.4 | 1066.5 | 23.5 | 864.1 | 1066.6 | 23.4 | 0.3317 | 0.02 |
5 | 2064.5 | 1054.5 | 14.5 | 2064.2 | 1054.7 | 14.4 | 0.3742 | 0.02 |
6 | 3012.5 | 596.8 | 16.8 | 3012.7 | 596.4 | 16.7 | 0.4583 | 0.01 |
7 | 425.6 | 415.6 | 17.5 | 425.3 | 415.2 | 17.6 | 0.5099 | 0.09 |
8 | 284.5 | 315.5 | 5.8 | 284.7 | 315.1 | 5.7 | 0.4583 | 0.11 |
9 | 195.4 | 256.8 | 3.6 | 195.1 | 256.9 | 3.7 | 0.3317 | 0.10 |
10 | 97.5 | 105.6 | 1.8 | 97.2 | 105.2 | 1.7 | 0.5099 | 0.35 |
As can be seen from the experimental results in Table 1, in the visual reconstruction results of the building space obtained by this method, the difference between the actual coordinates of the test points and the coordinates in the 3D space is very small, with an average error value of 0.4316 and an average error ratio of 0.14 %. The experimental results in Table 1 show that the point cloud matching method used in this method can realize the accurate matching of point cloud big data feature points in building space, and provide a good foundation for improving the three-dimensional reconstruction performance of building space.
Statistically, this method is used to visually reconstruct the building space, and compared with the 3D shape reconstruction method of view object based on deep u-net convolutional neural network in literature [11], the reconstruction accuracy, reconstruction completion and reconstruction smoothness of the two methods reconstruction results are shown in Fig. 4.
Fig. 4Rebuild the performance test
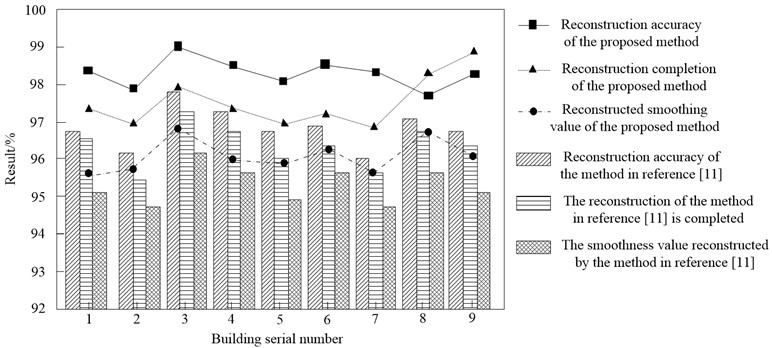
From the experimental results in Fig. 4, it can be seen that the reconstruction accuracy, reconstruction completion and reconstruction smoothness are all higher than 95 % by using the laser point cloud big data to visually reconstruct the building space. Using this method to visually reconstruct the architectural space, the reconstruction results are complete, and the complete visual experience of the architectural space is presented to users through the visual interface. The smoothing value of the reconstruction results of building space is high, which verifies that the line features of building space extracted by this method have high continuity, and the line features in laser point cloud big data and other building space features are relatively intact. The method in this paper has high stability in visual reconstruction of architectural space, and the error of local point cloud characteristics of architectural space is controlled to the minimum, so the results of reconstruction completion and reconstruction smoothness are ideal. The reconstruction accuracy of the building space obtained by this method is higher than that of 97 %, which verifies the reconstruction performance of this method. The experimental results in Fig. 4 show that this method has high reconstruction performance and meets the practical application requirements of visual reconstruction of architectural space.
In order to further explore the practical application effect of the method presented in this paper, the large data of laser point cloud in building space was measured in detail in this study, including statistical indicators such as uncertainty, sensitivity and confidence interval. The experimental measurement process will be introduced in detail below.
In order to evaluate the uncertainty in the feature extraction process of building laser point cloud big data, repeated measurements were first made and the uncertainty was calculated using statistical methods. By analyzing the data of many repeated measurements, the possible error range in the process of feature extraction is calculated. Standard deviation is used to measure the difference between the measured values, and then the uncertainty of the measured results is obtained. Its formula can be expressed as:
where represents each measurement, represents the mean of all measurements, and represents the number of data.
Sensitivity usually refers to the response speed of the system output to the change of the system input. In this paper, by changing the parameters in the extraction algorithm, we observe its influence on the final result, and compare the extraction effect under different parameter Settings. It can be calculated by the following formula:
where represents sensitivity, represents the final result, represents the initial result, and represents the amount of change.
Finally, the confidence interval of the feature extraction results of laser point cloud big data of building space is calculated. By analyzing the distribution of the experimental data, the confidence interval of the feature extraction results was calculated by statistical method to evaluate the reliability and stability of the results. The calculation process can be expressed as the following formula:
where represents the standard error, then is the critical value of the T-distribution related to the confidence level and the degree of freedom.
Based on the above experimental process and calculation formula, the results of uncertainty, sensitivity, confidence interval and other statistical indicators are obtained, as shown in Table 2.
Table 2Measure the results of statistical indicators
Experimental sequence number | Uncertainty (%) | Sensitivity score | Confidence interval (95 %) |
1 | 0.7 | 9.4 | ±0.05 |
2 | 0.8 | 9.5 | ±0.02 |
3 | 0.6 | 9.6 | ±0.08 |
4 | 0.4 | 9.7 | ±0.02 |
5 | 0.5 | 9.5 | ±0.04 |
6 | 0.7 | 9.4 | ±0.06 |
7 | 0.4 | 9.8 | ±0.02 |
8 | 0.5 | 9.7 | ±0.03 |
9 | 0.8 | 9.4 | ±0.05 |
10 | 0.5 | 9.6 | ±0.07 |
Through the analysis of experimental data, we can see the uncertainty, sensitivity scores and confidence intervals under different experimental serial numbers. First, in terms of uncertainty, the experimental results show a certain range of variation, from the lowest 0.4 % to the highest 0.8 %, which indicates that there is a certain degree of measurement error in the feature extraction process, but the overall level is still high. Second, the sensitivity score fluctuated between 9.4 and 9.8, indicating that the system's response speed to input changes varied under different Settings, but the overall performance was good. Finally, the confidence interval varies between ±0.02 and ±0.08, which reflects the degree of certainty of the feature extraction results. The smaller the confidence interval, the more reliable the results. By comprehensive analysis of these data, we can see that the experimental results are stable, with high accuracy and reliability. All in all, these experimental data provide a useful reference for the feature extraction of laser point cloud big data in building space, and provide an important guiding significance for future research and practical application.
4. Conclusions
Aiming at the defects of low reconstruction accuracy and completeness in the existing three-dimensional reconstruction methods, a visual reconstruction of building space is carried out based on laser point cloud big data. This method organizes and processes the laser point cloud big data to solve the problem that the laser point cloud big data is too large and affects the reconstruction efficiency. The features in the laser point cloud data of building space are extracted, and the visual reconstruction of building space is realized by using the extracted features. Through experiments, a complete result of building space reconstruction is obtained. This method ensures the reconstruction accuracy, and at the same time, the reconstruction integrity of architectural space is high, which improves the visual reconstruction effect of architectural space.
References
-
Y. Zhou et al., “Building information modeling‐based 3D reconstruction and coverage planning enabled automatic painting of interior walls using a novel painting robot in construction,” Journal of Field Robotics, Vol. 39, No. 8, pp. 1178–1204, Jun. 2022, https://doi.org/10.1002/rob.22103
-
Y. Wang, T. Zhou, H. Li, W. Tu, J. Xi, and L. Liao, “Laser point cloud registration method based on iterative closest point improved by Gaussian mixture model considering corner features,” International Journal of Remote Sensing, Vol. 43, No. 3, pp. 932–960, Feb. 2022, https://doi.org/10.1080/01431161.2021.2022242
-
H. Aljumaily, D. F. Laefer, D. Cuadra, and M. Velasco, “Voxel change: big data-based change detection for aerial urban LiDAR of unequal densities,” Journal of Surveying Engineering, Vol. 147, No. 4, p. 04021023, Nov. 2021, https://doi.org/10.1061/(asce)su.1943-5428.0000356
-
Z. Wu, H. Jiang, and S. He, “Symmetry detection of occluded point cloud using deep learning,” Procedia Computer Science, Vol. 183, No. 12, pp. 32–39, Jan. 2021, https://doi.org/10.1016/j.procs.2021.02.027
-
X. Ma and J. Li, “Design of emergency evacuation route for large buildings based on cloud computing and GIS big data,” Journal of Intelligent and Fuzzy Systems, pp. 1–12, Mar. 2024, https://doi.org/10.3233/jifs-237834
-
S. Park, S. Ju, S. Yoon, M. H. Nguyen, and J. Heo, “An efficient data structure approach for bim-to-point-cloud change detection using modifiable nested octree,” Automation in Construction, Vol. 132, p. 103922, Dec. 2021, https://doi.org/10.1016/j.autcon.2021.103922
-
J. Hu and Y. Peng, “Three dimensional numerical simulation of temperature retrogression of new titanium alloy muzzle,” (in Chinese), Ordnance Material Science and Engineering, Vol. 44, No. 2, pp. 98–102, 2021, https://doi.org/10.14024/j.cnki.1004-244x.20210303.005
-
G. Uggla and M. Horemuz, “Towards synthesized training data for semantic segmentation of mobile laser scanning point clouds: generating level crossings from real and synthetic point cloud samples,” Automation in Construction, Vol. 130, p. 103839, Oct. 2021, https://doi.org/10.1016/j.autcon.2021.103839
-
A. T. T. Phan and N. T. Huynh, “Generating 3d point-cloud based on combining adjacent multi-station scanning data in 2d laser scanning: a case study of hokuyo utm 30lxk,” Archives of Civil Engineering, Vol. 67, No. 4, pp. 451–467-451-467, Dec. 2021, https://doi.org/10.24425/ace.2021.138511
-
M. H. Nguyen, S. Yoon, S. Ju, S. Park, and J. Heo, “B-eaglev: visualization of big point cloud datasets in civil engineering using a distributed computing solution,” Journal of Computing in Civil Engineering, Vol. 36, No. 3, p. 04022005, May 2022, https://doi.org/10.1061/(asce)cp.1943-5487.0001021
-
E. Valarezo Añazco, P. Rivera Lopez, and T.S. Kim, “Three‐dimensional shape reconstruction of objects from a single depth view using deep U‐Net convolutional neural network with bottle‐neck skip connections,” IET Computer Vision, Vol. 15, No. 1, pp. 24–35, Jan. 2021, https://doi.org/10.1049/cvi2.12014
-
M. Omati, M. R. Sahebi, and H. Aghababaei, “The comparative study of three nonparametric methods of sar tomography for building reconstruction,” Advances in Space Research, Vol. 69, No. 4, pp. 1743–1751, Feb. 2022, https://doi.org/10.1016/j.asr.2021.07.043
-
Z. Lin, X. Chen, C. Di, J. Yu, P. Peng, and C. Yu, “Modeling and analysis of light detection and ranging point cloud error in vibration state of airborne platform,” Optical Engineering, Vol. 61, No. 2, p. 024103, Feb. 2022, https://doi.org/10.1117/1.oe.61.2.024103
-
Y. Xu, X. Shen, and S. Lim, “Cordet: corner-aware 3d object detection networks for automated scan-to-bim,” Journal of Computing in Civil Engineering, Vol. 35, No. 3, p. 04021002, May 2021, https://doi.org/10.1061/(asce)cp.1943-5487.0000962
-
K. Ohno, H. Date, and S. Kanai, “Study on real-time point cloud superimposition on camera image to assist environmental three-dimensional laser scanning,” International Journal of Automation Technology, Vol. 15, No. 3, pp. 324–333, May 2021, https://doi.org/10.20965/ijat.2021.p0324
-
X. Ma, J. Li, and X. Zhang, “Data Model of key indicators of urban architectural design based on long – and short-term convolutional memory network,” Mathematical Problems in Engineering, Vol. 2022, pp. 1–13, Mar. 2022, https://doi.org/10.1155/2022/7607928
-
J. Moyano, J. León, J. E. Nieto-Julián, and S. Bruno, “Semantic interpretation of architectural and archaeological geometries: point cloud segmentation for hbim parameterisation,” Automation in Construction, Vol. 130, p. 103856, Oct. 2021, https://doi.org/10.1016/j.autcon.2021.103856
-
M. M. Omati and M. H. Bastani, “Building profile reconstruction based on double subspace tomosar,” International Journal of Remote Sensing, Vol. 44, No. 1, pp. 276–288, Jan. 2023, https://doi.org/10.1080/01431161.2022.2161855
-
Z. W. Wang, C. Y. Liu, G. H. Fu, Q. L. Hu, J. Y. Niu, and S. F. Wang, “Full period three-dimensional (3-d) reconstruction method for a low cost single-layer lidar,” Lasers in Engineering, Vol. 49, No. 4, pp. 271–286, 2021.
-
T. Qu, D. Zhao, and W. Feng, “Structured light field three-dimensional measurement based on equivalent camera array model for highly reflective surfaces,” Optical Engineering, Vol. 61, No. 8, p. 084105, Aug. 2022, https://doi.org/10.1117/1.oe.61.8.084105
About this article

The study was supported by Research on the Practice Teaching Evaluation System of Applied Undergraduate Digital Scene Design course From the perspective of Urban Meta-Universe, 2022 Shanghai Education Science Research Project (Grant No. C2023104) and Three-Education system Integration for Teaching mode of higher vocational Art Design based on the integration of the resources of enterprises with vocational schools, 2022 Shanghai Education Science Research Project (Grant No. C2022235).
The datasets generated during and/or analyzed during the current study are available from the corresponding author on reasonable request.
Xiyin Ma: conceptualization, formal analysis, funding acquisition, methodology, investigation, software, writing – original draft preparation, writing – review and editing. Jian Li: data curation, writing – original draft preparation, visualization, supervision, resources, validation.
The authors declare that they have no conflict of interest.
