Abstract
This study analyzes the effect of a transmission tower on earthquake-induced soil liquefaction through three-dimensional numerical simulation of the Cao Tan Village site during the 2023 Ms6.2 Jishishan earthquake. The P2PSand constitutive model implemented in FLAC3D, which can effectively represent stiffness degradation and pore pressure buildup of sand under cyclic loading, was adopted to simulate the soil behavior. Synthetic seismic waves with a peak ground acceleration of 3 m/s2 were applied as dynamic input. The results show that the presence of the tower significantly modifies the liquefaction process in a depth-dependent manner. The vertical tower load increases confinement near the ground surface (0-1 m), reducing liquefaction potential (surface effective stress maintained at approximately –2.2×10⁵ Pa), while it promotes pore pressure accumulation and cyclic softening within the 5-20 m sandy silt layer, where the effective stress decreases to nearly zero. This bidirectional effect, caused by stress redistribution, indicates that structural loads can intensify liquefaction susceptibility at middle depths. The established numerical workflow successfully reproduces this complex three-dimensional interaction and provides valuable guidance for the seismic safety assessment and design of critical infrastructure in loess-covered regions.
Highlights
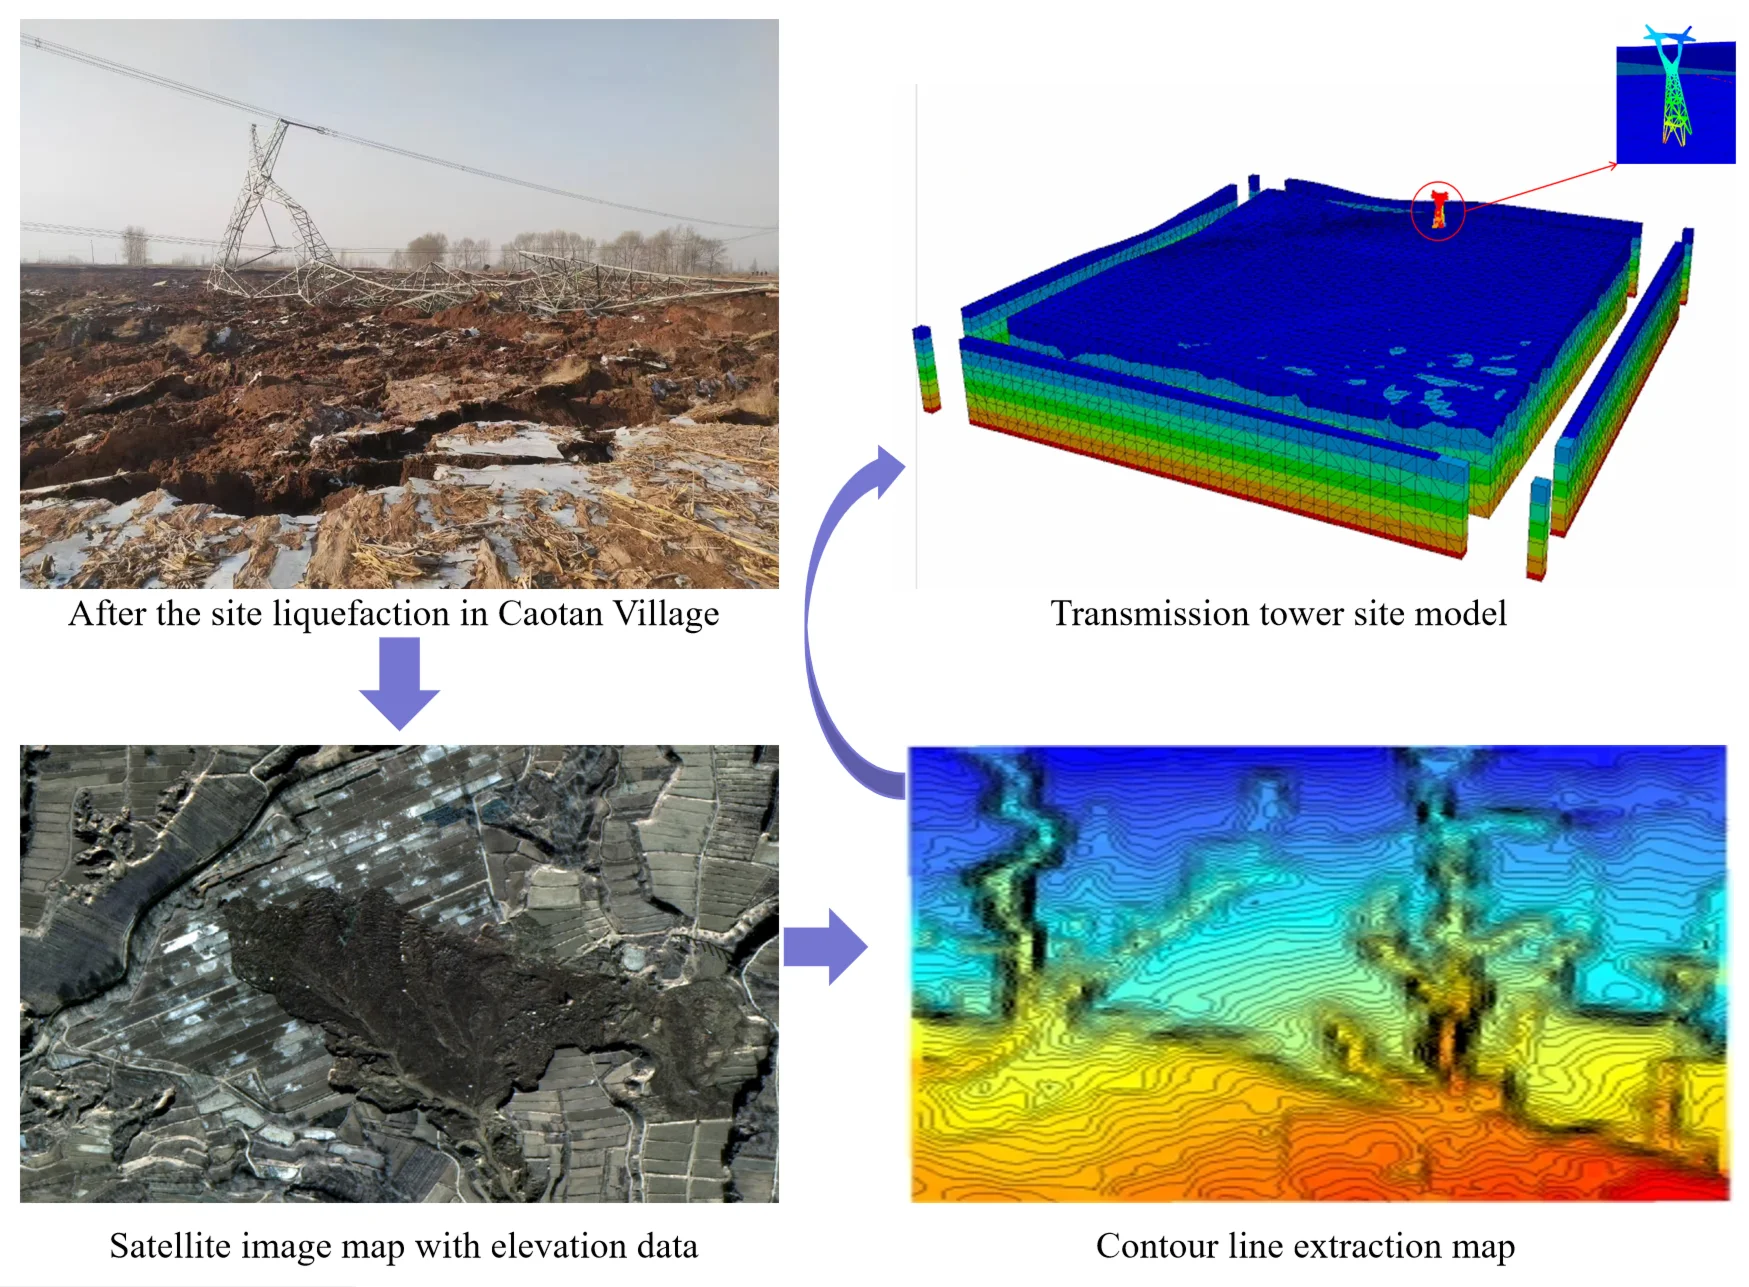
- Generate a three-dimensional site model based on elevation data.
- Structural unit represents the transmission tower structure.
- Simulation of sand liquefaction during an earthquake.
1. Introduction
The 2023 Ms6.2 Jishishan earthquake on December 18 caused severe seismic hazards, including large-scale loess liquefaction and subsequent flow slides near the epicentral area [1], [2]. Field investigations reported extensive mudflows and structural damage, revealing a strong coupling between liquefaction, slope instability, and ground deformation in loess-covered regions [3], [4]. Recent studies have examined the dynamic behavior of saturated loess and its post-failure processes; however, the influence of large infrastructure on soil liquefaction remains poorly understood [5], [6]. This paper investigates a liquefaction-affected site in Cao Tan Village, where a transmission tower collapsed during the Jishishan earthquake. A three-dimensional numerical simulation was conducted using the P2PSand model implemented in FLAC3D to analyze the interaction between tower loads and saturated sandy soils. The study focuses on the depth-dependent liquefaction mechanism and the redistribution of stress under cyclic loading. The findings provide insight into how structural loads alter liquefaction behavior and offer guidance for the seismic design and safety evaluation of critical infrastructure in loess-covered seismic zones.
2. The construction of the site model
2.1. Site overview and engineering geology conditions
The study site is located at the position of the transmission tower, situated on the edge of a gully within the Class II terrace of the Yellow River. Pre-earthquake field and laboratory investigations identified the subsurface soil as a silt-like clay resembling loess, characterized by a brownish-yellow color, slightly to fully moist condition, and a plastic to hard-plastic texture. The soil layer extends to depths greater than 10 m, where the silt content increases with depth, gradually transitioning into loess-like silt. The upper layer consists of brownish-red topsoil containing gravels, interbedded with thin sandy gravel lenses. The measured soil electrical resistivity is approximately 60 Ω·m, indicating moderate corrosivity to steel structures. The detailed engineering and geological parameters are summarized in Table 1. The site conditions can be seen in Fig. 1, which are photos of liquefied sites in Caotan Village before and after the earthquake. They were taken in the spring of 2023 and on December 19, 2023, by team member Cheng Zhenglun.
Fig. 1On-site photos
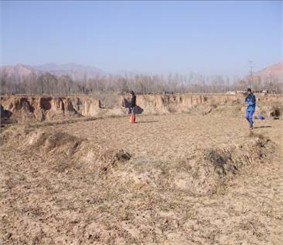
a) Before the site liquefaction in Caotan Village. Team member Cheng Zhenglun took this photo in Caotan Village, Qinghai Province, China on March 11, 2023
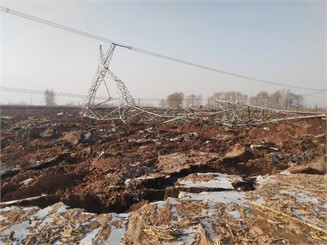
b) After the site liquefaction in Caotan Village. Team member Cheng Zhenglun took this photo in Caotan Village, Qinghai Province, China on December 9, 2023
The area is characterized by steep slopes with gradients up to approximately 35° and sparse vegetation. Several collapsible sinkholes with diameters of 0.3-0.8 m are observed near the tower foundation, particularly around leg D. A prominent gully adjacent to the site exhibits clear signs of slope collapse, with scarp heights ranging from 2.5 to 10 m. These geomorphological features indicate active erosion and potential instability, which are further aggravated by the complex topography and strong seismic susceptibility of the area.
Table 1Geological conditions of the construction site
Geological terrain area | Soil/Rock description | Layer bottom depth (m) | Unit weight, (kN/m3) | Angle of internal friction, (°) | Cohesion, (kPa) | Bearing capacity characteristic value, (kPa) | Depth of groundwater table (m) | SPT-N value (blows/30 cm) (estimated) |
On the edge of the terrace gully | Sandy loess-like fine clay | >10 | 17.5 | 17 | 21 | 160 | >10 | 5–10 |
This site was one of the areas most severely affected by sand liquefaction during the Jishishan earthquake. The combined effects of saturated silty soils, topographic amplification, and disturbance from long-term cultivation contributed to the observed liquefaction-induced failures. These factors emphasize the critical influence of local geological and geotechnical conditions on the seismic performance of the site.
2.2. Establish a site model based on elevation information
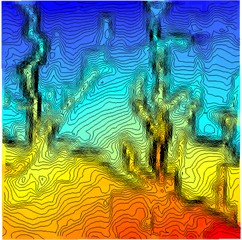
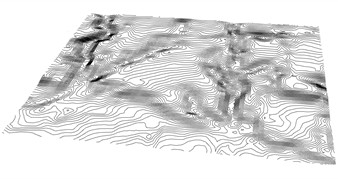
Through the 91 Satellite Assistant software, satellite image pictures with elevation data of this site were obtained, as shown in Fig. 2(a). The site model was built from a georeferenced TIF raster. The raw elevation data’s geographic coordinate system (WGS 1984) was converted to a projected system (Xian 1980 GK Zone 17) via Gauss-Krüger projection to enable metric-unit operations. Contour polylines were generated using barrier-aware tools in a GIS platform to accurately capture terrain discontinuities, then stylized and exported with preserved elevation values, as shown in Fig. 2(b).
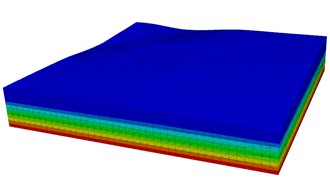
In Rhino 3D, contours were imported in meters. The model was georeferenced by aligning its bottom-left corner to a known elevation point. Irregular contours were resampled to 5-meter intervals, and a continuous digital terrain model was created using meshing commands. A 400×400 m area was extracted via Boolean trimming to remove peripheral noise, as shown in Fig. 3(a). This workflow enabled metric analysis, improved terrain feature representation, balanced detail with efficiency, and produced a spatially accurate model for engineering simulations.
The site boundary in FLAC3D used built-in free-field conditions, connecting the main grid sides to free-field grids via viscous dampers to simulate an infinite domain. Nodal forces from the free-field grid were applied to the main grid, with stresses and velocities calculated through dynamic equilibrium equations, as shown in Fig. 3(b). A 30-meter transmission tower, modeled as beam elements, was imported and rigidly connected to the ground surface, as shown in Fig. 3(c) and Fig. 3(d).
Fig. 2Remote sensing image
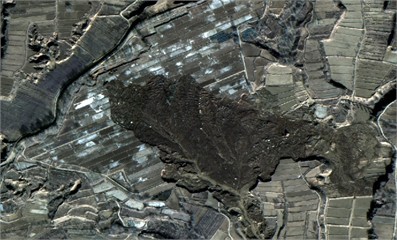
a) Satellite image map with elevation data
b) Contour line extraction map
3. Simulation of the sand liquefaction process during earthquakes
3.1. Criteria for determining sand liquefaction and selection of soil constitutive model
In this numerical simulation experiment, the determination of sand soil liquefaction is based on the fundamental mechanical mechanism of the loss of effective stress in saturated sand soil under cyclic loading. According to the effective stress principle in soil mechanics, the shear strength of saturated soil is determined by the effective stress, and its expression is:
For effective stress, σ represents the total stress, and u represents the pore water pressure. When the pore water pressure rises sharply and reaches the same level as the overlying total stress, the effective stress drops to zero, and the soil loses its shear strength, resulting in liquefaction. Therefore, in this simulation, whether the effective stress at the integration points of the elements tends to zero is used as the criterion for determining liquefaction. After inputting the seismic wave, if the effective stress in the saturated sandy soil area of the model decreases and stabilizes near zero, it is determined that liquefaction has occurred in that area.
Fig. 3Numerical simulation model
a) Three-dimensional contour model diagram
b) Numerical simulation site
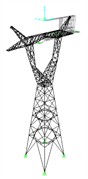
c) Transmission tower model
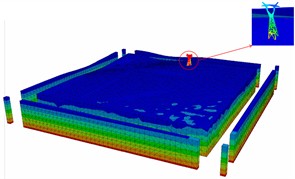
d) Transmission tower site model
The constitutive model selected for this simulation is the P2PSand model (Practical Two-surface Plasticity Sand model), which is a dual-surface plasticity sand soil constitutive model specifically developed for geotechnical earthquake engineering. Its implementation in FLAC3D has the following prominent advantages: Firstly, this model determines parameters based on relative density instead of void ratio, facilitating direct calibration using on-site standard penetration test (SPT) or static cone penetration test (CPT) data; Secondly, the model fully considers the stiffness degradation, shear expansion characteristics, and critical state behavior under cyclic loading, enabling a more realistic simulation of the dynamic response, cumulative deformation, and pore water pressure development of saturated sand soil under seismic loads; Moreover, by introducing the maximum stress ratio history record and elastic modulus attenuation factor, this model significantly improves the response prediction accuracy under cyclic loading, and is suitable for analyzing three-dimensional liquefaction problems under complex boundary conditions.
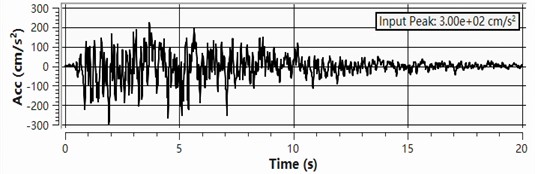
Fig. 4Artificial seismic wave waveform diagram
3.2. Liquefaction analysis with or without transmission towers
Based on the recorded data of the Jishishan earthquake, this study used synthetic seismic waves with a peak acceleration of 3 m/s2 and a duration of 20 seconds to analyze the seismic response and liquefaction possibility of the strata at a certain location in Cao Tan Village before and after the construction of the transmission tower.
Fig. 5Effective stress diagrams at different depths
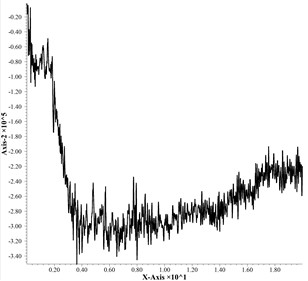
a) Effective stress at the surface without tower
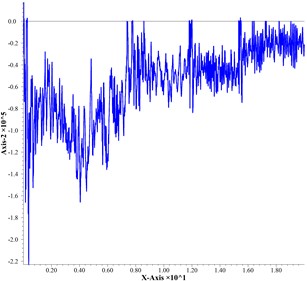
b) Effective stress at the surface with tower
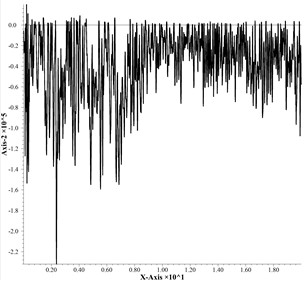
c) Effective stress at 5 m depth without tower

d) Effective stress at 5 m depth with tower
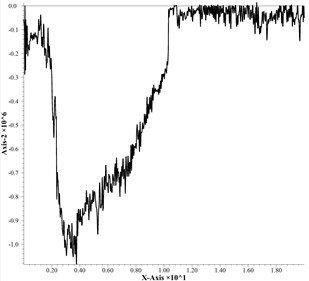
e) Effective stress at 20 m depth without tower
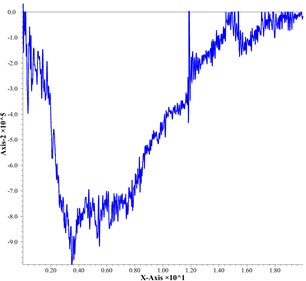
f) Effective stress at 20 m depth with tower

g) Effective stress at 65 m depth without tower
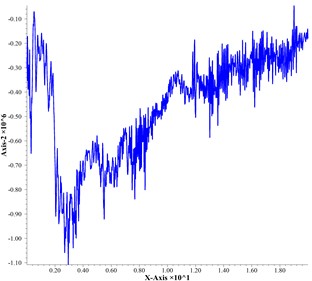
h) Effective stress at 65 m depth with tower
The soil moisture content conditions were simulated at different saturation levels: 0.8 in the range of 0-1 meter, 0.5 in the range of 1-10 meters, and 0.3 below 10 meters. The static water pressure distribution was also considered. Effective stress was monitored at the surface, 5 meters, 20 meters, and 65 meters depth. Without the transmission tower, the surface effective stress (Fig. 5(a)) remained at a relatively high level, approximately –2.0×10⁵ Pa to –3.4×10⁵ Pa, with no significant loss, indicating no liquefaction occurred. At 5 meters (Fig. 5(c)), the stress fluctuation was close to zero, indicating a critical liquefaction state. At 20 meters (Fig. 5(e)), the stress dropped sharply to –1.0×10⁶ Pa, followed by a recovery of fluctuations, indicating the beginning of liquefaction. At 65 meters (Fig. 5(g)), the stress change was minimal (approximately –1.1×10⁶ Pa), and it remained stable, without any liquefaction phenomenon. With the presence of the tower, the surface stress amplitude (Fig. 5(b)) slightly increased to –2.2×10⁵ Pa, as the load compacted the shallow soil and inhibited liquefaction, but compared to the no-tower situation, there was already a liquefaction trend. At 5 meters (Fig. 5(d)), the stress further dropped to –0.2×10⁵ Pa, which increased the liquefaction risk. At 20 meters (Fig. 5(f)), the stress dropped sharply to –9.0×10⁵ Pa, with a slow recovery rate, indicating the occurrence of plastic deformation and an increase in pore pressure. At 65 meters (Fig. 5(h)), the presence of the tower did not affect the stress change. In summary, the load of the tower directly enhanced the liquefaction trend beneath the surface of the tower, intensified the stress concentration and development of pore pressure at the 5-meter middle layer depth, changed the spatial distribution of liquefaction risk, and had a smaller impact on deeper soil layers.
4. Conclusions
The presence of the transmission tower markedly influences the liquefaction process at the site. The vertical load increases confinement at shallow depths (0-1 m) and enhances pore pressure buildup and cyclic softening within the critical 5-20 m sandy silt layer, leading to a higher liquefaction potential.
This bidirectional behavior, caused by stress redistribution, results in a sharp reduction of effective stress to near-zero levels at mid-depth, while deeper layers (> 20 m) remain largely unaffected.
The developed numerical model, integrating terrain data with an advanced constitutive formulation, successfully reproduces this complex three-dimensional response.
The results emphasize that reliable seismic risk assessment of critical infrastructure in loess-covered regions must consider the amplifying effect of structural loads on mid-depth liquefaction, which is essential for safe and resilient design. Furthermore, the numerical workflow established in this study, which integrates high-fidelity terrain modeling with an advanced constitutive model, can inform the future revision of seismic design codes and risk assessment guidelines for critical infrastructure built in liquefaction-prone loess regions, thereby promoting safer and more resilient engineering practices.
References
-
H. Liu et al., “Characteristics of liquefaction-induced landslide-mudflow and building damage triggered by Jishishan earthquake in Zhongchuan Township,” (in Chinese), Mountain Research, Vol. 42, No. 4, pp. 546–556, 2024, https://doi.org/10.16089/j.cnki.1008-2786.000844
-
H. Ma, K. Ren, W. Ma, Y. Yang, C. Li, and R. Cai, “Post-dynamic behaviors of the saturated loess in the Zhongchuan slide triggered by the Jishishan M6.2 earthquake,” Natural Hazards, Vol. 121, No. 16, pp. 18879–18904, Jul. 2025, https://doi.org/10.1007/s11069-025-07542-3
-
L. M. Wang, S. Y. Xu, and P. Wang, “Characteristics and insights of large-scale loess liquefaction flow slide induced by the 2023 Jishishan M6.2 earthquake,” (in Chinese), Chinese Journal of Geotechnical Engineering, Vol. 46, No. 2, pp. 235–243, 2024.
-
G. Liu, J. Jia, and G. Zhang, “Characteristics, genesis of liquefaction-induced mudflows from the Gansu Jishishan earthquake and implications for seismic secondary disaster risk assessment in the Upper Yellow River basin,” (in Chinese), Northwestern Geology, Vol. 57, No. 2, pp. 220–229, 2024.
-
J. L. Pan et al., “A preliminary study on loess liquefaction and its secondary disaster risk assessment method: A case study of the Jishishan MS6.2 earthquake,” (in Chinese), Earthquake Engineering Journal, Vol. 46, No. 4, pp. 836–845, 2024, https://doi.org/10.20000/j.1000-0844.20240201001
-
S. Yu, S. Zhang, Z. Li, J. Luo, Y. Yang, and J. Ding, “Fault kinematics and slip distribution of the 2023 Mw 6.1 earthquake in Jishishan County (Gansu, China) based on InSAR observations,” Earth, Planets and Space, Vol. 77, No. 1, p. 138, Aug. 2025, https://doi.org/10.1186/s40623-025-02199-5
About this article

The authors have not disclosed any funding.
The datasets generated during and/or analyzed during the current study are available from the corresponding author on reasonable request.
The authors declare that they have no conflict of interest.
