Abstract
Dramatic failure of pile foundations caused by the soil liquefaction was founded and leading to many studies on the seismic behavior of pile. The failures were often accompanied with settlement, lateral displacement and tilting of superstructures. Therefore soil-structure interaction effects must be properly considered in the design of pile. Two centrifuge models were conducted by shaking table at an acceleration field of 80 g. The purpose of this study was to investigate the seismic response of piles attached with different tip mass and embedded in liquefied or non-liquefied deposits. From the results, it was found that the maximum bending moment of pile occurs at the depth of 4 m and 5 m for dry sand and saturated sand models, respectively. The more tip mass leads to the more permanent lateral displacement and the more residual bending moment.
1. Introduction
The advantages of using the pile foundation are less excavation, less surplus earth and saving time and money etc. The pile tip often drives to rock bed to ensure enough bearing capacity and to reduce the settlement. The pile foundation is usually adopted for nuclear power plant and there are many cases in the guidelines of JEAG 4616-2003 in Japan. For example, the Kashiwazaki-Kariwa nuclear power plant was damaged during earthquake by non-uniform ground settlement and soil liquefaction. Then, the pile foundation was adopted to improve the seismic behavior of the upper structure, but the efficiency is still hard to estimate accurately.
Several studies were performed to investigate the effect of pile foundation by centrifuge shaking table. The pile foundations were installed in liquefiable sand ground, improved sand ground and improved sand ground with pile cap (Abdoun et al., 2002 [1]). During the shaking, the sandy ground liquefied and the lateral spreading occurred. The pile foundation subjected to the inertia force of superstructure and cyclic earth pressure. It was found that the improved sand ground with pile cap was good to resist the soil liquefaction and to reduce the maximum pile bending moment. Bhattacharya (2003 [2]) found that the passive earth pressure loses around the pile during the soil liquefaction and leading to the bulking of pile. The failure types of pile were also investigated by Brandenberg et al. (2007 [3]), Ishihara et al. (1997 [4]) and Tokimats et al. (1998 [5]).
The past studies investigated the seismic behavior of single pile without pile cap and superstructure. In this study, the model pile was attached with a tip mass to simulate the pile behavior under the dry spent fuel storage during shaking. Two centrifuge shaking table tests were conducted to investigate the distribution of pile bending moment, pile head acceleration and the pile head displacement during shaking.
2. Test equipments and the materials
This study was undertaken in the Centrifuge Modeling Laboratory at National Central University (NCU). The NCU Geotechnical Centrifuge has a nominal radius of 3 m and equips a 1D servo-hydraulically controlled shaker. The shaker has maximum nominal shaking force 53.4 kN with maximum table displacement of ±6.4 mm and operates at up to 80 g centrifugal acceleration. The nominal operating frequency range is 0-250 Hz.
A laminar container with inside dimensions of 711 mm×356 mm×353 mm () is constructed from 38 light-weight aluminum alloy rings arranged in a stack. The laminar container is designed for dry and saturated soil models. The boundary effects of the laminar container used in the study is minimal; hence the container permits development of stresses and strains associated with one dimensional shear wave propagation (Lee et al. 2011 [6, 7]).
According to the scaling law of centrifuge modeling, the size of pile foundations is reduced to times of prototype, where the is 80 as corresponding to the artificial acceleration in this study. On the other hand, the stiffness of the model pile is times of that of the prototype pile. Therefore, the diameter of model pile is 12.5 mm and consists of hollow aluminum tube and an outside coating layer, to simulate the pile foundation of the nuclear storage cask with diameter of 1 m. As shown in Fig. 1, the strain gauges were attached on the surface of hollow aluminum tube, and there are eight Wheatstone full bridges with constant distance with each other to measure the histories of bending moment along the depth. After checking the Wheatstone full bridges, an epoxy resin was than coated outside the aluminum tube to protect the strain gauges and to ensure the waterproof of pile. In each test, two different of pile head masses were adopted for simulating the seismic responses of dry spent fuel storage with different weights. The masses of 4.73 kN and 0.67 kN were fixed on the pile heads of B-Pile and S-Pile to simulate the prototype weight of 2422 kN and 343 kN and the prototype moment inertia of pile head masses of 12175 kN-m2 and 1666 kN-m2, respectively. Two piles were installed in the center line of model container and the distance between two piles were far away enough (more than 20 times pile diameter) to prevent from any interaction between two piles during shaking.
Fig. 1Different model piles a) B-Pile and the pile head mass and b) S-Pile and the pile head mass
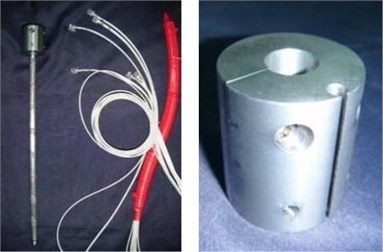
a)
b)
A kind of fine quartz sand with mean particle size of 0.19 mm was selected to avoid the particle effect for the centrifuge model. Its specific gravity is 2.65 with the maximum and the minimum dry unit weight of 16.6 kN/m3 and 13.8 kN/m3, respectively. According to the Unified Soil Classification System, the sand is classified to poorly graded sand (SP).
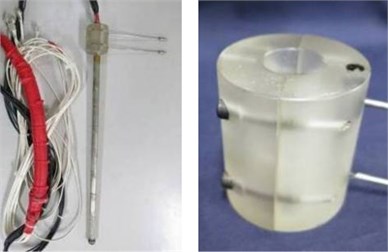
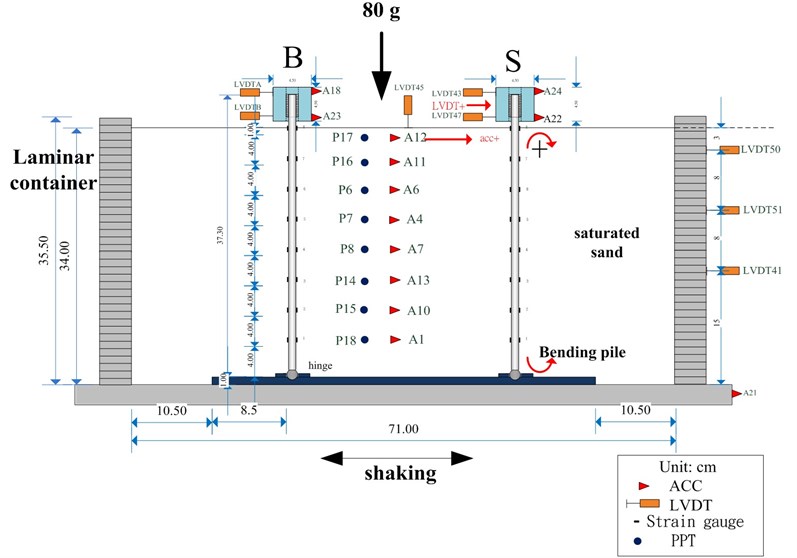
During the tests, the Wheatstone full bridges were monitoring the seismic response of pile bending moment. And there were two accelerometers attached at each pile head mass to measure the acceleration amplification history of pile. Two linear variable differential transformers (LVDT) were installed to the top and the bottom of each pile head mass to measure the displacement history. A LVDT was put at the center of ground surface to record the settlement of sand deposit. As shown in Fig. 2, seven accelerometers were installed in the dry sand deposit and one was fixed at the base of the model to record the propagation of shear wave. For the saturated model as shown in Fig. 3, an accelerometer array was embedded, and eight pore water pressure transducers were also embedded at the same elevation of accelerometer to measure the excess pore water pressure generation and dissipation. All the measurements in this paper are presented in prototype units unless specially noted otherwise.
Fig. 2The configuration of dry sand model
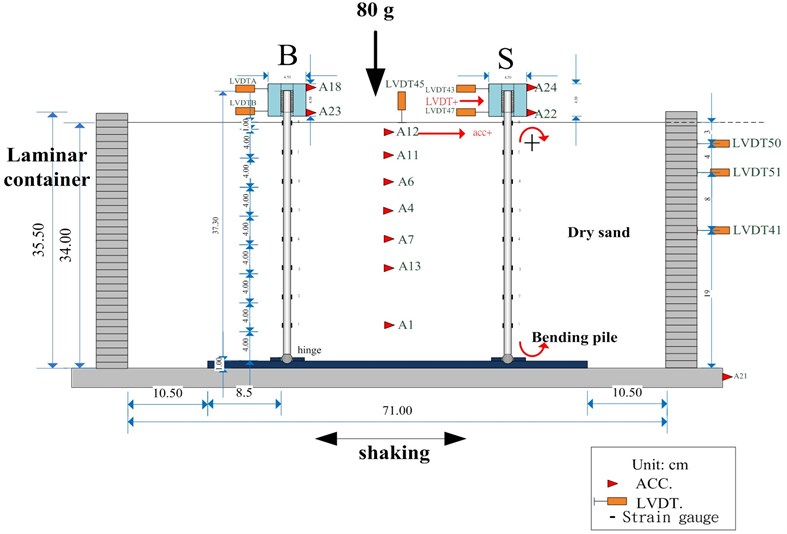
Fig. 3The configuration of the saturated sand model
3. Model preparation and test procedure
For preparing the model, two bending piles attached with different masses were first connected to the base of container with pin joints. The quartz sand was then pluviated with a regular path into the container with a constant falling height and at a constant flow rate. The dry sand ground and the saturated sand ground models were labeled as P-D-3 and P-W-4, respectively. For preparation of saturated sand bed, the air was then continuously vacuumed out from the inside of container and the de-air water was carefully dripped into the container at the same time to saturate the sand. After the preparation of models, the centrifuge was accelerated at a 10 g per step until it reached 80 g. Then, the shaker was invoked to excite the model with one-dimensional waves.
Each model was firstly subjected to one cycle pre-shaking for the in-flight subsurface exploration to determine the shear wave velocity profile along depths and the fundamental frequencies of both the sand deposit and the piles. Subsequently each model was subjected to several shaking events. In this paper, a seismic event, E3, with base input motion of about 0.15 g was selected in the tests P-D-3 and P-W-4 to simulate the seismic response of the piles embedded in the dry and the saturated sand deposits, respectively.
4. Fundamental frequency of the soil and piles
Fig. 4Fourier amplitude of the acceleration histories for P-D-3_E3
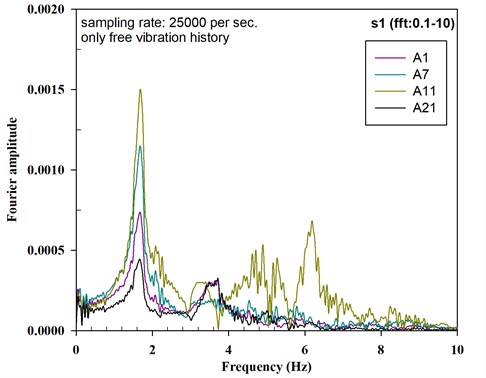
Fig. 5Fourier amplitude of acceleration histories for P-D-3_E3 a) S-Pile and b) B-Pile
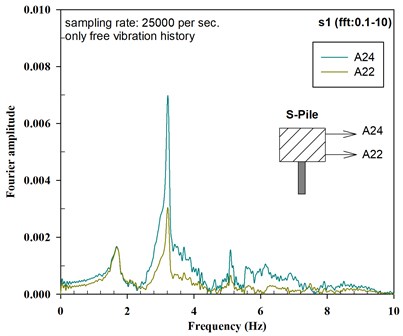
a)
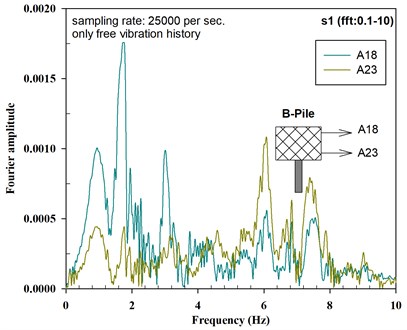
b)
A pre-shaking method was used to perform the subsurface exploration of shear wave velocity in a centrifuge model by Lee et al. (2012 [7]). The fundamental frequencies of soil deposit and pile foundations with different head mass were detected before the main shaking events. Fig. 4 shows the Fourier spectrum of the free vibration of input base acceleration history (labeled A21), and A11, A7 and A1 are the Fourier spectrum of the free vibration of acceleration histories at the bottom, medium and top soil layers, respectively, with corresponding to the elevations of 23.2 m, 13.6 m and 5 m under the ground surface. It can be seen that the fundamental frequency of a dry sand deposit with depth of 27.2 m is about 1.5 Hz.
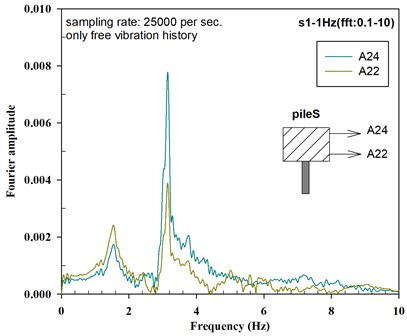
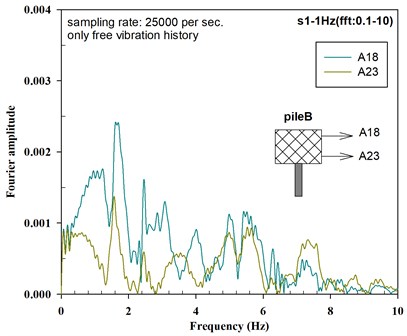
Fig. 5(a) and (b) show the Fourier spectrums of the free vibration of acceleration histories at the top and bottom of head mass for S-Pile (A24 and A22) and B-Pile (A18 and A23), respectively. It is found that the fundamental frequency of the dry sand deposit appears in the Fourier spectrum of piles, indicating the soil-pile foundation interaction. The fundamental frequency of S-Pile with light head mass is about 3.2 Hz and that of B-Pile with heavy head mass is about 1.0. On the other hand, Fig. 6, Fig. 7(a) and (b) are the Fourier spectrums of the saturated soil deposit, S-Pile and B-Pile, respectively. From the in-flight subsurface exploration, the fundamental frequency of the saturated sand deposit is about 1.7 Hz, and those of the B-Pile and S-Pile are also 1.0 Hz and 3.2 Hz, respectively. The fundamental frequencies of piles embedded either in dry deposit or in saturated sand deposit are almost the same.
Fig. 6Fourier amplitude of the acceleration histories for P-W-4_E3
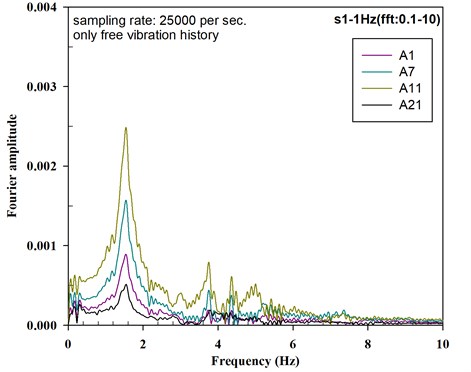
Fig. 7Fourier amplitude of acceleration histories for P-D-3_E3 a) S-Pile and b) B-Pile
a)
b)
5. Time histories of pile head acceleration and displacement
The figures shown in Fig. 8 and Fig. 9 are the measured horizontal acceleration histories of pile head masses on the B-Pile and S-pile for the seismic events of P-D-3_E3 and P-W-4_E3, respectively. It can be seen that the magnitude of horizontal accelerations on the pile head mass of P-D-3_E3 are much larger than those of P-W-4_E3. This finding is consistent with the acceleration amplification factors along the depths of sand deposit for seismic events of P-D-3_E3 and P-W-4_E3. There is considerable amplification of acceleration on the ground surface related to the shear wave propagation from the base to the ground surface in the dry sand deposit.
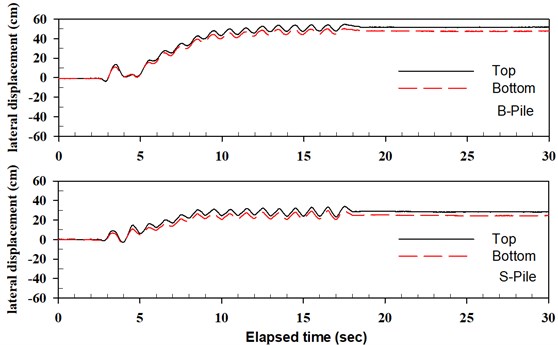
On the other hand, it can be seen in B-Pile that the acceleration at the pile head mass is 4 times larger than that at the bottom of pile mass, leading to the rocking of pile head. For the S-Pile, the acceleration histories at the top and bottom of pile head mass are almost the same, demonstrating the cyclic horizontal movement of pile head. From the aspect of acceleration response, the soil liquefaction in P-W-4_E3 prevents the shear wave propagation from the soil to the pile. The shear wave only passes from the pile tip and through the pile shaft to the top. Therefore, the pile head mass subjects to a less seismic load which would benefit the superstructure. Fig. 10 and Fig. 11 shows the time histories of lateral displacement of pile head mass for P-D-3_E3 and P-W-4_E3, respectively. The piles embedded in the saturated sand deposit and attached with the larger mass suffers the larger permenent horizontal displacement. Consequently, it should pay attention to the rocking of pile head in dry sand deposit and to the large movement of pile head in liquefiable sand deposit during earthquake.
Fig. 8Time histories of pile head acceleration for seismic event of P-D-3_E3
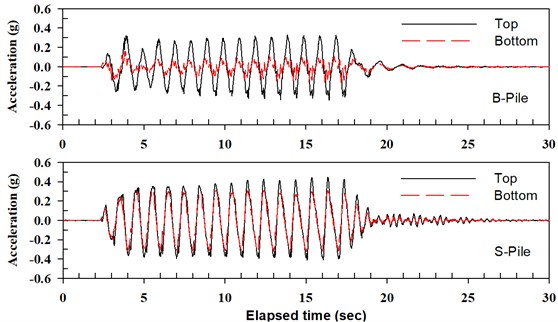
Fig. 9Time histories of pile head acceleration for seismic event of P-W-4_E3
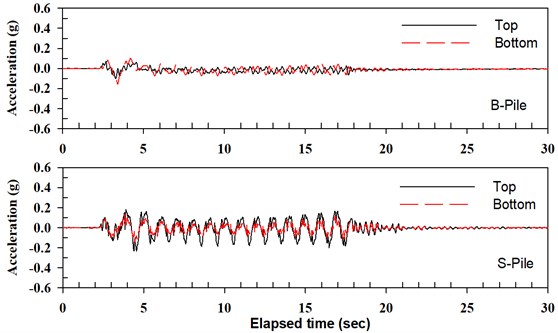
Fig. 10Time histories of pile head displacement for seismic event of P-D-3_E3
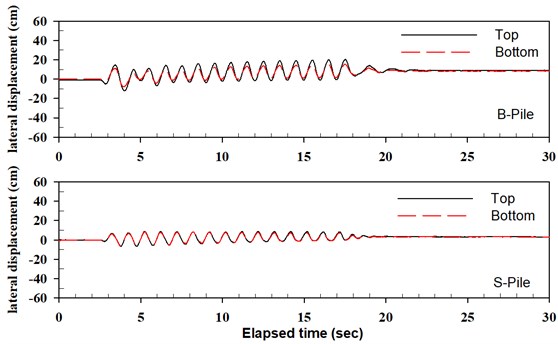
Fig. 11Time histories of pile head displacement for seismic event of P-W-4_E3
6. Time histories of pile bending moment
Fig. 12 and Fig. 13 show the time histories of the measured bending moments tip for B-Pile and S-Pile at the seismic events of P-D-3_E3 and P-W-4_E3. In the test of P-D-3_E3, only the top part of pile within 7.2 m below the ground surface experienced significant bending moments for the B-Pile and S-Pile. The B-Pile experienced nearly the same peak values of bending moment during the 15 cycles force vibration. The S-Pile behaved the similar response but having the smaller bending moment distributions due to the smaller inertial force during shaking. The piles below the depth of 7.2 m were confined by the surrounding soil and almost no bending moment was measured.
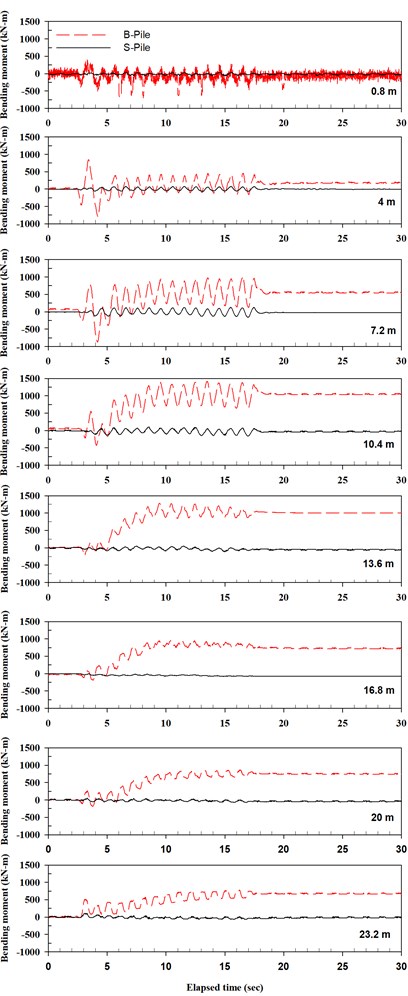
In the test of P-W-4_E3, the soil liquefied and the bending moment of B-Pile propagated from the top to the tip of pile. And the profile of bending moment reveals a residual bending moment at the end of shaking, resulting in the large permanent lateral movement of pile head. It is quite different from that obtained from the result of event P-D-3_E3 and the larger horizontal pile displacements are expected. In addition, it was shown in Fig. 12 that the B-Pile embedded in the dry sand deposit experienced much higher bending moment than that embedded in the saturated sand deposit (as shown in Fig. 13), as a result of the higher acceleration on the head mass for the pile in the dry sand deposit. For the S-Pile, the bending moment distributions were almost the same in the events of P-D-3_E3 and P-W-4_E3 because of the smaller inertial force of pile head mass.
Fig. 12Time histories of pile bending moment for P-D-3_E3
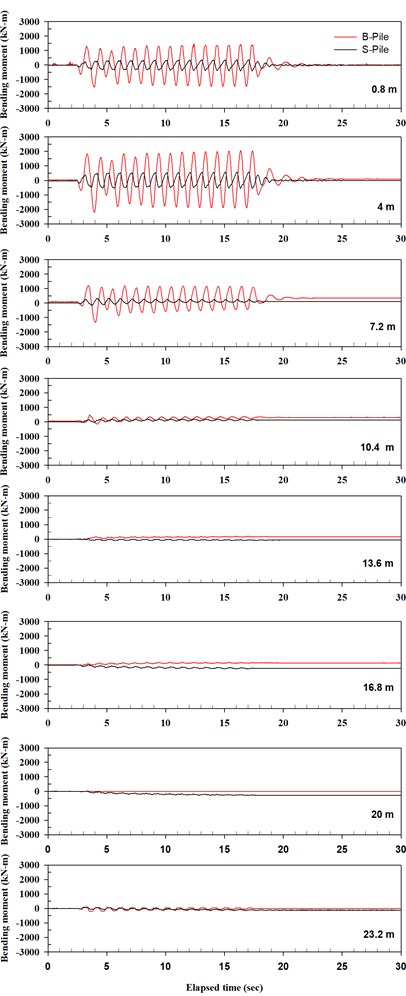
Fig. 13Time histories of pile bending moment for P-W-4_E3
7. Conclusions
The test results show that the pile attached with different head masses has different fundamental frequency. The magnitude of horizontal acceleration at the pile head mass of P-D-3 (dry deposit) was much larger than those measured in the seismic event of P-W-4 (liquefiable deposit). Only the top part of pile within 7.2 m below the ground surface experienced large bending moments for the pile embedded in dry sand. For the liquefiable deposit, the pile head attached with a larger mass leads to a large lateral movement of pile head and large residual bending moments along the depth of whole pile during and after shaking.
References
-
Abdoun T., Dobry R. Evaluation of pile foundation response to lateral spreading. Soil Dynamics and Earthquake Engineering, Vol. 22, 2002, p. 1051-1058.
-
Bhattacharya S. Pile instability during earthquake liquefaction. Ph.D Dissertation, University of Cambridge, Cambridge, UK, 2003.
-
Brandenbergy S. J., Boulanger R. W., Kutter B. L. Static pushover analyses of pile groups in liquefied and laterally spreading ground in centrifuge tests. Geotechnical and Geoenvironmental Engineering, Vol. 133, Issue 9, 2007, p. 1055-1066.
-
Ishihara K. Terzaghi oration: geotechnical aspects of the 1995 Kobe earthquake. Proceedings of 14th International Conference on Soil Mechanics and Foundation Engineering, Hamburg, Germany, 1997, p. 2047-2073.
-
Tokimatsu K., Asaka Y. Effects of liquefaction-induced ground displacement on pile performance in the 1995 Hyogoken-Nambu earthquake. Soils and Foundations, Special Issue 2, 1998, p. 163-177.
-
Lee C. J., Wei Y. C., Kuo Y. C. Boundary effects of a laminar container in centrifuge shaking table tests. Soil Dynamics and Earthquake Engineering, Vol. 34, Issue 1, 2012, p. 37-51.
-
Lee C. J., Wang C. R., Wei Y. C., Hung W. Y. Evolution of the shear wave velocity during shaking modeled in centrifuge shaking table tests. Bulletin of Earthquake Engineering, Vol. 10, Issue 2, 2012, p. 401-420.
About this article

The authors would like to express their gratitude for the financial and technical supports from the Institute of Nuclear Energy Research (INER), Atomic Energy Council (NL1020467 and NL1020463), the National Science Council (NSC 101-2221-E-492-027, NSC 102-2221-E-492029), and the National Center for Research on Earthquake Engineering (NCREE). These supports make this study and the future researches possible.
