Abstract
In compressor working, unsteady aerodynamic load induced by the interaction of stator-rotor blade rows is the main vibration source of blade high cycle fatigue. It has a direct influence on fatigue strength of compressor blades. Further research on unsteady aerodynamic load has very important significance for improving the service life and reliability of compressor blades. Based on an aero-engine compressor rotor system, three-dimensional flow field model of former stator and downstream rotor is established. With the method of numerical simulation, compressor flow characteristics are solved at different moments. Then the paper analyzes the process of stator-rotor interaction and the distribution law of rotor blade aerodynamic load. In addition, the effects on rotor blade aerodynamic load are discussed at different pressure ratios, rotational speeds and ratios of stator-rotor blade number. The results show unsteady flow field area with lower speed is induced by stator-rotor interaction at rotor blade leading edge. When the overlap space between stator and rotor channels is the maximum, mass flow and static pressure around rotor blade will appear jumping fluctuations. Unsteady aerodynamic load fluctuates periodically, and dominant frequencies are manly at frequency doubling of stator-rotor interaction, especially at one time frequency (). In the interaction period , variations of aerodynamic load on pressure and suction surfaces take the contrary trend, magnitude and pulsation amplitude on pressure surface are far greater than that on suction surface. Effects of pressure ratio on pressure and suction surfaces are consistent, and the magnitude of aerodynamic load increases with pressure ratio. Rotational speed and stator-rotor blade number ratio affect the magnitude of aerodynamic load on suction surface more heavily than that on pressure surface. With the increasing of rotational speed, unsteady characteristics of aerodynamic load are enhanced. Besides, pulsation amplitude and peak value of unsteady aerodynamic load reach the maximum when stator-rotor blade number ratio . This research provides the theoretical basis for dynamics design of aero-engine compressor rotor system
1. Introduction
Aero-engine is increasingly to face the trend of higher load, efficiency and reliability, which requires compressor aerodynamic characteristics must be deeply taken into consideration. Stator-rotor interaction between blade rows is the inherent characteristic of compressor aerodynamic, it affects compressor working performance heavily and has become one of key problems in an aero-engine aerodynamic and structural design.
Due to the interaction of stator-rotor blade rows, internal flow field is unsteady and complex in compressor working, which not only affects compressor working performance, but also makes compressor blades bear unsteady aerodynamic load. It is the main vibration source of high cycle fatigue, and has a direct influence on compressor blade fatigue strength. Therefore, further research on unsteady aerodynamic load induced by stator-rotor interaction has very important significance for improving the service life and reliability of compressor blades.
Research on stator-rotor interaction between blade rows can be traced back to 1977 Erdos’ work [1], he took advantage of theoretical analysis method to calculate the transonic unsteady flow field. Then Gundy-Burlet [2], He [3] and Arnone [4] et al. applied the different schemes to solve the unsteady disturbances of 2D and 3D flow field. With the development of research, more and more scholars begin to pay attention to the unsteady disturbances induced by stator-rotor interaction [5]. The update of test instrument and method makes the experiment possible to investigate stator-rotor interaction. Sentker and Riess [6] installed and operated a flow measuring system based on split-film probes to study the wake-blade interaction in axial compressor. Gorrell and Okiishi et al. [7] performed a test on the U.S. Air Force’s Stage Matching Investigation rig to discuss the effect of blade-row spacing on stator-rotor interaction. Shuang and Shaowen et al. [8] developed the experiment in a low-speed cascade wind tunnel to explore the effect of suction boundary layer on aerodynamic performance.
In recent years, computational fluid dynamics and computer hardware performance have achieved rapid development. Researchers can take numerical simulation method to investigate the complex flow inside compressor. Compared with experimental study, numerical method can not only obtain very rich details of unsteady flow field, but also can easily develop various ideal numerical experiments. Moreover, numerical simulation can be carried out in a relative broad range of parameters. Hence, it can save the research costs, shorten the research period, and also can explore and discover new physical phenomena to further promote the development of experiment and theoretical basis [11, 12]. Kulisa [13] and ZHAO [14] et al. adopted the numerical method to simulate the change process of passing wakes induced by stator-rotor interaction. Gnesin [15] and Mingming [16] et al. respectively researched the effects of oscillating and curved blades on compressor unsteady flow field. Beheshti [17] and Lu [18] et al. considered the influence of tip clearance and leakage flow on aerodynamic stability. Then Mischo [19], Houghton [20] and Kim [21] et al. found recess blade tips and casing grooves could improve compressor performance and stability.
Summarizing the related researches, most scholars focus on the analysis of compressor internal unsteady flow field, but few scholars concentrate on the effects of stator-rotor interaction on compressor rotor blade aerodynamic load. In this paper, unsteady 3D rotating flow field of an aero-engine compressor is simulated with the numerical method. Then it analyzes the process of stator-rotor interaction and the distribution law of rotor blade aerodynamic load. In addition, the effects on rotor blade aerodynamic load are discussed at different pressure ratios, rotational speeds and ratios of stator-rotor blade number.
2. Research object and method
2.1. Control equations
Compressor internal fluid movement belongs to highly non-linearly, complex 3D viscous turbulent motion [22, 23]. It needs to satisfy the basic conservation laws, including the law of mass conservation (continuity equation), the law of momentum conservation (momentum equation or N-S equation) and the law of energy conservation (energy equation). Continuity equation describes the nature of fluid mass conservation in flow process. Continuity equation is expressed as:
Momentum equation describes the nature of fluid momentum conservation in flow process, it is Newton’s second law expression which is analysis of tiny control body force and movement. Momentum equation is expressed as:
Energy equation:
In formulas, components of velocity vector in , , direction are respectively , , (m/s), is the fluid density, is the coefficient of fluid dynamic viscosity (Pa.s), is the gas pressure, , and are the general source terms in the momentum conservation equation, is the thermodynamic temperature (K), is the specific heat capacity (J/(kg.K)), is the fluid heat transfer coefficient (W/(m2.K)). Here is the viscous dissipation item, and it represents the fluid inner heat source and heat energy part converted from mechanical energy due to the viscous effect.
Above Eq. (1)-(3) have the seven unknown variables, they are , , , , , and Reynolds stress. In order to make the basic equations closed for solving, there is also a need for the additional gas state equation and turbulence model.
For the ideal gas state equation:
where is the molar gas constant.
This paper chooses standard - turbulence model [24, 25], and Reynolds stress is expressed as a function of turbulent viscosity coefficient . According to Boussinessq hypothesis, turbulence viscosity coefficient is defined with the turbulent pulsating kinetic energy and turbulent energy dissipation rate .
equation:
equation:
where is the turbulent energy, is the turbulent dissipation rate, is the turbulence viscosity coefficient, . 1.44, 1.92, 0.09, 1.0, 1.3, they are the constants.
In the researched compressor, the axial velocity is subsonic. It is assumed that flow parameters are unchanged along the circumferential direction. At the inlet boundary, initial values for total pressure and total temperature are given, while at the outlet boundary the static pressure is imposed. Based on the isentropic relation, system boundary conditions can be represented in the following form.
Before stator:
Behind rotor:
where is the sound velocity, and are the total pressure and the total temperature, and are the flow angles in the circumferential and meridional directions respectively, is the ratio of the fluid specific heats, is the compressor rotational angular velocity.
No-slip boundary and adiabatic wall boundary are set, here gradients of wall temperature and pressure are zero. That is:
where denotes the direction of wall external normal line.
To obtain the system initial condition, steady flow field is calculated. Based on the result of steady analysis, the research initiates the unsteady flow field analysis. This can improve the convergence speed of calculation.
2.2. Physical model and boundary conditions
This research takes 3D flow field of former stator and downstream rotor as the research object, numbers of stator and rotor blades are equal to 38. Single-sector flow channel is selected as the calculation domain, and it is divided into two parts: stator and rotor. Structured hexahedral grid is generated with the professional preprocessing tool of commercial CFD software. In order to verify that the grid is independent, three kinds of grids have been generated at different densities, element numbers are respectively 106758, 158346 and 210415. After calculation mass flow and isentropic efficiency are obtained, as shown in Table 1.
Table 1Mass flow and isentropic efficiency in three kinds of grids
Element number | Mass flow / kg·s-1 | Isentropic efficiency / % |
106758 | 0.4962 | 83.20 |
158346 | 0.4948 | 83.56 |
210415 | 0.4957 | 83.34 |
Table 1 exhibits that mass flow and isentropic efficiency change very little with the increasing of element number. Variation in mass flow is less than 0.3 %, and variation in isentropic efficiency is less than 0.5 %. Furthermore, contours of parameters are basically the same in the stream surface. Hence, it can draw a conclusion that the simulation result and grid are independent.
To improve the efficiency of calculation, element number of 106578 is adopted in the research. Here rotor element number is 31046, and stator element number is 75712. After checking, it shows grid aspect ratio is less than 5, orthogonality is greater than 10, and extension ratio is less than 1000. So there confirms the quality of grid is good, specific models are shown in Fig. 1.
Fig. 1Models of computation
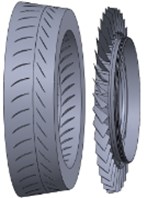
a) Structure of flow field

b) Mesh of stator-rotor flow field
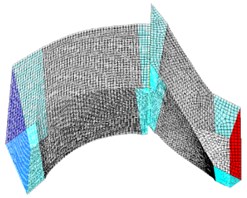
c) Single-sector flow channel
Compressor operating rotational speed is 11383 rpm, boundary type of inlet total pressure and outlet static pressure is adopted. Solid wall is no-slip and adiabatic, and medium is compressible ideal air. Inlet total pressure is 1.0 atm, inlet temperature is 300 K, and outlet static pressure is 1.08 atm, outlet temperature is 300 K. Axial length of rotor blade rows is 0.03731 m, blade pitch is 0.04369 m, as shown in Fig. 2.
Fig. 2Boundary condition of compressor flow field
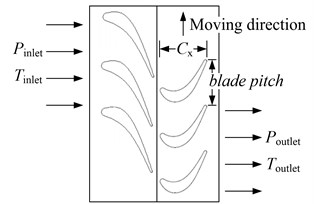
a) 2D boundary of blade-disc flow field
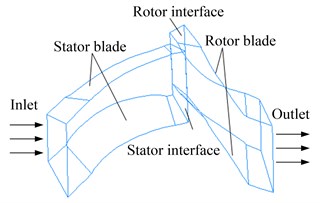
b) 3D flow channel of the single sector
For further analysis, five measuring points are set near the blade tip at 90 % , where is rotor blade height. And they are marked with 1, 2, 3, 4 and 5, as shown in Fig. 3(a). Besides, five sections are set in the rotor domain and marked with S1, S2, S3, S4 and S5. They are respectively located at stator-rotor interface, blade leading edge, blade central edge, blade trailing edge and rotor outlet, as shown in Fig. 3(b).
Fig. 3Layout of measuring points and sections
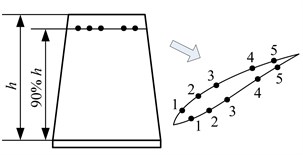
a) Measuring points near rotor blade tip
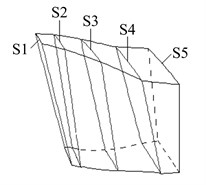
b) Measuring sections in rotor domain
3. Numerical results and discussions
Compressor stator-rotor interface is processed with sliding mesh. Firstly, implicit coupled method is set to solve steady analysis for 500 steps. Then taking the obtained steady flow as the initial field, unsteady analysis is initiated. Considering rotational speed and time consuming of unsteady calculation, physical time step is set for 60, and it is 2.31×10⁻⁶ s. Here is stator-rotor interaction period. Virtual iteration number is set for 20, total calculation iteration number is set for 2280.
In the simulation process, residuals and coefficients of moment, drag and lift are monitored, as shown in Fig. 4.
Fig. 4 shows the convergence curves of monitoring parameters, as can be found monitoring curves begin to fluctuate periodically after 0.003 s (about 20 times of interaction period ), the calculation has been convergent. This periodic fluctuation is induced by stator-rotor interaction. Except for using the monitoring value of characteristic parameters, the deviation of mass flow between inlet and outlet is also taken as an important evaluating criterion of calculation convergence. Table 2 shows the value and deviation of mass flow at inlet and outlet.
Fig. 4Convergence curves of monitoring parameters
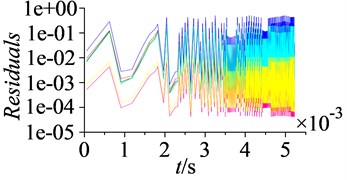
a) Residuals
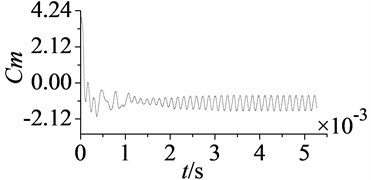
b) Moment coefficient
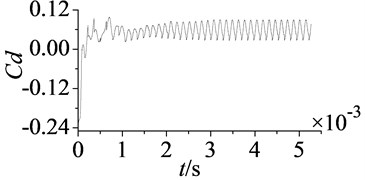
c) Drag coefficient
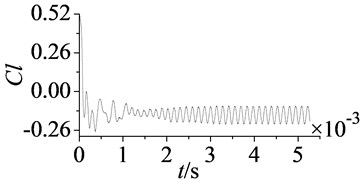
d) Lift coefficient
As shown in Table 2, the deviation of mass flow between inlet and outlet is 0.0023 kg·s-1. And mass flow of inlet is nearly equal to mass flow of outlet, which further illustrates the calculation has been convergent.
Table 2Value and deviation of mass flow at inlet and outlet
Inlet mass flow / (kg·s-1) | Outlet mass flow / (kg·s-1) | Deviation / (kg·s-1) |
0.4973 | 0.4950 | 0.0023 |
3.1. Unsteady disturbance of flow field induced by stator-rotor interaction
After computing 20 times of interaction period , the curves of residuals and coefficients of moment, drag and lift fluctuate periodically well. In the same time mass flow of inlet and outlet is conservative, which indicates numbercial simulation has been convergent. Then speed contour maps of the steady and unsteady flow are extracted, as shown in Fig. 5.
As can be found from the speed contour maps in Fig. 5, each flow channel will produce a wake when airflow moves from former stator into downstream rotor. This wake extends from stator blade trailing edge to rotor blade leading edge. Speed contour map of steady flow field shows the wake morphological characteristic in natural flow. After applying rotational speed, former stator wakes are swept periodically by rotor blades. It takes heavy unsteady disturbance to rotor flow field, and lower speed area is generated at rotor blade leading edge. Unsteady flow field is the result of stator-rotor interaction. Crashes between former stator wakes and rotor blades cause the energy loss, airflow is stranded at rotor blade leading edge, and lower speed area is formed.
In Fig. 6 are amplitude-frequency curves of measuring points. According to the experience, aerodynamic load changes more obviously near rotor blade tip, so measuring points are set in there. M1-M5 and N1-N5 represent the measuring points from blade leading edge to trailing edge on pressure and suction surfaces respectively. is the dimensionless dynamic pressure. Number of rotor blades is 38, hence at the working speed of 11383 rpm stator-rotor interaction frequency () is approximately 7200 Hz.
Fig. 5Speed contour maps of steady and unsteady flow
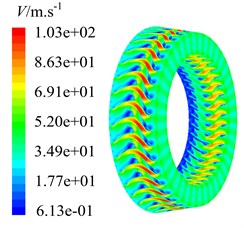
a) Steady flow
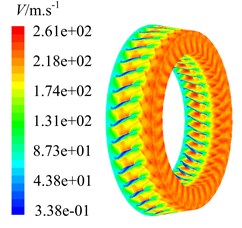
b) Unsteady flow
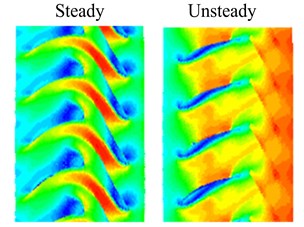
c) Wakes contrast
Fig. 6Amplitude-frequency curves of measuring points
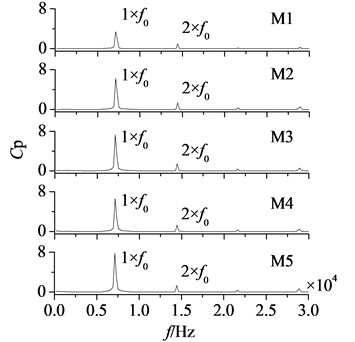
a) Pressure surface
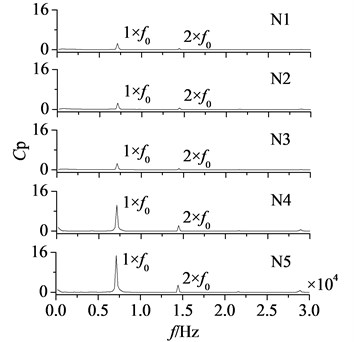
b) Suction surface
Fig. 6 shows dominant fluctuation frequencies of aerodynamic load are manly at frequency doubling of stator-rotor interaction, especially at one time frequency (1×). It illustrates stator-rotor interaction has a direct influence on aerodynamic load. Peaks of dynamic pressure on pressure surface are all at a relatively high value, while on suction surface the high values are only at N4 and N5. The airflow goes through rotor blade trailing edge, and flow separation occurs. Coupled with the effect of wakes, dynamic pressure increases heavily. Hence, the amplitudes of pressure and suction surfaces are both maximum at blade trailing edge.
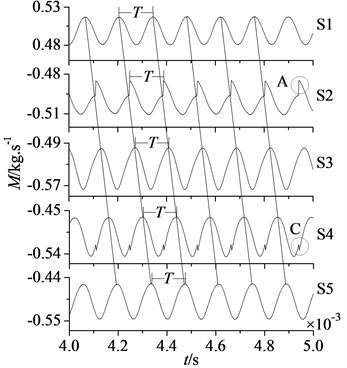
In Fig. 7 are mass flow and static pressure curves of the section S1, S2, S3, S4 and S5 at 0.004 s-0.005 s.
Fig. 7 shows that rotor flow field has been stable and convergent. Mass flow and static pressure in each section fluctuate periodically in sine or cosine law, the pulsation period is equal to stator-rotor interaction period . It illustrates the disturbance of stator-rotor interaction plays a major role in unsteady flow of compressor rotor.
Comparing mass flow and static pressure in each section, it shows curves of mass flow and static pressure in section S1-S5 move backwards in order with time consuming, which reflects the process that airflow goes through each section along the axial direction. Meanwhile noted that in section S1, S3, S4 and S5 static pressure is the minimum, when mass flow is the maximum. It corresponds with the flow rule that pressure is lower and mass flow is greater. But the flow rule is aberrant in section S2, static pressure is the maximum when mass flow is the maximum. It is because section S2 is located at the rotor blade leading edge, when former stator wakes are in crash with rotor blades, part of airflow is stranded at the rotor blade leading edge. With the increasing of stranded airflow, static pressure will increase. So in section S2 mass flow is the maximum, and static pressure is the maximum too.
In addition, from the positions of A, B, C and D in Fig. 7, it can be found mass flow curves in section S2 and S4 as well as static pressure curves in section S2 and S3 appear once jumping fluctuation in each period .
Fig. 7Mass flow and static pressure curves of measuring sections
a) Mass flow curves
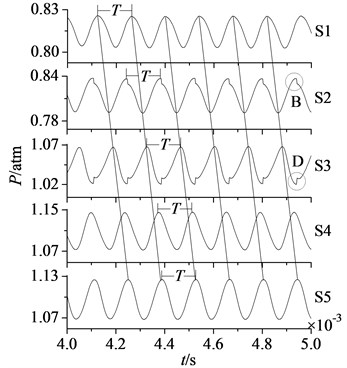
b) Static pressure curves
Fig. 8Curves of mass flow and static pressure in stator-rotor interaction period T
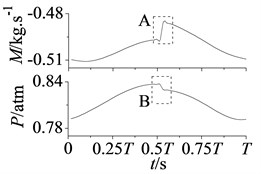
a) Section S2
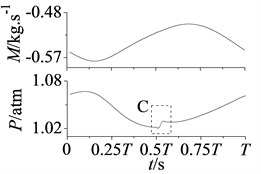
b) Section S3
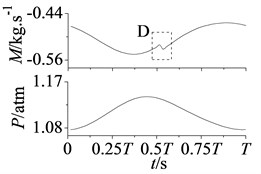
c) Section S4
In Fig. 8 are mass flow and static pressure curves of section S2, S3 and S4 in stator-rotor interaction period , jumping fluctuations are shown in position A, B, C and D at approximately 2. This phenomenon particularly appears at blade leading edge, as shown in A and B of Fig. 8(a). In addition, noted that pressure of section S3 and mass flow of section S4 are also affected and occur small amplitude fluctuations.
The jumping fluctuations are because that overlap space between stator and rotor channels is the maximum at approximately 2, the increasing airflow makes attack angle of rotor blade changes largely. Flow intake angle varies with the blade attack angle, so flow field around rotor blade changes suddenly. Section S2, S3 and S4 are all through rotor blade, hence static pressure and mass flow appear the jumping fluctuations. Besides, section S2 is at the blade leading edge, and coming flow affects it first, so jumping fluctuations are more obvious.
3.2. Unsteady aerodynamic load distribution of rotor blade surface
After preliminary analysis of rotor flow field, finding that unsteady aerodynamic load induced by stator-rotor interaction is periodic [26, 27], it can be regarded as the composition of harmonic excitations. Transformation with Fourier series:
where is the fundamental frequency of periodic excitation, is the constant of excitation force, and are respectively amplitude and initial phase of the -order harmonic. Expressed as follows:
Above aerodynamic excitation force can be further expressed as:
where is the amplitude of steady force on blade surface, is the first harmonic excitation force, is the second harmonic excitation force, is the -order harmonic excitation force. Typically, the frequency of -order harmonic excitation force is times of fundamental frequency .
Amplitude of the first harmonic excitation force is far greater than amplitude of other orders. Excitation force amplitude decreases with the increasing of excitation order. So aerodynamic excitation force induced by stator-rotor interaction can be simplified as the sine excitation force:
where is the fluctuation amplitude, is the initial phase.
Rotor blades bear times unsteady disturbances induced by stator-rotor interaction in each rotor revolution ( is the number of rotor blades, where 38). The fundamental frequency of aerodynamic excitation force can be expressed as:
where is the rotational speed r/min.
In addition, aerodynamic excitation force also can be achieved by the integral of blade surface pressure at one moment. That is:
where represents the vector integral along blade surface, is aerodynamic pressure distribution at the moment of . The surface of rotor blade is constant, hence the variation of aerodynamic excitation force can be reflected by the pressure variation on rotor blade.
In order to further study the variation of aerodynamic load, aerodynamic pressure on suction and pressure surfaces is monitored. In Fig. 9 are the variation curves of aerodynamic load on rotor blade.
As shown in Fig. 9, when compressor flow field reaches the steady state, aerodynamic load on pressure and suction surfaces is convergent. In Fig. 9(a) are the time domain curves of aerodynamic load on pressure and suction surfaces. It is shown after 0.003 s curves begin to fluctuate periodically in sine or cosine law. Hence, aerodynamic load is the unsteady pulsation pressure. What’s more, the convergent value of aerodynamic load on pressure surface (1.09 atm) is far greater than the convergent value on suction surface (0.86 atm). And the pulsation amplitude of aerodynamic load on pressure surface is obviously higher than the pulsation amplitude on suction surface.
Fig. 9Variation curves of aerodynamic load on rotor blade
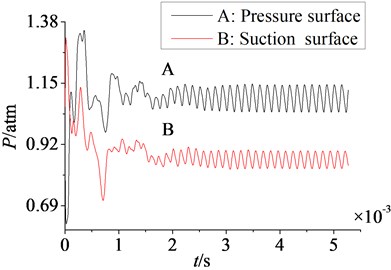
a) Time domain curves
b) Amplitude-frequency curves
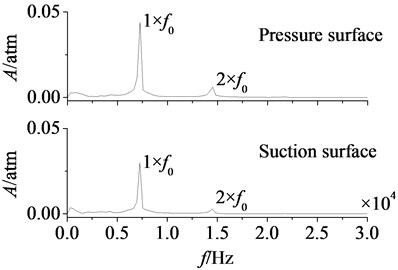
In Fig. 9(b) are the amplitude-frequency curves of aerodynamic load on pressure and suction surfaces. As can be found that peak frequencies of pressure and suction surfaces are consistent, and both are frequency doubling of stator-rotor interaction. Moreover, one time frequency (1×) component takes a dominant position, the amplitudes of double frequency (2×) and higher order frequency are smaller. Hence, aerodynamic load on rotor blade is mainly affected by the stator-rotor interaction. Furthermore, peak value of aerodynamic load on pressure surface is greater than that on suction surface, it illustrates unsteady flow on pressure surface is even stronger.
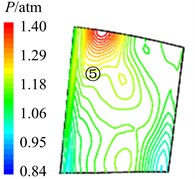
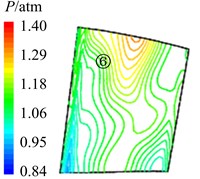
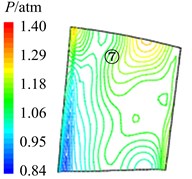
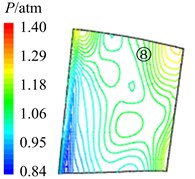
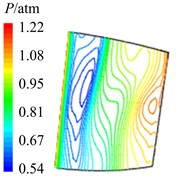
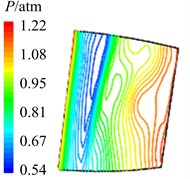
According to above analysis, the distribution of aerodynamic pressure on rotor blade has been basically mastered. In order to obtain the distribution details further, it exhibits variation curves and contour maps of aerodynamic pressure on rotor pressure and suction surfaces at period , as shown in Fig. 10-Fig. 12.
Fig. 10Variation curves of rotor blade aerodynamic pressure at period
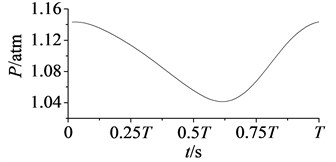
a) Pressure surface
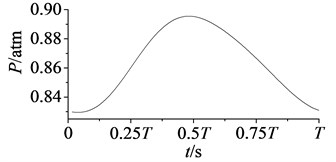
b) Suction surface
In Fig. 10, aerodynamic pressure on pressure surface reaches the minimal value at 58, and reaches the maximum value at . While on suction surface aerodynamic pressure reaches the maximum value at 2, and reaches the minimal value at . Except the moments of extreme points have a little different, aerodynamic pressure variations on pressure and suction surfaces take the contrary trend. Specific details as shown in Fig. 11-Fig. 12.
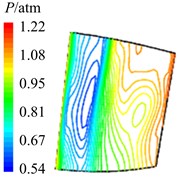
In Fig. 11 are the contour maps of aerodynamic pressure on rotor blade pressure surface. It is shown that aerodynamic pressure decreases gradually from 8 to 2, and reaches the minimal value at 58. Then aerodynamic pressure begins to rise, and reaches the maximum value at approximately . This is consistent with the variation of aerodynamic pressure in Fig. 10(a). In the interaction period , pressure vortexes which are aroused at the leading edge move from the bottom of pressure surface to the top (①, ②, ③, ④ position). When arriving at the top of pressure surface, contour gradient is the greatest, and aerodynamic pressure reaches the maximum. Then pressure vortexes continue to move from leading edge to trailing edge (⑤, ⑥, ⑦, ⑧ position). Finally, pressure vortexes move off rotor blade to the outlet domain. Contour gradient becomes smooth, and aerodynamic pressure reaches the minimum value. It illustrates that variation processes of pressure vortexes and aerodynamic load are consistent.
Fig. 11Aerodynamic pressure contour maps of rotor blade pressure surface
a)8
b)4
c) 38
d)2
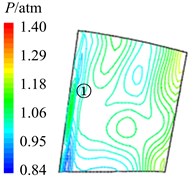
e) 58
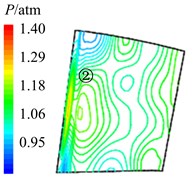
f) 34
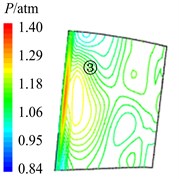
g) 78
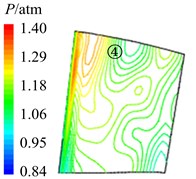
h)
Fig. 12Aerodynamic pressure contour maps of rotor blade suction surface
a)8
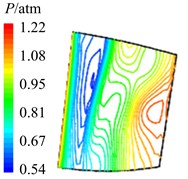
b)4
c) 38
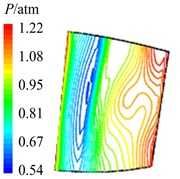
d)2

e) 58
f) 34
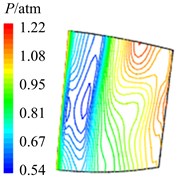
g) 78
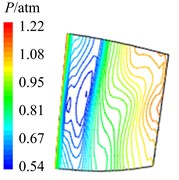
h)
In Fig. 12 are the contour maps of aerodynamic pressure on rotor blade suction surface. Compared with pressure surface, aerodynamic pressure on suction surface is clear different. Low pressure areas are found at the leading edge of suction surface in the whole period . It is the result of crash between coming flow and suction surface leading edge, which counteracts part of aerodynamic force. At the central and trailing edge, the gradient of aerodynamic pressure changes obviously. Aerodynamic pressure increases gradually from 8 to 2, and reaches the maximum value at 2. Then aerodynamic pressure begins to decreases, and reaches the minimal value at approximately . Similarly it is consistent with the variation of aerodynamic pressure in Fig. 10(b). In addition, there are also the transmission and dissipation of pressure vortexes on suction surface. But pressure vortexes mainly focus at the central and trailing edge. Compared with pressure surface, the strength of pressure vortexes on suction surface is a bit weaker.
3.3. Effects of different pressure ratios, rotational speeds and ratios of stator-rotor blade number on rotor blade aerodynamic load
As the basic parameters of compressor, pressure ratio (), rotational speed () and ratio of stator-rotor blade number () take an important influence on stator-rotor interaction. Assuming rotor geometry parameters (including rotor blade number) are unchanged, the pressure ratio, rotational speed and ratio of stator-rotor blade number are adjusted to discuss the effects on rotor blade aerodynamic load.
3.3.1. Pressure ratio
Keeping the rotational speed and inlet pressure unchanged, outlet pressure is respectively adjusted to the value of 1.05 atm, 1.08 atm and 1.10 atm, and different pressure ratios are obtained (where , 1.00 atm). Then the distribution of aerodynamic load on rotor blade is discussed at different pressure ratios, as shown in Fig. 13-Fig. 14.
Fig. 13Time domain curves of rotor blade aerodynamic load at different pressure ratios
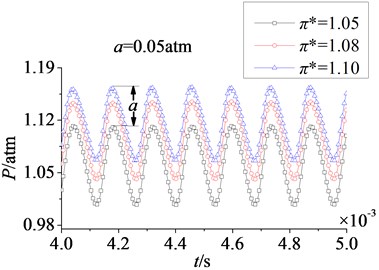
a) Pressure surface
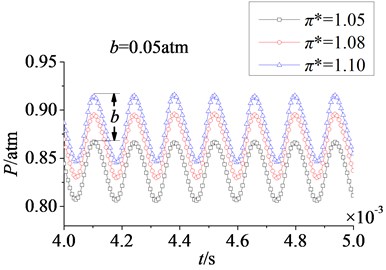
b) Suction surface
Fig. 14Amplitude-frequency curves of rotor blade aerodynamic load at different pressure ratios
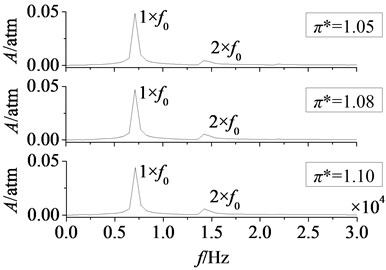
a) Pressure surface
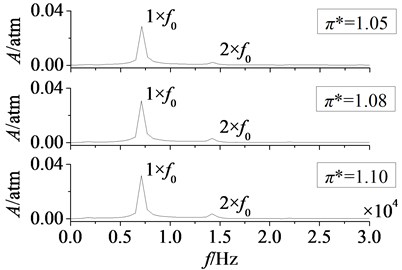
b) Suction surface
In Fig. 13 are time domain curves of rotor blade aerodynamic load at different pressure ratios. Here and respectively refer to the magnitude variations of aerodynamic load on pressure and suction surfaces. It can be found that the effect laws of pressure ratio are consistent on pressure and suction surfaces. With the increasing of pressure ratio, aerodynamic load increases gradually. In addition, when pressure ratio is adjusted from 1.05 to 1.10, the increasing magnitude of aerodynamic load on pressure surface is equal to that on suction, 0.05 atm. And the pulsation amplitude is nearly no change, it illustrates that the effect of pressure ratio on pressure surface is identical to the effect on suction surface. In Fig. 14 are amplitude-frequency curves of rotor blade aerodynamic load at different pressure ratios. It shows peak frequencies are manly at frequency doubling of stator-rotor interaction, especially at one time frequency (1×). With the increasing of pressure ratio, fluctuation peaks are nearly no change. Hence, it can draw a conclusion that the effect of pressure ratio is not obvious on the strength of unsteady disturbance.
3.3.2. Rotational speed
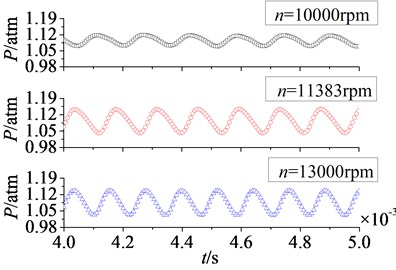
At the same pressure ratio, aerodynamic load on rotor blade is calculated at different rotational speeds which are 10000 rpm, 11383 rpm and 13000 rpm, as shown in Fig. 15-Fig. 17.
Fig. 15Time domain curves of rotor blade aerodynamic load at different rotational speeds
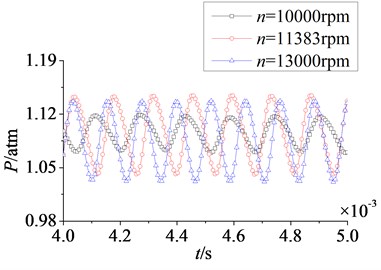
a) Pressure surface
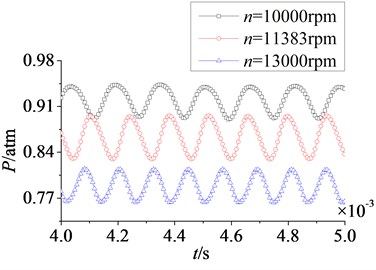
b) Suction surface
Fig. 16Unfolded time domain curves of rotor blade aerodynamic load at different rotational speeds
a) Pressure surface
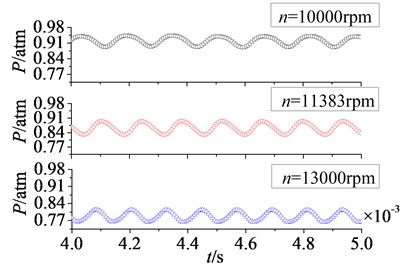
b) Suction surface
In Fig. 15 are the time domain curves of rotor blade aerodynamic load at different rotational speeds. With the increasing of rotational speed, the magnitude of aerodynamic load on pressure surface is no clear change, but on suction surface the magnitude decreases gradually. For pulsation amplitude, the variation laws on pressure and suction surfaces are consistent. When rotational speed increases from 10000 rpm to 11383 rpm, the pulsation amplitude of aerodynamic load increases gradually. At rotational speed 11383 rpm, pulsation amplitude reaches a higher value. Then continuing to rise the rotational speed to 13000 rpm, there is no obvious change in pulsation amplitude. So rotational speed has a direct influence on the magnitude of aerodynamic load, and it also affects the pulsation amplitude of aerodynamic load in a certain speed range.
In Fig. 16 are unfolded time domain curves of rotor blade aerodynamic load at different rotational speeds. It is shown that the number of pulsation periods on pressure surface is equal to that on suction surface at a certain rotational speed. With the increasing of rotational speed, the number of pulsation periods increases. When rotational speeds are at 10000 rpm, 11383 rpm and 13000 rpm, the numbers of pulsation periods in 0.004 s to 0.005 s are respectively 6, 7 and 8. It indicates the increasing of rotational speed enhances unsteady characteristic of aerodynamic load on rotor blade.
Fig. 17Amplitude-frequency curves of rotor blade aerodynamic load at different rotational speeds
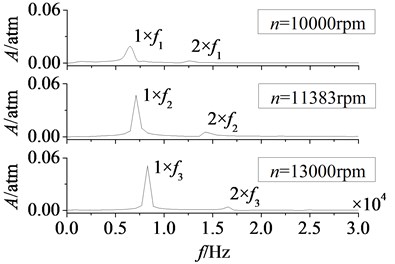
a) Pressure surface
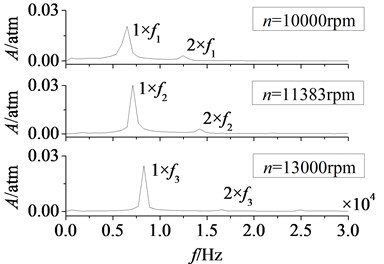
b) Suction surface
In Fig. 17 are the amplitude-frequency curves of rotor blade aerodynamic load at different rotational speeds. Here in figure, is the rotational speed, is rotor blade number. Peak frequencies increase gradually with the increasing of rotational speed, it is because the increasing of rotational speed makes the stator-rotor interaction frequency rise. Fluctuation peaks are mainly at frequency doubling of stator-rotor interaction, so peak frequencies of aerodynamic load move backwards. In addition, the peak value of dominant fluctuation frequency increases with the rotational speed in a certain range. After rotational speed rises to 11383 rpm, there is no clear change in peak value.
3.3.3. Ratio of stator-rotor blade number
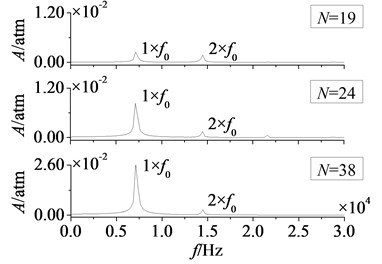
At the same pressure ratio and rotational speed, assuming basic parameters of rotor blade are constant (where rotor blade number is 38). In order to obtain different ratios of stator-rotor blade number, stator blade number is adjusted to 19, 24, 38, 48 and 76, here blade number ratio . Then the distribution of aerodynamic load on rotor blade is analyzed at different ratios of stator-rotor blade number, as shown in Fig. 18-Fig. 21.
1) 1.
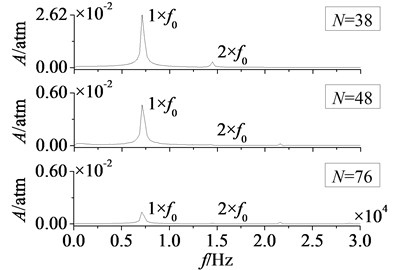
In Fig. 18 and Fig. 19 are respectively time domain and amplitude-frequency curves of rotor blade aerodynamic load at 1. As can be found that the effects of stator-rotor blade number ratio on pressure and suction surfaces are similar. Compared with pressure surface, the effect on suction surface is more obvious. In Fig. 18, magnitude and pulsation amplitude of aerodynamic load increase gradually with the increasing of stator-rotor blade number ratio. But the variation on suction surface is more obvious than that on pressure surface. When rises to 1 (here ), magnitude and pulsation amplitude reach the maximum. Fig. 19 shows peak frequencies of aerodynamic load don’t vary with the ratio of stator-rotor blade number, and are manly at frequency doubling of stator-rotor interaction, especially at one time frequency (1×). Besides, the peak value of dominant fluctuation frequency increases with stator-rotor blade number ratio, and it reaches the maximum at 1.
Fig. 18Time domain curves of rotor blade aerodynamic load at λ≤ 1
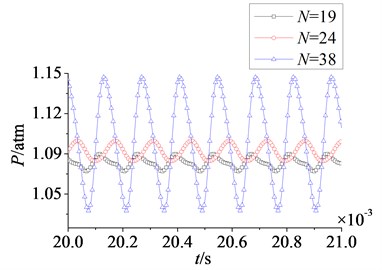
a) Pressure surface
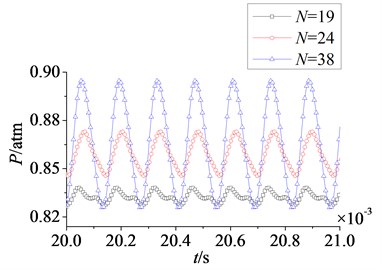
b) Suction surface
Fig. 19Amplitude-frequency curves of rotor blade aerodynamic load at λ≤ 1
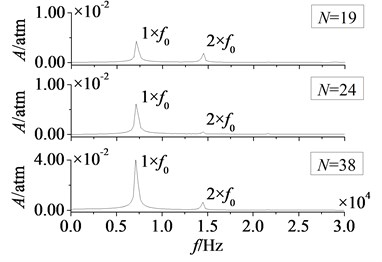
a) Pressure surface
b) Suction surface
Fig. 20Time domain curves of rotor blade aerodynamic load at λ≥ 1
a) Pressure surface
b) Suction surface
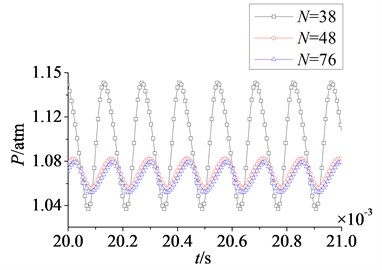
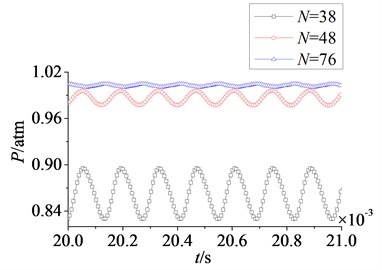
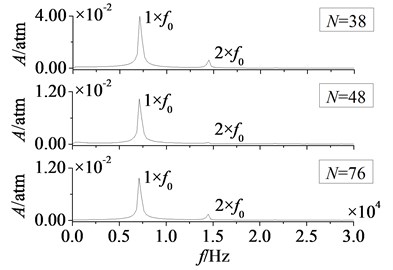
2) 1
In Fig. 20 and Fig. 21 are respectively time domain and amplitude-frequency curves of rotor blade aerodynamic load at 1. The effect of stator-rotor blade number ratio on suction surface is more obvious than the effect on pressure surface, which is consistent with the situation at 1. Pulsation amplitude and peak value of aerodynamic load on pressure and suction surfaces are maximum at 1. With the increasing of stator-rotor blade number ratio, pulsation amplitude and peak value decrease gradually. But the variation law of magnitude on suction surface is different from that on pressure surface. Fig. 20 shows the magnitude of aerodynamic load on pressure surface decreases gradually with the increasing of stator-rotor blade number ratio, while the magnitude increases gradually on suction surface. Compared with pressure surface, the variation of magnitude and pulsation amplitude on suction surface is much greater. In Fig. 21, it can be found that peak frequencies don’t vary with stator-rotor blade number ratio, and are manly at frequency doubling of stator-rotor interaction. This illustrates stator-rotor blade number ratio has no direct influence on the dominant fluctuation frequencies of aerodynamic load, when rotor blade number is constant.
Fig. 21Amplitude-frequency curves of rotor blade aerodynamic load at λ≥ 1
a) Pressure surface
b) Suction surface
4. Conclusions
In this paper, considering the effect of rotor-stator interaction in an aero-engine compressor rotor system, unsteady 3D flow field is simulated with the commercial CFD software. It analyzes the process of stator-rotor interaction and the distribution law of rotor blade aerodynamic load. In addition, the effects on rotor blade aerodynamic load are discussed at different pressure ratios, rotational speeds and ratios of stator-rotor blade number. The results show:
1) Unsteady flow field area with lower speed is induced by stator-rotor interaction at the rotor blade leading edge. Mass flow and static pressure of rotor flow field fluctuate periodically in sine or cosine law, and the pulsation period is equal to stator-rotor interaction period . Besides, when the overlap space between stator and rotor channels reaches the maximum, mass flow and static pressure aroud rotor blade will appear jumping fluctuations suddenly.
2) Aerodynamic load on rotor blade is unsteady pulsation pressure, and dominant fluctuation frequencies of aerodynamic load are manly at frequency doubling of stator-rotor interaction, especially at one time frequency (1×). In the interaction period , variations of aerodynamic load on pressure and suction surfaces take the contrary trend, and magnitude and pulsation amplitude on pressure surface are far greater than that on suction surface.
3) Effects of pressure ratio on pressure and suction surfaces are consistent, the magnitude of aerodynamic load increases with pressure ratio, but pulsation amplitude is nearly no change. Rotational speed affects the magnitude of aerodynamic load on suction surface more heavily than that on pressure surface. And the increasing of rotational speed makes stator-rotor interaction frequency rise, so that unsteady characteristics of aerodynamic load are enhanced. At stator-rotor blade number ratio 1, pulsation amplitude of aerodynamic load reaches the maximum. The effect of stator-rotor blade number ratio on suction surface is more obvious than the effect on pressure surface, and it has no direct influence on the dominant fluctuation frequencies when rotor blade number is constant.
References
-
Erdos J. I. Computation of Unsteady Transonic Flows Through Rotating and Stationary Cascades. National Aeronautics and Space Administration, Scientific and Technical Information Office, 1977.
-
Gundy-Burlet K. L. Unsteady two- and three-dimensional Navier-Stokes simulations of multistage turbomachinery flows. Computing Systems in Engineering, Vol. 3, Issue 1, 1992, p. 231-240.
-
He L., Denton J. D. Three-dimensional time-marching inviscid and viscous solutions for unsteady flows around vibrating blades. Journal of Turbomachinery, Vol. 116, Issue 3, 1994, p. 469-476.
-
Arnone A., Pacciani R. Rotor-stator interaction analysis using the Navier-Stokes equations and a multigrid method. Journal of Turbomachinery, Vol. 118, Issue 4, 1996, p. 679-689.
-
Ernst M., Michel A., Jeschke P. Analysis of rotor-stator-interaction and blade-to-blade measurements in a two stage axial flow compressor. Journal of Turbomachinery, Vol. 133, Issue 1, 2011, p. 011027.
-
Sentker A., Riess W. Experimental investigation of turbulent wake-blade interaction in axial compressors. International Journal of Heat and Fluid Flow, Vol. 21, Issue 3, 2000, p. 285-290.
-
Gorrell S. E., Okiishi T. H., Copenhaver W. W. Stator-rotor interactions in a transonic compressor – Part 1: Effect of blade-row spacing on performance. Journal of Turbomachinery, Vol. 125, Issue 2, 2003, p. 328-335.
-
Shuang G., Shaowen C., Yanping S., et al. Effects of boundary layer suction on aerodynamic performance in a high-load compressor cascade. Chinese Journal of Aeronautics, Vol. 23, Issue 2, 2010, p. 179-186.
-
Hodson H. P. Blade row interference effects in axial turbomachinery stages. VKI Lecture Series, Vol. 2, 1998.
-
Wisler D. C., Shin H. W. Blade row interaction and unsteady effects in axial-flow compressors and fans. Lecture Series-Van Kareman Institute for Fluid Dynamics, Vol. 2, 1998, p. G1-G54.
-
Trébinjac I., Charbonnier D., Leboeuf F. Unsteady rotor-stator interaction in high speed compressor and turbine stages. Journal of Thermal Science, Vol. 14, Issue 4, 2005, p. 289-297.
-
Biollo R., Benini E. Recent advances in transonic axial compressor aerodynamics. Progress in Aerospace Sciences, Vol. 56, 2013, p. 1-18.
-
Kulisa P., Dano C. Numerical simulation of unsteady blade row interactions induced by passing wakes. European Journal of Mechanics-B/Fluids, Vol. 25, Issue 3, 2006, p. 379-392.
-
Zhao B., Yang C., Chen S., et al. Unsteady flow variability driven by rotor-stator interaction at rotor exit. Chinese Journal of Aeronautics, Vol. 25, Issue 6, 2012, p. 871-878.
-
Gnesin V. I., Kolodyazhnaya L. V., Rzadkowski R. A numerical modelling of stator-rotor interaction in a turbine stage with oscillating blades. Journal of Fluids and Structures, Vol. 19, Issue 8, 2004, p. 1141-1153.
-
Mingming M., Yanping S., Zhongqi W. Numerical investigation of the unsteady flow in a transonic compressor with curved rotors. Chinese Journal of Aeronautics, Vol. 21, Issue 2, 2008, p. 97-104.
-
Beheshti B. H., Teixeira J. A., Ivey P. C., et al. Parametric study of tip clearance-casing treatment on performance and stability of a transonic axial compressor. Journal of Turbomachinery, Vol. 126, Issue 4, 2004, p. 527-535.
-
Lu X., Chu W., Zhu J., et al. Mechanism of the interaction between casing treatment and tip leakage flow in a subsonic axial compressor. ASME Turbo Expo 2006: Power for Land, Sea, and Air. American Society of Mechanical Engineers, 2006, p. 79-90.
-
Mischo B., Burdet A., Abhari R. S. Influence of stator-rotor interaction on the aerothermal performance of recess blade tips. Journal of Turbomachinery, Vol. 133, Issue 1, 2011, p. 011023.
-
Houghton T., Day I. Enhancing the stability of subsonic compressors using casing grooves. Journal of Turbomachinery, Vol. 133, Issue 2, 2011, p. 021007.
-
Kim J. H., Choi K. J., Kim K. Y. Aerodynamic analysis and optimization of a transonic axial compressor with casing grooves to improve operating stability. Aerospace Science and Technology, Vol. 29, Issue 1, 2013, p. 81-91.
-
Launder B. E., Spalding D. B. The numerical computation of turbulent flows. Computer Methods in Applied Mechanics and Engineering, Vol. 3, Issue 2, 1974, p. 269-289.
-
Baker A. J. Finite element analysis of turbulent flows. Numerical Methods in Laminar and Turbulent Flow, Vol. 1, 1978, p. 203-229.
-
Guevremont G., Habashi W. G., Kotiuga P. L., et al. Finite element solution of the 3D compressible Navier-Stokes equations by a velocity-vorticity method. Journal of Computational Physics, Vol. 107, Issue 1, 1993, p. 176-187.
-
Hoff D. Global solutions of the Navier-Stokes equations for multidimensional compressible flow with discontinuous initial data. Journal of Differential Equations, Vol. 120, Issue, 1995, p. 215-254.
-
Adamczyk J. J. Aerodynamic analysis of multistage turbomachinery flows in support of aerodynamic design. Journal of Turbomachinery, Vol. 122, Issue 2, 2000, p. 189-217.
-
Hall E. J. Aerodynamic modelling of multistage compressor flow fields. Part 1: Analysis of rotor-stator-rotor aerodynamic interaction. Proceedings of the Institution of Mechanical Engineers, Part G: Journal of Aerospace Engineering, Vol. 212, Issue 2, 1998, p. 77-89.
About this article

The work is supported by the National Science Foundation of China (Grant No. 51275081) and the National Science Foundation of China (Grant No. 51335003).
