Abstract
The degradation of concrete and rebar corrosion are considered a key factor in the durability of reinforced concrete structures and a major concern for civil engineers over the past few years. This study is focus on the variation of natural frequency, dynamic properties and seismic spectral in a deteriorated scale-down reinforced concrete frame specimen with rebar corrosion. The dynamic properties were experimentally studied though shaking table tests and the corrosive behaviors were experimentally studied though accelerated corrosion test. Test results presented that the corroded reinforced concrete specimens presented the changes in the dynamic response especially natural frequencies and response spectrum and rebar corrosion caused significant charges in dynamic responses. In conclusion, the deteriorated scale-down reinforced concrete test is useful for structural assessments and appraisals applied to full-scale structures.
1. Introduction
Concrete is a durable material that does not require maintenance for many years when it properly designed for the service condition and properly placed [1]. Through the suitably selection cement-based binders, aggregates or inert additives and the control of macrostructure and microstructure properties, concrete can be made to resist physical attacks such as drying shrinkage, abrasion or freezing and thawing as well as chemical attacks such as dissolved from sulfates or acids, carbonation, leaching or efflorescence. On the other hand, concrete is relatively strong in compression but quietly weak in tension. Reinforced concrete (RC) is widely used in construction and the reinforced bars are generally designed to resist the tensile stress in particular regions of the concrete and incorporated to strengthen a material avoiding brittle destruction. However, concrete is intrinsically porous and may deteriorate or depredate as a result of harsh environmental exposure or poor construction quality [2]. Such material deterioration may cause severe damage on RC structures such as cracking, delaminating, spalling or even fracture. Also, if concrete is more permeable and poor protected throughout its designed service life, the detrimental substances such as chloride ion, sulfate ion and acid can easily penetrate into concrete, and thus the rebar corrosion of RC structure is induced and accelerated [3]. The rebar corrosion could cause the oxidation products appear and expand, which tends to scaling, cracking the concrete, de-bonding the rebar from the concrete and spalling. The degradation of concrete and the effect of rebar corrosion are considered a key factor in the durability of RC structures and a major concern for civil engineers [4, 5].
Many previous researchers have studied the effect of rebar corrosion in RC members or structures either in static mechanical properties or fatigue behaviors individually; however, few studies have evaluated the dynamic behaviors of RC structures considering corrosion hazards especially for the response spectrum. Razak used an experimental investigation to study the effect of rebar corrosion on the modal parameters of RC members. It indicated that there was a decrease trend in the natural frequencies [6]. Li also represented that the degree of corrosion had a considerable influence on the behavior of the RC columns [7]. Maalej reported that the experimental results revealed significant changes in the normalized frequency with moderate reinforcement corrosion of RC beams [8]. Simon presented the effects of corrosion on the seismic response of a typical RC bridge [9]. The findings of this study indicated that the reduction in strength from cross-sectional area of the reinforcement and stiffness in concrete cover spalling only marginally influence the seismic fragility of the RC bridge. Several studies also verified that rebar corrosion could cause influences on RC members and evaluated of the effect on material degradation and rebar corrosion was an important issue in civil and structural engineering field in recent years. This study is aim to clarify the variation of natural frequency, dynamic properties and seismic spectral in a deteriorated scale-down RC specimen with rebar corrosion. The dynamic properties were experimentally studied through shaking table tests. Corrosion test, frequency analysis and response spectrum were measured and compared.
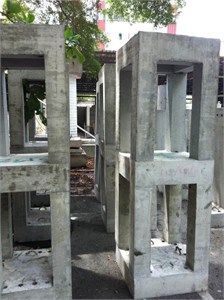
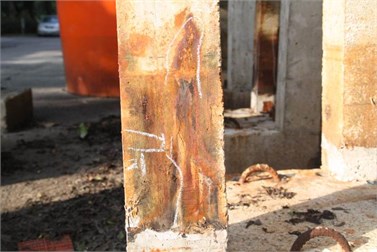
Fig. 1Appearance of the RC frame specimens
2. Experiment
2.1. Specimens
The scale-down RC frame specimen is 2-stories and structure and the dimension of typical specimen is 220 cm high, 70 cm wide, 70 cm deep and the net weigh is approximately 950 kgf. In addition, the self-consolidating concrete of 450 kg/cm2 was used in accordance with ASTM C1611 and the embedded #3 rebar was made of medium carbon steel following the specification of ASTM A615. The appearance and details of RC frame specimen are shown in Figs. 1 to 2, respectively.
Fig. 2Drawing of the RC specimens
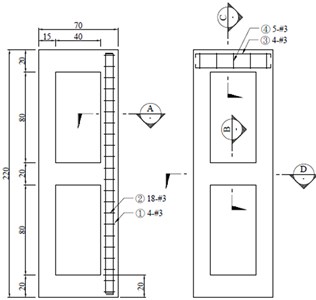
a) side view
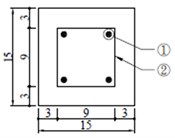
b) A-A section
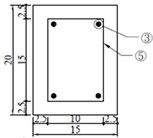
c) B-B section
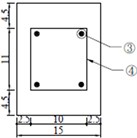
d) C-C section
2.2. Testing methods
For accelerated corrosion test, the corrosion cell was connected so that #3 rebar acted as working electrode, saturated calomel electrode as reference electrode, and the titanium mesh as counter electrode. A direct voltage with a potential of 60 V was applied and the open circuit potential (OCP) and corrosion rate was measured using a Galvanostatic Pulse Measurements at a 24-hour interval. The specimen was immersed in 3.5 % NaCl solution to achieve the accelerated corrosion test. The polarization resistance () is generally related to a uniform corrosion rate and the polarization resistance measurements are accurate and rapid. The polarization resistance of the reinforcing steel is defined as the slope of the potential-current density curve at the zero current point when the rate of polarization is close to zero:
where is the polarization resistance (KΩ-cm2), is the applied potential (mV) and is the current density (mA/cm2).
In this study, a short time anodic current pulse is impressed galvanostatically to rebar from a counter electrode placed on concrete surface together with a reference electrode. The applied current is normally in the range of 5 to 400 μA and the typical pulse duration is up to 10 seconds. The small anodic current results in change of rebar potential which is recorded as a function of polarization time. Rebar is polarized in anodic direction compared to its free corrosion potential. The polarized potential of rebar, , at the given time can be expressed as Eq. (2) when the constant current is applied to the system:
where is the double layer capacitance and is the ohmic resistance.
In order to obtain values of and separate from the ohmic resistance this equation can be transferred to linear form as follows:
where is the final steady potential value.
The polarization resistances were then calculated using least square linear regression analysis. In addition, the corrosion current density () can be estimated from Stern-Geary equation:
where is the corrosion current density, is the polarization resistance.
For iron, the constant, , is assumed to be 26 mV in evaluating corrosion rate of steel for actively corroding system and 52 mV for passively system. After the corrosion current density is obtained, the instantaneous corrosion rate () can be calculated from Faraday’s law as follows:
where is Faraday’s constant (96500 coulombs/equivalent), is the number of equivalent exchange, and is the atomic weight. The appearance of the corrosion test set-up is shown in Fig. 3.
Fig. 3Appearance of the corrosion test set-up
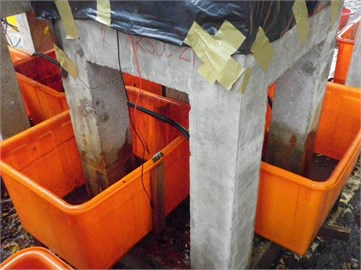
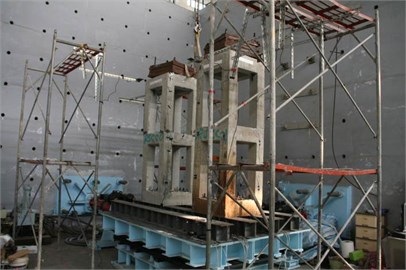
Fig. 4Appearance of the shaking table test set-up
2.3. Shaking table test
The RC frame specimens were connected to the shaking table by bolts and the appearance of the shaking table test is shown in Fig. 4. The shaking table has 2 degree of freedom system with a frequency range between 0.1-50 Hz and the maximum specimen weight is 6 tons. In addition, the maximum acceleration for lateral and longitudinal is 0.9 g and 1.0 g, respectively. The testing cases of uni-axial white noise wave testing and a set of tri-axial artificial motion testing and impact pulse testing were implemented for each testing item. The testing programs and associated input motion were scheduled as shown in Table 1 and the acceleration time histories of fictitious seismic input motion in N-S and E-W direction are shown in Fig. 5.
Fig. 5Acceleration time histories curves (PGA = 200 gal)
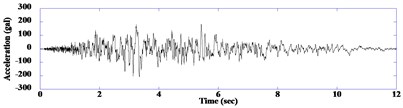
a) N-S direction
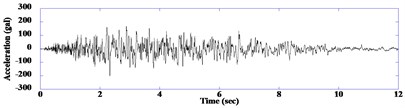
b) E-W direction
Table 1Testing programs
Test program | |||
Case | Input motion | -direction (NS) | -direction (EW) |
Peak ground acceleration (g) | |||
Test 1 Test 2 Test 3 | White noise- | 0.05 | |
White noise- | 0.05 | ||
N-S test | 0.60 | ||
E-W test | 0.60 | ||
Two direction test | 0.60 | 0.60 | |
The maximum artificial motion is 0.6 g, and the time history has a duration of 12 s. The accelerometers and laser Doppler displacement meters were applied in the top of the specimen for the measurement of the acceleration and displacement response of the RC specimen. In addition, all data from the OCP and corrosion test were measured at various elevations (0 cm, 15 cm and 30 cm) of the RC column and those were the average of forty-eight values at each RC frame specimens.
3. Results and discussion
3.1. OPC measurement
According to ASTM C876, when the OCP is between 0 and –106 mV (Ag/AgCl2), the probability here is less than 10 % that reinforcing may corrode. When the potential ranges from –106 mV to –256 mV (Ag/AgCl2), corrosion probability is uncertain and corrosion probability may be higher than 90 % for OCPs higher than –256 mV (Ag/AgCl2). The relationships between immersion times and potentials at the accelerated time of 7, 14 and 21 days are illustrated in Figs. 6(a) to 6(c), respectively. After the immersion time of 1 day, the OCP values of all specimens dropped rapidly over –256 mV and hightend the corrosion probability of reinforcing steel. The OCP curves of the specimens at the immersion time of 7 days dropped rapidly from –350 mV to –600 mV and cracks on the surface of the concrete can be found.
Fig. 6Open circular potentials versus immersion time curves
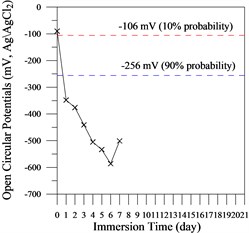
a) Accelerated time = 7 days
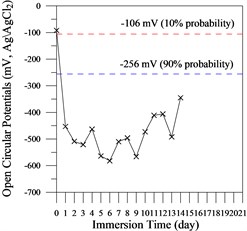
b) Accelerated time = 14 days
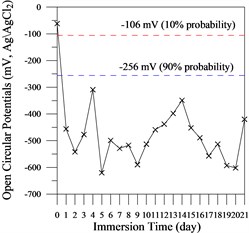
c) Accelerated time = 21 days
The curves at 14 days also dropped rapidly up to –600 mV and the potentials rose slightly up to –400 mV due to the passive film broken. The potentials of the specimens for 21-days accelerated immersion rapidly to –600 mV for immersion time from 2 to 9 days and rose to –450 mV from 10 to 16 days. And then the potentials dropped again up to –600 mV and the specimens had an active effect on accelerated progression toward active potentials. The significant cracks, rust and rusty spots were observed on the surface of the RC specimens as shown in Fig. 7.
Fig. 7Appearance of the cracks, rust and rusty spots on the surface of the specimens
3.2. OPC measurement
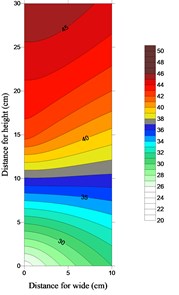
The relationships between corrosion rate and immersion time at the accelerated time of 7, 14 and 21 days are shown in Figs. 8(a) to 8(c), respectively. The corrosion rate increased significantly with an increase in accelerated immersion time and reached steady value up to 32, 38 and 40 µm/year of the specimens at the accelerated time of 7, 14 and 21 days, respectively. It also indicated that the RC specimen was like to be a high corrosion rate [10] in this accelerated method. The amount of chloride ions had reached to the critical value. This means that the passive protective film on the rebar had been totally spoiled, and thus the corrosion rate of the rebar increased abruptly. Therefore, the accelerated corrosion method is suitable for carrying out the corrosion evaluation of the scale-down RC frame specimen. In addition, the 2D plot of corrosion rate value is shown in Fig. 9. The corrosion rate of the RC specimen increases with the height increase because the lower part of the specimen filled with NaCl solution and the superstructure was in the intertidal zone (tidal zone).
Fig. 8Corrosion rate versus immersion time curves
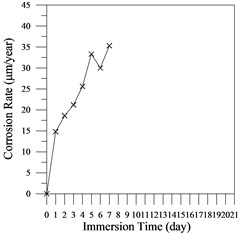
a) Accelerated time = 7 days
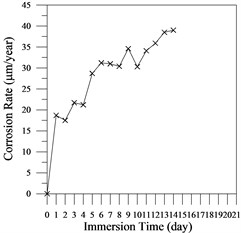
b) Accelerated time = 14 days
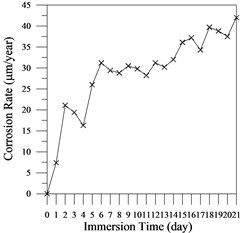
c) Accelerated time = 21 days
Fig. 92D plot of corrosion rate values (Accelerated time = 21 days)
3.3. Natural frequency measurement
The natural frequencies generated by white noise method using shaking table test and transfer function curves before and after 21 day accelerated immersion are shown in Fig. 10(a) and 10(b), respectively. The natural frequency of 1st mode in non-corroded and corroded specimen was 9.62 and 8.89 Hz. It was also observed in general the trend of the magnitude of the percentage change in natural frequencies decreased with the corrosion rate increased. The movements of aggressive ions toward the surface of embedded reinforcing steels caused the serious corroded rebar debonding and loss in structural stiffness. Further, the rebar corrosion of the RC frame specimen caused slight deteriorated to the natural frequencies and structural capacity.
3.4. Maximum displacement and acceleration measurement
The displacement curves of the non-corroded and corroded specimens at the peak ground acceleration of 0.60 g for two direction test are illustrated in Fig. 11(a) and 11(b), respectively. For the peak ground acceleration of 0.60 g, the maximum displacements of the non-corroded specimens for -direction, -direction and two direction tests were 4.66, 4.66 and 2.91 mm. The maximum displacements of the corroded specimens for -direction, -direction and two direction tests were 6.54, 5.42 and 4.15 mm. It indicated that the rebar corrosion caused an increase in the maximum displacement. The maximum displacement for two direction test was lower than one direction test because the values may be misled by interaction effect.
The acceleration curves of the non-corroded and corroded specimens at the peak ground acceleration of 0.60 g for two direction test are illustrated in Fig. 12(a) and 12(b), respectively. For the peak ground acceleration of 0.60 g, the maximum accelerations of the non-corroded specimens for -direction, -direction and two direction tests were 2236, 1927 and 1922 gal. The maximum accelerations of the corroded specimens for -direction, -direction and two direction tests were 2469, 1732 and 1971 gal. The rebar corrosion caused a slightly decrease in the maximum acceleration and the trends were similar as the results of displacement measurement. The rebar corrosion had a considerable influence on the dynamic behavior of the RC specimens.
Fig. 10Fourier amplitude versus frequency curves
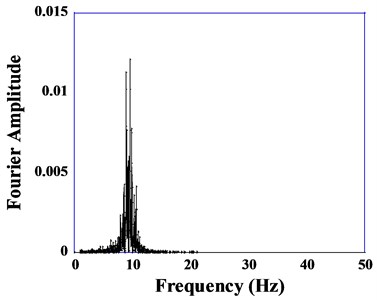
a) Non-corroded specimen
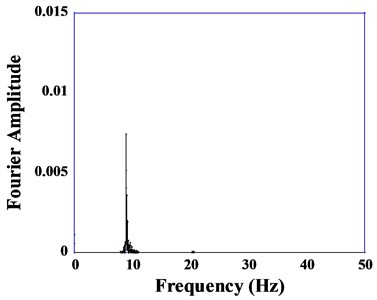
b) Corroded specimen
Fig. 11Displacement versus time curves (a= 0.60 g)
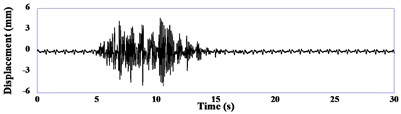
a) Non-corroded specimen
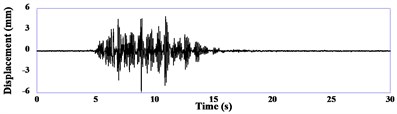
b) Corroded specimen
Fig. 12Acceleration versus time curves (a= 0.60 g)
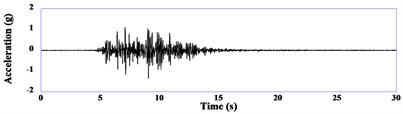
a) Non-corroded specimen
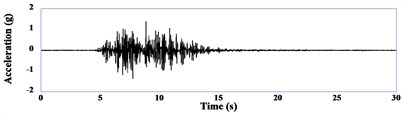
b) Corroded specimen
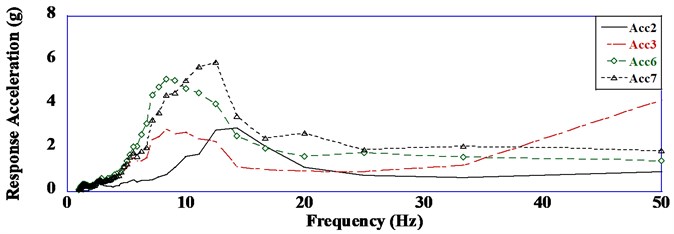
3.5. Response spectral curves
The response spectral curves (damping ratio = 5 %) of the non-corroded and corroded specimens at the peak ground acceleration of 0.20, 0.40 and 0.60 g for two direction test are illustrated in Figs. 13 to 15, respectively. In those figures, Acc2 and Acc6 represents the middle and top accelerometers of the non-corroded specimen, respectively; Acc3 and Acc7 represents the middle and top accelerometers of the corroded specimen, respectively. It indicated that the peak of middle floor tended towards lower frequency domain than that of top floor. The peak of spectral response curves in the corroded specimens tended towards larger response acceleration than those in the non-corroded specimens and it was especially significant to the specimens at the peak ground acceleration of 0.60 g. Therefore, the corroded RC frame specimens had larger dynamic response and were consistency with the results of displacement, acceleration measurement and corrosion test.
Fig. 13Response acceleration versus frequency curves (a= 0.20 g)
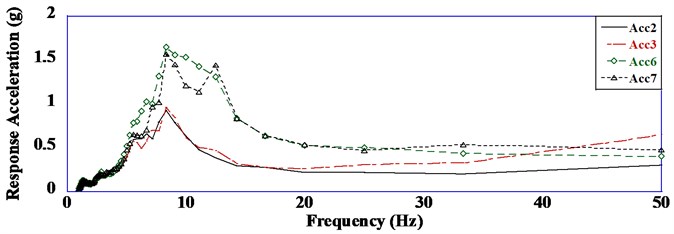
Fig. 14Response acceleration versus frequency curves (a= 0.40 g)
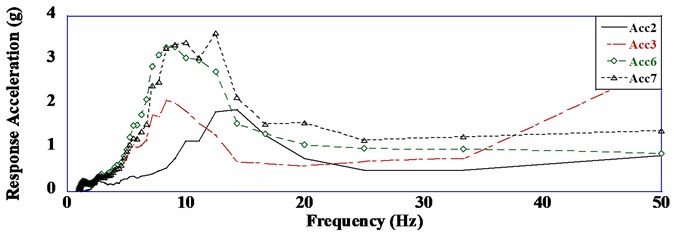
Fig. 15Response acceleration versus frequency curves (a= 0.60 g)
4. Conclusions
The corrosion measurements and a shaking table test were performed for evaluation the effect on the dynamic properties of the corroded scale-down RC frame specimens. Test results indicated that the corroded specimens had greater corrosion probability, higher corrosion rate, lower frequency, larger displacement, larger acceleration and higher peak of spectral response curve compared to the non-corroded specimen. The accelerated corrosion method described here is suitable for evaluating the corrosion behavior of the scale-down RC specimens. Generally, the results also presented that rebar corrosion caused significant charges in dynamic responses and it was especially significant to the specimens at the peak ground acceleration of 0.60 g.
References
-
Fiore A., Marano G. C., Monaco P., Morbi A. Preliminary experimental study on the effects of surface-applied photocatalytic products on the durability of reinforced concrete. Construction and Building Materials, Vol. 48, 2013, p. 137-143.
-
Mirza J., Durand B., Bhutta A. R., Tahir M. M. Preferred test methods to select suitable surface repair materials in severe climates. Construction and Building Materials, Vol. 50, 2013, p. 682-698.
-
Dang Y., Xie N., Kessel A., McVey E., Pace A., Shi X. Accelerated laboratory evaluation of surface treatments for protecting concrete bridge decks from salt scaling. Construction and Building Materials, Vol. 55, 2014, p. 128-135.
-
Flatt R. J., Roussel N., Cheeseman C. R. Concrete: An eco material that needs to be improved. Journal of the European Ceramic Society, Vol. 32, Issue 11, 2012, p. 2787-2798.
-
Güneyisi E., Gesoğlu M., Karaboğa F., Mermerdaş K. Corrosion behavior of reinforcing steel embedded in chloride contaminated concretes with and without metakaolin. Composites Part B, Vol. 45, Issue 1, 2013, p. 1288-1295.
-
Razak H. A., Choi F. C. The effect of corrosion on the natural frequency and modal damping of reinforced concrete beams. Engineering Structures, Vol. 23, Issue 9, 2001, p. 1126-1133.
-
Li J., Gong J., Wang L. Seismic behavior of corrosion-damaged reinforced concrete columns strengthened using combined carbon fiber-reinforced polymer and steel jacket. Construction and Building Materials, Vol. 23, Issue 7, 2009, p. 2653-2663.
-
Maalej M., Chhoa C. Y., Quek S. T. Effect of cracking, corrosion and repair on the frequency response of RC beams. Construction and Building Materials, Vol. 24, Issue 5, 2010, p. 719-731.
-
Simon J., Bracci J. M., Gardoni P. Seismic response and fragility of deteriorated reinforced concrete bridges. Journal of Structural Engineering, Vol. 136, Issue 10, 2010, p. 1273-1281.
-
Broomfield J. P. Corrosion of Steel in Concrete: Understanding, Investigation and Repair. Second Edition. Taylor and Francis, New York, 2007.
About this article

