Abstract
The increased vibration level of the railway bridge could make significant noise and, also, cause structural damages such as fatigue cracks. Related to these subjects, a spherical elastomeric bridge bearing, which is layered by hemispherical rubber and steel plates, was investigated in terms of its vibration performance. Several different shape factors could be considered by changing the curvature of hemispherical surface and size in rubber and steel plate thicknesses in the manufacturing stage. The performance of the spherical elastomeric bearing for the reduction in vibration was compared with that of the conventional bearing by performing vibration experiments on a scale-downed model. The rubber material characteristics and spherical shape are found to be important parameters in reducing the bridge vibration.
1. Introduction
Railway noises and vibrations include structural noise made as running vibration is conveyed to the structure, and other noises from the contact surface between wheels and rails (friction noises from rail roughness, slip and curved sections). Such noises and vibrations are conveyed to nearby residential areas and structures via the ground, threatening their stability [1] (Kostil et al., 2008). Bridge bearings, which are applied to support the upper structure of the railway bridge, should be designed to accommodate a high rotation angle that may be induced by wheel load since unlike road bridges, they are more greatly influenced by wheel load than self-load. Under the load of a moving train, the dynamic response of a railway bridge is one of the most important factors in bridge design, and it should be properly considered [2] (Wang et al., 2003). For railway bridge bearings, steel was largely used in the past, but today rubber and urethane are increasingly used. Spherical bearing (Fig. 1), one of the representative railway bridge bearings, can accommodate a high rotation angle compared to existing bridge bearings, and the technology introduced from Japan in the past has been used in Korea up to now. Spherical steel bearing was basically designed to accommodate a high rotation angle in structures through spherical surface friction by applying hemispherical brass wear plates to the die-cast body, and includes MoS2 in construction for lubrication of the friction surface. Spherical steel bearing has rubber or brass sealing applied for smooth frictional behavior, but rubber or brass ring requires maintenance because of low durability and vulnerability to breakage [3] (Roeder et al., 1995). Thus, elastomeric bearing as a substitute can be considered, which was proved in both environmental corrosion resistance and long life, but laminated elastomeric bearing with stiffening plates should consider the effects of repeated load by shape factor to accommodate rotation [4] (Stanton et al., 2008), and laminated elastomeric bearing with flat rubber and stiffening plates is highly limited in using for railway bridges because of its difficulties in accommodating a high rotation angle required by railway bridges. Rubber as a material factor has low rigidity, high deformation capacity and excellent energy dissipation capacity compared to other construction materials, and it is often used for the purpose of reducing vibration. In particular, for seismic isolator like laminated rubber bearing, it plays the most important role in vibration reduction, reducing vibration from outside and dissipating energy. However, rubber varies in performance depending on variables such as material, mixing ratio and workers' skill levels, which makes it difficult to generalize its characteristics, and it is essential to characterize it in the test [5] (Robinson, 1982).
Fig. 1Spherical bearing (Park, Chang-Ho, 2008)
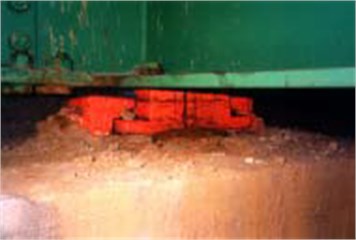
Fig. 2Spherical elastomeric bearing

The recent development spherical elastomeric bearing (Fig. 2) has its inner stiffening plates bent into a hemispherical shape to form a laminated elastomeric structure, which functions to accommodate rotation, as spherical steel bearing does, and to restore through the laminated elastomer after rotation. It also has corrosion resistance and long life, the advantages of elastomeric bearings. This study made a finite element analysis to prove the accuracy of spherical elastomeric bearing design, performed a comparative test of design and analysis values, and prepared a specimen of 500 kN capacity for both compression and rotary compression tests to prove the basic characteristics of spherical elastomeric bearings. In addition, this study prepared a scaled-down bridge model to prove the vibration reduction performance of railway bridges by speed and distance while applying spherical steel bearing and spherical elastomeric bearing.
2. Design of spherical elastomeric bearing and finite element analysis
2.1. Design of spherical elastomeric bearing
The required performance of laminated rubber bearings is generally divided into physical and environmental characteristics. Physical characteristics include compressive stiffness and repeated fatigue, while environmental characteristics include temperature change, long-term aging and ozone, factors related to rubber.
The basic shape of spherical elastomeric bearings should, in general, be designed to show an appropriate form of elastic complex, depending on applied load, installation position and upper structure behavior. The designed spherical elastomeric bearing is a spherical elastic body of laminated steel plates and viscoelastic material, such as rubber, as shown in Fig. 2. Spherical elastomeric bearing was designed under much severer conditions (500 kN in vertical capacity and 0.03 rad in allowable rotational angle) than those of actual bridges.
2.2. Finite element analysis
In this study, a finite element analysis was made using the universal software ANSYS ver. 12, and Fig. 3 shows one example of a finite element model.
A convergence test was performed for appropriate size of elements with the number of elements at approximately 78,000 and the number of panel points at approximately 352,207. Like in the analysis conducted in the verification phase, three-dimensional element Solid 185 supporting viscoelastic materials was used. Reinforced steel plate SS400 and rubber Neo-Hookean were applied. Fig. 3 shows modeling for the finite element analysis of spherical elastomeric bearing.
In the finite element analysis, constraint and load conditions had , and axes applied to the bottom of the bearing so spherical elastomeric bearings act in the same way as actual, and coupling load applied to the upper part of the bearing. In the compression analysis, a vertical load of 500 kN was applied to find the compression behavior characteristics of the bearing, and the findings of design and analysis were compared to each other, as shown in Table 1 and Fig. 4.
Fig. 3FEM modeling
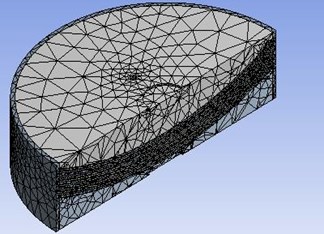
Table 1Comparison design and analysis
Classification | Design | Analysis |
Vertical displacement (mm) | 2.51 | 2.73 |
Compressive stress (MPa) | 18.14 | 21.07 |
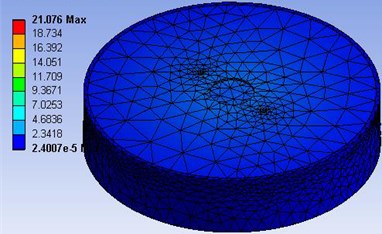
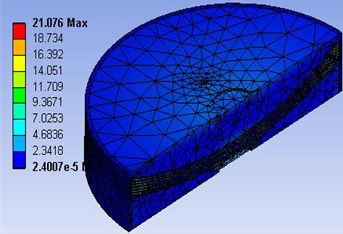
The finite element analysis showed that vertical displacement was 2.51 mm in design and 2.73 mm in analysis with an error of 0.22 mm, while compressive stress was 18.14 MPa in design and 21.07 MPa in analysis with an error of 2.93 MPa. As shown above, design and analysis values for the bearing were very similar to each other, but analysis value was slightly higher than design value because there was a difference between functional formulas used when applying the error in the finite element analysis modeling and viscoelastic material rubber to the analysis.
Fig. 4Von-Mises stress
3. Test of characteristics of spherical elastomeric bearing
The test of characteristics of spherical elastomeric bearing had compression and rotation tests performed following the Compression Test Spec. of ISO 22762 (2010) and BS EN 1337-3 (2005). Finding that individual laminated elastomers were great in strength change due to 1st Shape Factor in design phase, specimen shape factor, rubber shear modulus and applied rotational angle were divided for the test.
3.1. Dimensions of specimen
For spherical elastomeric bearing, a specimen of 500 kN in vertical capacity was designed and prepared, as shown in Table 2 and Table 3. To estimate the effects of shape factor applied to the device, the specimen of 500 kN in capacity was designed and prepared to have around 20, 12 and 8 in shape factor, and then tested. 2nd shape factor of the specimen was designed to have a constant value to raise the accuracy of the estimation of effects of 1st shape factor. The laminated elastic layer had NR (natural rubber) applied as its material, while NR had a special rubber with shear moduli () of 0.9 MPa and 1.2 MPa in 100 % shearing displacement applied. Table 2 shows the physical properties of the materials used in the test.
Table 2Material property
Test spec. | Property | Natural rubber | |
∙100 % 0.9 MPa | ∙100 % 1.2 MPa | ||
KS M 6518 | Hardness (IRHD) | 61.5 | 69.6 |
Tensile strength (MPa) | 28.74 | 25.23 | |
Elongation (%) | 583.333 | 513.198 | |
Table 3Specimen dimensions
0.9 | 20.483 | 3 | 2 | 10 | 236 |
1.2 | |||||
0.9 | 12.286 | 5 | 2 | 6 | |
1.2 | |||||
0.9 | 7.676 | 8 | 2 | 4 | |
1.2 | |||||
– shear modulus (MPa), – 1st shape factor, – rubber thickness (mm), – steel plate thickness (mm), – laminated rubber layer, – bearing diameter (mm), . | |||||
Fig. 5Hysteric curve of compression test (BS EN1337-3)
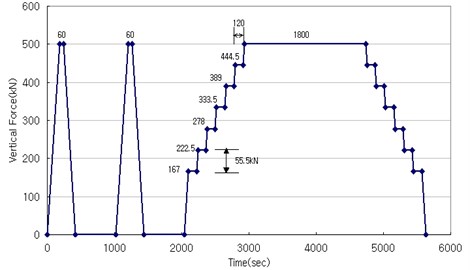
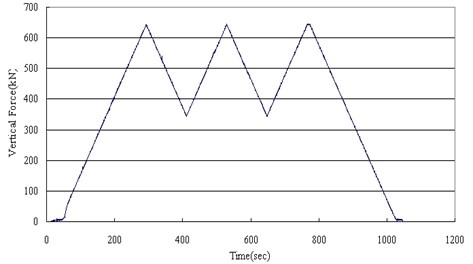
Fig. 6Hysteric curve of compression test (ISO 22762)
3.2. Test conditions and method
For characteristic test, a compression-shear fatigue tester (Fig. 7) was used. Table 4 shows the specifications of the tester. Compression test should measure and analyze vertical strength and deformation except the viscoelastic characteristics of laminated rubber, and establish the relation between elastomeric bearing vertical strength and deflection rather than ISO seismic isolator vertical strength measuring method, while rotation test was performed with inclination plates of 0.03 rad and 0.05 rad applied to compression test (0.0 rad). Compressive stiffness was calculated obtaining the results of deformation for 30 % and 100 % of design load with BS EN 1337-3 and ISO 22762 standards applied, and obtaining a change in compression load against vertical unit deformation. It was calculated using:
where is stress at maximum load and stress at 1/3 of maximum load, and is deformation rate at maximum load and deformation rate at 1/3 of maximum load.
Fig. 72,000 kN fatigue test machine
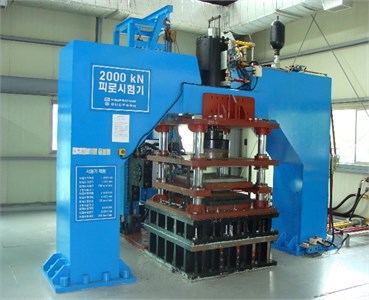
Table 4Specifications of fatigue testing machine
Max. load (kN) | Max. stroke (mm) | Max. velocity (mm/sec) | |
Vertical capacity | ±2,000 | ±100 | 100 |
Horizontal capacity | ±500 | ±200 | 250 |
3.3. Test results and analysis
3.3.1. Compression test
A total of 6 specimens of three different types in shape factor with rubber shear modulus at 0.9 MPa and 1.2 MPa each were prepared for the test.
Table 5Compression test data
Classification | 0.0 rad | ||||||
ISO | BS | ||||||
Vertical load (kN) | S.F | Rubber thickness | Shear modulus | ||||
500 | 20.48 | 3 | 0.9 | 865.8 | 858.2 | 844.4 | 834.6 |
1.2 | 1026.9 | 1039.4 | 1100.0 | 1033.3 | |||
12.28 | 5 | 0.9 | 627.5 | 614.4 | 633.3 | 627.5 | |
1.2 | 855.0 | 885.7 | 865.8 | 901.3 | |||
7.676 | 8 | 0.9 | 344.7 | 342.0 | 351.8 | 351.5 | |
1.2 | 442.6 | 441.6 | 428.8 | 435.2 | |||
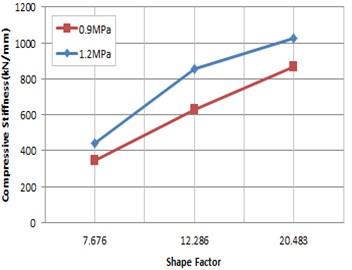
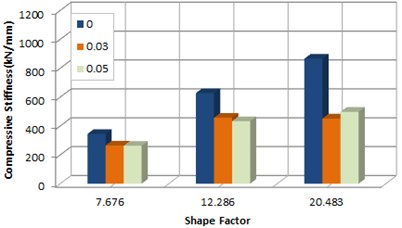
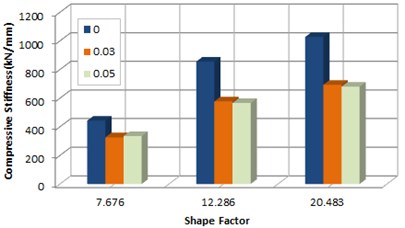
The compression test showed that where 1st shape factor was the same, the higher shear factor was, the higher compressive elastic modulus was. It also showed that where shear factor was constant, the higher 1st shape factor was, the higher compressive elastic factor was. It means that as 1st shape factor increased, the thickness of each rubber layer decreased and the compressive elastic factor of each elastic layer increased. Fig. 8 and Table 5 show briefly the results of characteristic test for compressive stiffness.
Fig. 8Compressive stiffness according to shape factor (0.0 rad)
3.3.2. Compression-rotation test
As shown in Fig. 9, the compression-rotation test with inclination plates applied also showed that the higher shape factor was, the higher rotational stiffness was, similar to the results of the compression test. While the rotation test is underway, no damage to or no permanent deformation specimens in appearance was observed, but there was a temporary bending in the laminated depending on rotation level, and it restored after the removal of load. A complete rotation by the inclination plate is made at 50 % of design load, and it needs to reset load range to estimate the compressive stiffness of spherical elastomeric bearings. Fig. 10 shows the results of compressive stiffness depending on shape factor and rotation angle.
Fig. 9Compression-rotation test
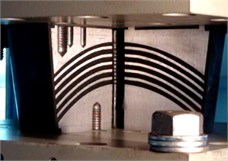
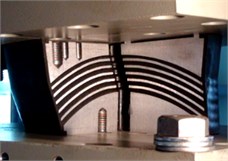
Fig. 10Rotation stiffness according to shape factor
a) Rotation 0.03 rad
b) Rotation 0.05 rad
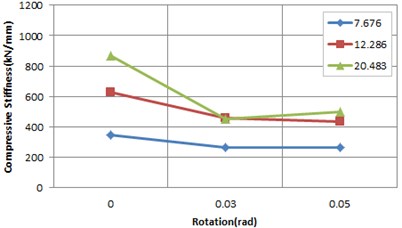
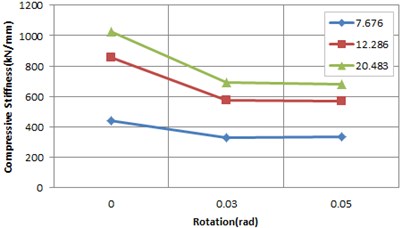
As shown in Fig. 11, where the rotation angle of inclination plates was applied, compressive stiffness decreased more than where rotation angle not applied, with a slight difference in strength between different rotation angles. Unlike the compression test, the compressive stiffness test showed that stiffness dispersion occurred by accommodating displacement with rotational distortion by inclination plates of vertical force. It also showed that the higher rubber shear modulus was, the higher compressive stiffness by rotation was.
Table 6Compression-rotation test data
Classification | 0.03 rad | 0.05 rad | |||||||||
ISO | BS | ISO | BS | ||||||||
Vertical load (kN) | S.F | Rubber thickness | Shear modulus | ||||||||
500 | 20.48 | 3 | 0.9 | 451.3 | 547.2 | 556.9 | 555.3 | 497.8 | 494.93 | 530.0 | 523.7 |
1.2 | 692.9 | 713.5 | 764.4 | 742.4 | 680.2 | 675.25 | 683.0 | 694.9 | |||
12.28 | 5 | 0.9 | 456.3 | 470.5 | 467.3 | 464.4 | 432.9 | 439.35 | 445.8 | 445.8 | |
1.2 | 577.3 | 618.0 | 617.1 | 619.8 | 566.1 | 573.33 | 588.0 | 586.3 | |||
7.676 | 8 | 0.9 | 264.4 | 254.1 | 268.0 | 271.1 | 262.6 | 251.47 | 259.1 | 255.1 | |
1.2 | 326.1 | 320.4 | 324.4 | 331.4 | 335.0 | 320.75 | 348.2 | 332.4 | |||
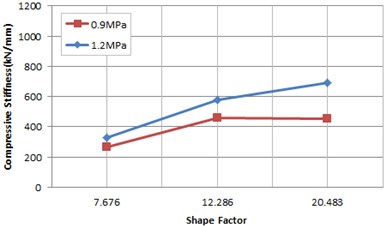
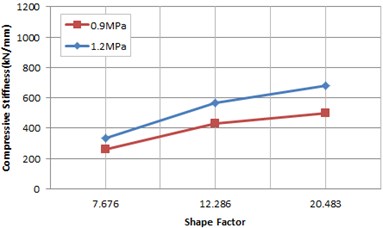
Fig. 11Rotation stiffness according to rotation
a) 0.9 MPa
b) 1.2 MPa
In addition, it turned out that as shape factor increased, deviation from the rotation test with inclination plates applied increased greatly. Since if the shape factor decreases, the vertical deformation that can be accommodated by one deviation from the results of compressive stiffness with inclination plates applied is small. Two specimens with laminated rubber at shear modulus 0.9 MPa and 1.2 MPa applied showed that a change in stiffness by shape factor depending on rotation was small with similar tendency to each other.
Fig. 12Rotation stiffness according to rotation and shape factor
a) 0.9 MPa
b) 1.2 MPa
The analysis of the effects of shape factors depending on inclination plate angle showed that like the results of the analysis above, the stress induced by the inclination plate’s rotation was low compared to the compression test as the laminated bearing turned horizontally with shear deformation and increased displacement, and there was no great difference in stiffness change depending on a change in rotation angle. Fig. 12 shows compression-rotation test results with rotation angle and shape factor.
4. Analysis of noises and vibration test using scaled-down model
4.1. Similitude of scaled-down model
Vibration effects by bridge bearing have largely been evaluated by analytical and experimental methods. However, a vibration test using actual vehicles involves constraints related to test preparation, and difficulties in applying various variables. To overcome such shortcomings, a scaled-down model was introduced. The test involves a review of vibrations from running trains and basic structures depending on bearing types, and to do this, theories of various similarity methods were reviewed. This study adopted Jaschinski’s similarity law [8] (Jaschinski, 1999), which does not consider gravity acceleration in experimental environments. The adopted Jaschinski’s similarity law is used as a method to verify the multi-body dynamic theory for railway vehicles and the feasibility of non-linear equations. Scale-down ratio is 1/50 scale (Table 7), and the following similitude rate was used.
Table 7Similitude rate (1/50)
Scaling factor | Unit | Jaschinski | Full scale |
Velocity | km/hr | 2749.9 | 70 |
Inertia | m4 | 37014.4 | 11.567 |
Weight | tonf | 1.056 | 132 |
Damping | % | 0.000283 | 5 |
Frequency | Hz | 47.38 | 6.7 |
4.2. Preparation and installation of the structure
A scaled-down model of concrete railway bridge was prepared with a review of scale-down ratio, and tested. The scaled-down bridge structure has an acceleration track section of 25 m and a deceleration track section of 25 m built, and the measurement section of the bridge is 30 m×2 spans depending on scale-down ratio, and if the bridge is 60 m long, it was scaled down to 1/50 at 600 mm×2 spans (1200 mm).
Bearings used in the scale-down model test are spherical steel type (stiff bearing) and spherical elastomeric type (elastomeric bearing), as shown in Table 8. The detailed description of how these bearings were applied is: they were created as a single unit of upper and lower plates with the base uneven, and they were designed and created in such a way that one could test variables individually depending on whether or not rubber sheets were applied to the uneven; and each post has two spherical bearings, and a total of six bearings for 2 spans were prepared and applied. Fig. 13 shows bearings installed between posts and the deck.
Fig. 13Scale-downed model
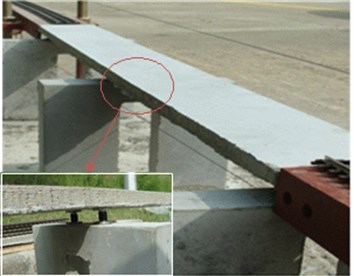
Table 8Application bearings
Classification | Rubber spec. | Hardness | |
Spherical bearing |  | Rubberless | – |
Spherical elastomeric bearing |  | Natural rubber | 55 |
4.3. Preparation and application of scaled-down bogies
Fig. 14 shows the full-scale specification of railway vehicles. The vehicles were scaled down to 1/50 of actual train model, and a head car and rail were provided.
The head car was designed to be driven by a separate speed controller, which was connected to vehicles by a steel wire of Ø1.0 mm. For accurate control, a connection control device was mounted on the outside of vehicles, as shown in Fig. 15. A total of 7 freight cars were added, and existing links given to the train can cause the risk of derail due to separation distance. Thus, a new connection device was made of MC nylon blocks, and then applied. To meet similitude rate load, the same weight was installed on each car.
Table 9 shows the similarity results of the scaled-down model in train velocity. Setpoint for the speed controller used in this study was established to be available for measurement at 70 km/h, the general running speed of freight train, and it implemented maximum 244.4 km/h at 1/50 scale.
Table 9Application velocity
1/50 | Controller scale velocity (m/sec) | Real scale velocity (km/h) |
1 Stage | 0.28 | 7.1 |
2 Stage | 1.30 | 33.1 |
3 Stage | 2.78 | 70.8 |
4 Stage | 5.56 | 141.5 |
5 Stage | 8.33 | 212.0 |
6 Stage | 9.6 | 244.4 |
Fig. 14Vehicle specification
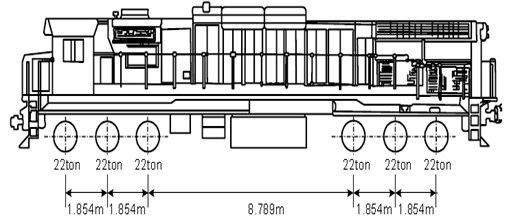
Fig. 15Condition of the installation
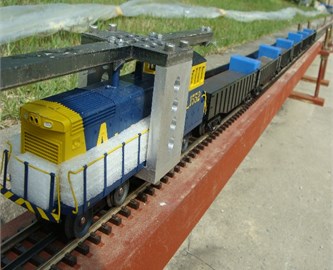
Fig. 16Vibration response measurement
4.4. Evaluation of vibration of bridge with bearings
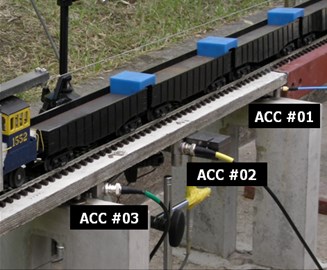
To find vibration and displacement of foundation structures depending on bearing types while the train runs on the scaled-down railway bridge model, vibration and displacement of the miniature bridge structure at various train speeds (7.1 km/h, 33.1 km/h, 70.8 km/h, 141.5 km/h, 212 km/h, and 244 km/h) were measured, as shown in Fig. 16. The measurement was performed using the three vibration sensors installed under the bridge.
An acceleration sensor was installed at the center of the bridge, and vibration acceleration was measured by material of bearings while the train ran, and the lue of the observed values was measured three times to display average value in a graph. Fig. 17 shows the results, in which acceleration values at the center of the bridge while the train ran are lower overall than those at the entry section. When the train ran at low or high speed as well, stiff bearings produced greater vibration overall than elastomeric bearings. In particular, at the entry section ACC #01 where the train enters the bridge, steel bearings produced great vibration, while at the exit section ACC#03, acceleration change occurred with speed change. It was observed that acceleration for stiff bearings increased compared to that for elastomeric bearings when the train ran at high speed.
Fig. 17Vibration velocity response according to train speed and bearings
a) ACC #01-Entrance
b) ACC #02-Center
c) ACC #03-Exit
4.5. Measurement of vibration damping by distance
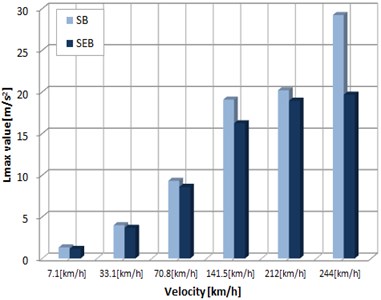
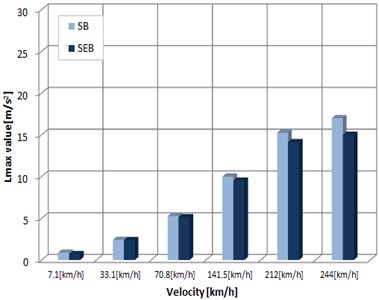
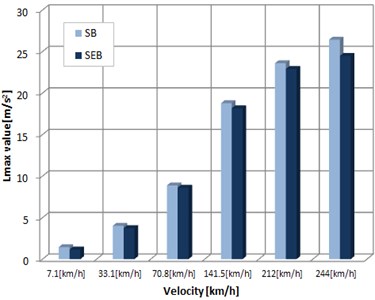
To confirm distance attenuation of vibration depending on bearing type when the train runs on the scaled-down railway bridge model, sensors were installed at specific intervals, as shown in Fig. 18, and vibration was measured by material of bearings and train speed. A total of 5 spots were selected for measurement, as shown in Fig. 18, and vibration was measured at 40 cm, 80 cm, 160 cm and 320 cm from the bridge respectively.
Fig. 18Sound attenuation in distance
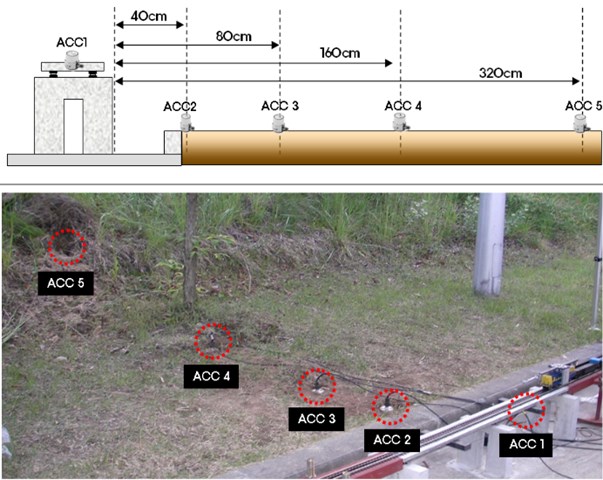
Fig. 19Vibration result according to speed and distance
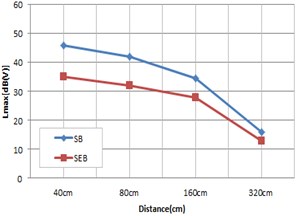
a) 7.1 km/h
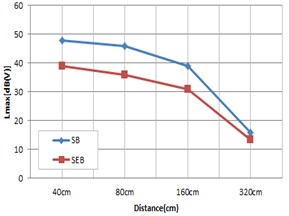
b) 33.1 km/h
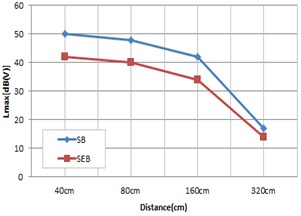
c) 70.8 km/h
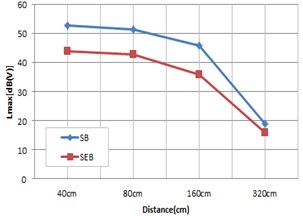
d) 141.5 km/h
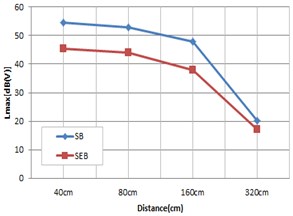
e) 212 km/h
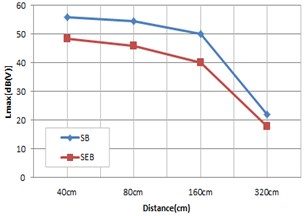
f) 244 km/h
The measurement of distance attenuation using the scaled-down railway bridge model showed the results in Fig. 19 depending on bearing type. According to the results, as the train approached the bridge, vibration increased overall, and steel bearings produced more vibration than elastomeric bearings in all sections. At a distance of 40 cm, elastomeric bearings reduced vibration by around 6 dB on average from that of stress bearings, but as the distance increases, the difference of vibration between bearing types decreased overall.
5. Conclusions
Existing spherical steel bearings produced a lot of noise and vibration while the train ran, and to improve this problem, spherical elastomeric bearings that could reduce vibration were developed. Thus, spherical elastomeric bearings were designed, and the accuracy of the design was verified using the finite element analysis. Then, compression and compression-rotation tests for spherical elastomeric bearings were performed to analyze their characteristics, the bearings were applied to 1/50 scaled-down bridges, and vibration reduction performance test was performed. The results are as follows:
1) A 500 kN capacity specimen of spherical elastomeric bearing was designed, finite element analysis was performed under the same boundary condition as the specimen using ANSYS ver. 12, and design and analysis values were compared to each other. It turned out that there were a design vertical displacement of 2.51 mm, and an analysis vertical displacement of 2.73 mm with an error of 0.22 mm, and compressive stress had an error of 2.93 MPa between design and analysis. Analysis values were larger than design values because of difference between the errors from finite element analysis modeling and the functional formula used when applying rubber, a viscoelastic material, to the analysis.
2) Compression and compression-rotation tests by material, shape factor and rotation angle of spherical elastomeric bearings showed that the higher the shear modulus and shape factor of applied rubber were, the higher the compressive stiffness was. In the meantime, the comparison of rotation angles showed that the stress induced by rotation was relatively low in stiffness compared to the compression test (0.0 rad), and there was no significant difference in stiffness change due to rotation angle change as the laminated bearing section had horizontal deformation (rotation and shear) with increased displacement.
3) Spherical steel bearings and spherical elastomeric bearings were applied to scaled-down bridges, and train vibration was measured by train speed. The measurement showed that in all of the entry, central and exit sections of the miniature bridge, spherical elastomeric bearings produced less vibration than spherical steel bearings. In particular, in entry section, spherical elastomeric bearings reduced vibration more greatly when the train ran at high speed than at low speed.
4) Spherical steel bearings and spherical elastomeric bearings were applied to scaled-down bridges, and vibration measurement was performed. For both, the further the distance from the scaled-down bridges became, the less the vibration was observed. In all speed sections and all distance sections, spherical steel bearings produced the greater vibration than spherical elastomeric bearings. Thus, if spherical elastomeric bearings are applied to railway bridges, vibration will be greatly reduced.
5) This study tested the vibration characteristics of spherical steel bearings and spherical elastomeric bearings for scaled-down bridges when the train ran, but as errors may occur when bridges and bearings are scaled down, vibration reduction performance should be verified more clearly performing vibration tests by temperature change and train speed for actual railway vehicles. Thus, this study will be expanded to actual railway vehicles to measure vibration by bearing, and the results will be published.
References
-
Kostli K. P., Jones C. J. C., Thompson D. J. Experimental and Theoretical Analysis of Railway Bridge Noise Reduction Using Resilient Rail Fasteners in Burgdorf, Switzerland. Noise and Vibration Mitigation for Rail Transportation Systems, Springer, Berlin, 2008.
-
Wang J. F., Lin C. C., Chen B. L. Vibration suppression for high-speed railway bridges using tuned mass dampers. International Journal of Solids and Structures, Vol. 40, 2003, p. 465-491.
-
Roeder C. W., Stanton J. F., Campbell T. I. Rotation of high load multirotational bridge bearings. Journal of Structural Engineering, Vol. 121, Issue 4, 1995, p. 747-756.
-
Stanton J .F., Roeder C. W., Mackenzie H. P., White C., Kuester C., Craig B. Rotation Limits for Elastomeric Bearings. NCHRP Report 596, Transportation Research Board, Seattle, WA, 2008.
-
Robinson W. H. Lead rubber hysteretic bearing suitable for predicting structures during earthquakes. International Journal of Earthquake Engineering and Structural Dynamics, Vol. 10, Issue 4, 1982.
-
International Standard Elastomeric seismic-protection isolators – Part 1: Test methods. ISO22762-1, 2010.
-
BSI. Structural Bearings – Part3: Elastomeric Bearings, BSEU 1337-3, 2005.
-
Jaschinski A., Chollet H., Iwnicki S., Wickens A., Wurzen J. V. The application of roller rig to railway vehicle dynamics. Vehicle System Dynamics, Vol. 31, 1999, p. 345-392.
-
Kim See-Dong A Study on Vibration Characteristics of Railway Bridge Using High Damping Spherical Elastomeric Bearing. Doctorate Thesis, University of Seoul, 2011.
-
Park Chang-Ho, Ku Bon-Sung The Effects on Structures caused by replacement of bridge bearing. Korea Institute for Structural Maintenance Inspection, Vol. 6, Issue 4, 2002, p. 209-217.
About this article

