Abstract
Modal parameter model acts as an analytical model of tire, because it can represent the entire tire characteristics, when applied to the tire modelling. However, without considering the effect of transfer characteristics of adjacent tread spring elements, the accuracy of modal parameter model may be limited in previous studies. Based on contact mechanics and the modal parameter model, a novel tread model is proposed considering tread transfer characteristics, and then a modified model using the modal parameters was obtained using the novel tread model. The effects of tire external characteristics were analyzed by modifying the modal parameter static vertical model. Finally, the experimental and calculated data were compared, the proposed tread model improved the accuracy of calculation. The results show that the tread transfer characteristics significantly affect contact length, i.e., by improving the predictive accuracy by 50 %, and the effect on improving the squat of tire can be ignored. The developed model may help to optimize tire modelling.
1. Introduction
In the recent years, with the development in vehicle technology, studies on vehicle dynamics modelling have attracted much attention, especially on tire modelling. As the tire is the only part that connects the vehicle with the road, tire modelling plays an important role in the overall vehicle dynamic modelling. Also, tread modelling significantly affects the modelling of tire. Since a tire is made up of rubber and several other materials, it is difficult to predict its damping and stiffness properties. The tread transfer characteristics will change when tires are compressed at different pressures. The modelling and properties of tires under different conditions have been studied. The tire modelling approaches under different conditions are classified into three types [1], i.e., empirical and semi-empirical, analytical and finite element models.
The studies on tire modelling are different, as the treads are not similar. First, the Magic Formula model is a typical empirical proposed by Pacejka [1, 2]. Uni-Tire model is a typical of semi-empirical model. A tire mechanical theory was proposed, and experiments were conducted by Guo Konghui [3, 4]. However, the effects of tread transfer characteristics on the adjacent tread spring elements were not considered adequately during the empirical and semi-empirical tire modelling studies. Second, since the accuracies of different analytical tire models are different, the simplified models are also different. The ‘Ring’ model was the typical analytical model, and its theory was proposed by Fromm [5, 6]. The ‘Beam’ model was also an analytical model, and its theory was proposed by Pacejka [1], Gong and Zegelaar [7]. In the studies on ‘Ring’ and ‘Beam’ models, the tread model comprising independent radial and tangential springs, considered the effect of damping. Third, the tire modelling method by using experimental modal parameters was developed by Guan Dihua [6, 8, 9]. The tread model was simplified into a parallel system composed of independent springs and dampers during the modelling. Based on the above analysis, the effects of coupling tread transfer characteristics on the adjacent tread spring elements have not been evaluated adequately.
However, in the studies of hydroplaning conditions, the tread transfer characteristics were considered in the modelling process. For instance, the effects of shape on the tread, road surface roughness and other conditions of the tire were studied by Zhang Yanhui [10], and the tread model under the hydroplaning conditions was obtained. Also, the Reynolds equation for the tire treads extrusion section and assumed smooth pavement were considered in the tread modelling by Wang Jizhong [11]. The contact stress distribution of the element develops a singularity at the edge, the shape factor and size of the element, and the frictional condition significantly affected the contact stress among the elements. William Blythe [12] proposed slippery road conditions for the weightlessness of the tread model, the tread pattern significantly affected this condition.
This paper evaluates the optimal tread model in improving the accuracy of tire modelling for vehicle dynamics. Three contributions are presented in this paper:
– An accurate tread model is proposed for tire modelling with experimental modal, in which Contact Mechanics was used for the modelling.
– The modified experimental modal parameters for the model were collected based on Contact Mechanics.
– An optimal tread model was simulated using the modified experimental modal parameter model. The proposed approach was validated using the experimental and calculated data.
This paper is organized as follows. In Section 2, the model of tread transfer characteristics is elucidated based on contact mechanics. In Section 3, the vertical modelling of tire is described by considering the algebraic model based on tread transfer characteristics. Section 4 provides a brief introduction model on tire modelling using experimental modal parameters. Section 5 shows the simulation results of steady response tests under different load conditions to validate the tire external characteristics of the proposed model. Finally, the conclusions from the study are stated in Section 6.
2. Tread transfer characteristics of tire
Based on Contact Mechanics, the elastic half space is defined, i.e., bounding the object to surface with a semi-infinite elastic body. Since the actual interest points show the contact interface, as long as the contact surface is larger than the size of the object, this area of the object is much less dependent when away from the contact area, and the corresponding stress is also not dependent on the specific way of supporting the object. As an idealized model, the rubber tread model is in good agreement with the actual performance.
Because the tire modelling with experimental modal parameters mainly studied on a one-dimensional linear load, the method of elastic half space linear concentrated loading was used to analyze the tread [13].
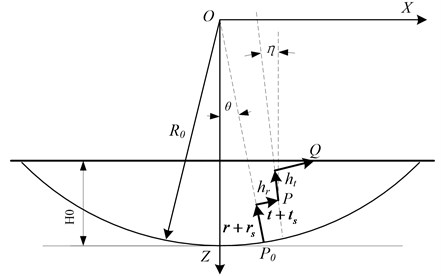
The -coordinate system was established as shown in Fig. 1. The origin of -coordinate system is , and the force is loaded at point . The -axis points are within the object.
Fig. 1Schematic diagram of concentrated force load
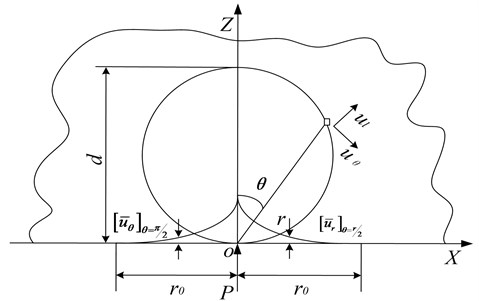
In Fig.1, is the vertical concentrated load, is the diameter of the circle through the origin of deformation, is the angle between the -axis and the origin of the deformation, and is the radius of the curvature at the formation of the -axis. is the distance of deformed center point from the vertical position. The deformations profiles and were generated under concentrated load.
The polar coordinate was used to solve stress and strain; stress function can be expressed as follows:
where is a constant.
The function of should be used in harmonic equation as follows:
Then, using Eq. (1), Eq. (2) can be rewritten as follows:
This system shows the distribution of radial stress point . At the surface, except for the original point, the normal stress and shearing stress are equal to zero, i.e., , .
Notably, the stress intensity is reduced by 1/ at ; the theory of infinite stresses shows the result of assumed load along a line concentration. Within a radius, the r should be equal to force , and can be a constant . Eq. (5) can be obtained as follows:
Then:
The following equations were derived using Hooke law, geometric equation and boundary conditions:
where is Poisson’s ratio, is the elastic modulus; , and are constants. The details are described in Ref. [14].
Because only the vertical force of the model is considered, constants , and are equal to zero. The surface deformation of the tire can be expressed as follows:
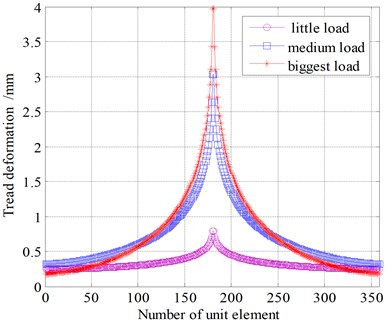
Based on the above analysis, Eq. (3) shows that the tread transfer characteristics exist during the loading. The deformation of tread occurs at the force functional point and the surrounding area of the load [14-17]. Also, the method applies to the modal parameters modelling; the tread deformation under different load conditions is shown in Fig. 2.
Fig. 2Tread deformations under different load conditions
Then, the radial stiffness and tangential stiffness of tread transfer characteristics were derived using the following equations:
3. Tire modelling using experimental modal parameters
Based on the elastic properties of different portions of tire under the load, in direct modelling using the model parameters the surface contact area can be divided into three parts, i.e., carcass, sidewall and tread. The carcass deformation is the main factor resulting in squat so that the tire shows overall flexibility. The modal parameters for the carcass deformation characteristics and their relationship to the force on the tire have been determined. The tread deformation is considered as approximately massless, and has only one order of elastic ground friction characteristics, i.e. the tread deformation is a line spring deformation in the process. The feature is not reflected in modelling using the modal parameters. The center of the wheel is also a key factor in the sidewall deformation. This is verified by the comparison test. Moreover, some modal parameters of the sidewall deformation can be characterized by a similar model transfer function, and this method is applied to the sidewall model [18]. The relationship between the force and deformation of tire can be induced through three parts. Therefore, the vertical characteristics of tire contact with the ground are used to analyze the transfer function with the experimental modal parameters model.
3.1. Analysis for fitting the shapes of tread model
Since the tire side characteristics are homogeneous during in modelling process, only grounding characteristics are considered in the longitudinal modelling. To obtain each order modal shapes, the modal shapes values are measured at equally spaced discrete points on the tread equator in the modal test process. However, any values of the circumferences with modal shape are used in tire modelling, so that the experimental data can be correlated.
However, the results of modal tests show that the tread modal shapes showed harmonic characteristics [13]. The trigonometric series represented by Eq. (13) and least square method were used to determine the undetermined coefficients for the fitting process:
where , , are unknown coefficients, and is the number of terms in the trigonometric series.
Eq. (13) contains number of unknown parameters, and number of parameters can be obtained through the test. Therefore, the equation () obeys the calculation process.
Then:
where ; ; ; .
The results of the tire modal test show trend, i.e., the modal shapes are always symmetric and simple harmonic. For most of the terms of specific order, the modal shape for the same direction of excitation and response should have a main parameter , and the modal shape for different direction of excitation and response should also have a main parameter [13, 19]. Different main parameters are decided by different shapes, i.e., are the dominant parameters for elliptical shape, are the main parameters for three flaps and so on [13].
3.1.1. Case 1: Elliptical modal shape
The numbers of 12 points in the modal shapes in the tread can be obtained from the test. According to Eq. (13), the numbers of 11 parameters are unknown in the trigonometric series with five terms, i.e., ... and .... For excitation in the radial direction and radial direction measure (R-R) test, the proposed fitting method for obtaining an elliptical modal shape is shown in Fig. 3 and Table 1.
Table 1 shows that is the absolute dominant.
3.1.2. Case 2: Three modal shapes
The R-R test, for the proposed fitting method to obtain three flaps in the modal shape is shown in Fig. 4 and Table 2.
Table 1Parameter fitting of elliptical modal shape
Fitting parameters | Value | Fitting parameters | Value |
0.000396 | – | – | |
0.0712 | 0.00517 | ||
0.554 | –0.0358 | ||
0.0108 | 0.0136 | ||
–0.0132 | –0.0381 | ||
0.00225 | 0.00223 |
Table 2Parameter fitting of three flaps modal shape
Fitting parameters | Value | Fitting parameters | Value |
0.0001763 | – | – | |
–0.00562 | –0.000432 | ||
0.00241 | 0.0123 | ||
0.5420 | –0.0332 | ||
0.0110 | 0.0112 | ||
0.00015 | 0.00280 |
Fig. 3Fitting for elliptical modal shape
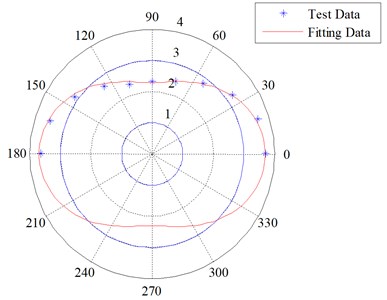
Fig. 4Fitting for three flaps in the modal shape
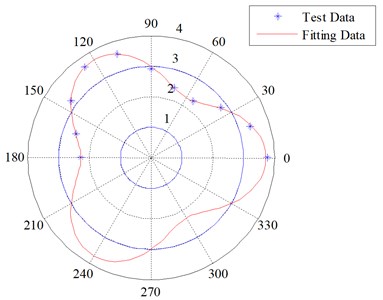
Table 2 shows that is the absolute dominant.
The test analysis explained above shows that for the modal shape of four or five flaps, and are the absolute dominants respectively. Therefore, the parameters of absolute dominant are considered to determine the modal shapes.
For the radial direction excitation and radial direction measure or tangential direction excitation and tangential direction measure, Eq. (13) can be modified and expressed as shown in Eq. (17):
Similarly, for the radial direction excitation and tangential direction measure or tangential direction excitation and radial direction measure, Eq. (13) can be expressed as Eq. (18):
3.2. Modification of model parameters in tire vertical modelling
Fig. 5 shows the surface of tire vertical plane, when it is placed parallel to the horizontal. The -coordinate system was established as shown in Fig. 5. Point is the center of the tire. The -coordinate coincides with the plane of the wheel, with the positive direction to the right. The -axis is vertical to the plane of the wheel, with the positive direction downwards. The unit vectors and are parallel to the -axis and -axis respectively. Notably, deformation does not occur at point . First, the point is transferred to the point through the deformation of carcass and sidewall of the tire, and point is transferred to point through the deformation of the tread. The distance shown in the figure is the squat of the tire. Then, the column vectors and represent the radial and tangential distortions of carcass of the tire. The column vectors and represent the radial and tangential deformations of the sidewall of the tire. The column vectors and represent the compression and shear deformations of the pattern of the tire. The tire freedom radius is represented by . The angle between imprinted units and center of contact length is . is the angle between carcass of the tire and vertical line of the carcass after the deformation [8, 13].
Forces and are the radial and tangential forces on the tread, respectively. Forces and are the radial and tangential forces on tire carcass, respectively. Moreover, the following assumptions were made:
(1) The directions of forces and were defined as positive in the upward direction, since forces and are less than zero in magnitude, the tread is away from the road surface;
(2) Forces and are defined as positive in the right direction;
(3) The angle of is defined positive in the counter clockwise direction.
Fig. 5Schematic diagram of tire contact with the road surface, deformation and stress
Vector at the deformed position can be expressed as follows:
The coordinates for shown below can be obtained from Fig. 3:
The deformation of tread can be obtained using the above equations. The equations for the compression and shear deformations of the tire pattern can be written as follows:
The deformations of the radial and tangential carcass of tire can be expressed as follows:
where is the entire flexibility matrix of carcass (m/N). The force vector of is the radial force on the carcass (N). The force vector is the tangential force on the carcass (N).
Further:
where is the Laplace operator, and is the conjugate pairs of . and are the correlation coefficients of modal shape fitting for and points, respectively.
The radial and tangential forces of and can be related to their respective deformations by considering tread transfer characteristics. The relationship can be expressed as follows:
where, is the radial stiffness of the tread elements (N/m2). is the tangential stiffness of the tread elements (N/m2). The process was calculated using Eq. (11) and (12).
A coordinate transformation can be obtained. Eq. (25) shows the relationship between longitudinal /vertical () force and tangential/radial () force:
The force of carcass radial and tangential can be expressed using Eq. (26):
Before the convergence of vertical and longitudinal forces is determined, the adhesion force and vertical slip force should be determined. Because the tread element works only under pressure, the positive direction of contact force was set as up. When , this element is separated from the ground and should not be considered. To determine slip force , is assumed as the friction coefficient between the tread and ground. When , this element is slip and the longitudinal force can be expressed as ; Otherwise, the value of the longitudinal force of this element is constant. Thus, the useful values of the vertical and longitudinal forces can be obtained. Thus, the convergence of the contact force should be determined. The convergence condition of the vertical and longitudinal forces can be expressed as follows:
where is the convergence precision; generally, it is less than or equal to 1 N.
If the calculation results of the vertical and longitudinal forces do not meet the accuracy at the current step, they are used as the initial states for the next step of the same calculation until the errors satisfy the accuracy requirements. Based on the above analysis, combined with convergence conditions, the relationships between vertical load within radial force density distribution, vertical force and squat, vertical force and contact length of the tires under different conditions can be derived. The modal parameters mentioned in this section will be obtained in Section 4.
3.3. Block diagram of the simulation model
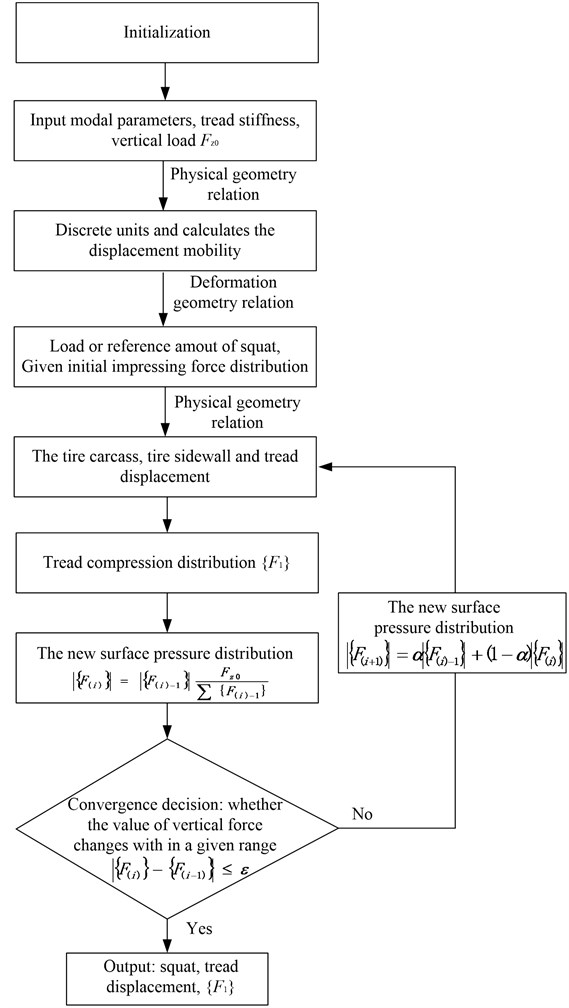
After obtaining the physical parameters of the tires by theoretical calculations, a model for the calculation program was constructed. Then, the initial and constraint conditions, such as the iteration approximation of the actual working conditions, and the final output were specified, as shown in Fig. 6.
Fig. 6Block diagram of the simulation model
4. Test and analysis of tire
The involved tests are introduced in this section. First, the procedure for extracting the modal parameters with free-free boundary are shown in Section 4.1. A higher accuracy of modal parameters was obtained, and they provide the basic parameters for tire modeling using the experimental modal parameters. Second, the validated test of the proposed modified vertical model was implemented as shown in Section 4.2. The details are described below.
4.1. Experimental for extracting modal parameters
4.1.1. Tire suspension mode
During the tire modelling using experimental modal parameters, the modal parameters at the tire free-free boundary reflect the essential characteristics of tire. It can be used directly in the modelling of tires [6, 8, 9]. Fig. 7 shows the mode of the tire with free-free boundary in suspension using a rope. The length of the rope was one meter, and the horizontal swing frequency of the tire (rigid body) was 0.5 Hz. The frequency in the horizontal direction is far lower than the first-step frequency of the tire. Therefore, the tire can be approximated to be in free suspension state.
Fig. 7Free-Free boundary condition of tire
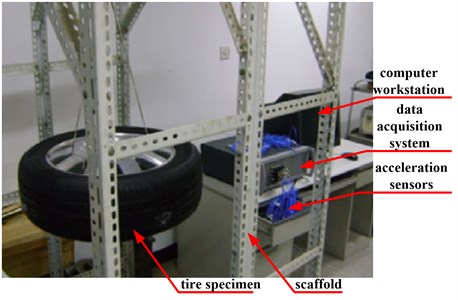
Fig. 8Schematic diagram for showing the test points
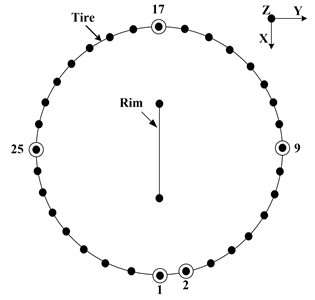
4.1.2. Test points
Experimental modal analysis is performed on the tire of type 205/55R16 under free-free boundary conditions. Fig. 8 shows that the circumference of the tire was divided into equal parts by 32 points. Due to rotational symmetry, the tire was excited in radial and tangential directions by an impact hammer at point 1, and the responses are captured at points 1-17. The radial and tangential responses were measured using tri-axial accelerometers, which are glued to the tire circumference.
4.1.3. Experimental results
The method of PloyMAX, which is also known as the multi-reference point least squares complex frequency domain method, was used to determine the modal parameters of the tire using the LMS Test Lab software. The PloyMAX method has a higher identification accuracy particularly in a seriously overlapped nodal system and highly damped system [6, 13].
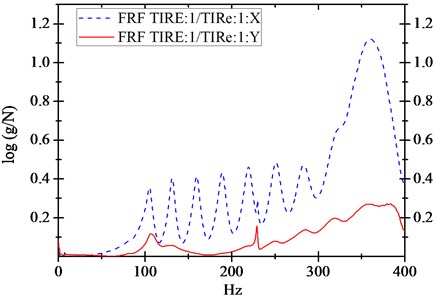
The graphs for the origin of radial and tangential coherence functions are shown in Fig. 9, and the graphs for origin of radial and tangential frequency response functions (FRF) are shown in Fig. 10. Figs. 9 and 10 show that a higher accuracy of tire modal parameters was obtained in the exciting test.
Fig. 9The origin of radial and tangential direction coherence functions
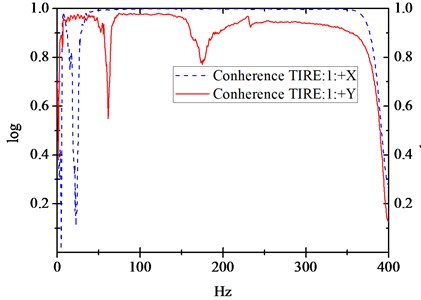
Fig. 10The origin of radial and tangential direction frequency response functions
The model validation module is an important part of an LMS Test Lab software. The module can evaluate the modal authenticity and determine the quality of modal parameter using an Auto-MAC matrix. The judgment principles of matrix showed the changes in diagonal value in the other elements outside. The lower change in the value indicated that the two modals have better orthogonality, and vice versa [20].
Table 3Auto-mac matrix for tire radial excitation
Modal frequency (Hz) | Mode No. | Mode 1 | Mode 2 | Mode 3 | Mode 4 | Mode 5 | Mode 6 | Mode 7 | Mode 8 |
105.942 | Mode1 | 83.385 | 0.444 | 1.065 | 0.324 | 11.639 | 3.837 | 0.447 | 11.071 |
131.672 | Mode 2 | 0.392 | 94.347 | 0.615 | 0.139 | 0.308 | 0.551 | 0.355 | 0.186 |
160.279 | Mode 3 | 0.476 | 1.386 | 87.28 | 0.013 | 0.799 | 1.662 | 0.1 | 0.637 |
188.485 | Mode 4 | 0.398 | 0.056 | 0.076 | 90.555 | 1.154 | 0.343 | 1.217 | 0.091 |
219.258 | Mode 5 | 6.188 | 0.643 | 0.003 | 0.305 | 60.791 | 9.572 | 1.824 | 11.786 |
229.751 | Mode 6 | 0.715 | 0.521 | 0.266 | 0.048 | 1.752 | 82.871 | 7.458 | 7.055 |
251.961 | Mode 7 | 0.776 | 2.028 | 0.225 | 0.013 | 0.236 | 50.77 | 62.176 | 1.841 |
286.024 | Mode 8 | 0.748 | 0.851 | 0.206 | 0.538 | 1.282 | 1.535 | 9.572 | 70.217 |
Table 4Auto-mac matrix for tire tangential excitation
Modal frequency (Hz) | Mode No. | Mode 1 | Mode 2 | Mode 3 | Mode 4 | Mode 5 | Mode 6 |
105.629 | Mode 1 | 87.395 | 0.34 | 1.16 | 12.284 | 0.027 | 4.281 |
109.604 | Mode 2 | 0.6 | 95.064 | 0.856 | 8.966 | 0.826 | 0.701 |
220.247 | Mode 3 | 0.633 | 1.349 | 88.186 | 11.179 | 2.17 | 1.962 |
230.315 | Mode 4 | 0.738 | 0.06 | 0.124 | 67.525 | 8.548 | 0.436 |
251.961 | Mode 5 | 0.261 | 0.443 | 0.246 | 14.521 | 67.245 | 10.562 |
286.987 | Mode 6 | 1.038 | 0.754 | 0.25 | 11.074 | 24.066 | 84.132 |
Table 3 shows the Auto-MAC matrixes of radial excitation, and the orthogonal modal is very good, and proved that the selected modals have a higher confidence. Also, the Auto-MAC matrixes of tangential excitation are shown in Table 4.
The results of the extracted modal parameters in the radial direction are shown in Table 5. Also, the results of the extracted modal parameters in tangential direction are shown in Table 6. The details are described in Ref. [6].
Table 5Radial modal parameters
Mode No. | Modal frequency (Hz) | Modal damping (%) | Mode shapes |
1 | 105.942 | 2.73 | ellipses |
2 | 131.672 | 2.48 | Three flaps |
3 | 160.279 | 2.21 | Four flaps |
4 | 188.485 | 1.27 | Five flaps |
5 | 219.258 | 2.26 | Six flaps |
6 | 229.751 | 0.18 | Slippage |
7 | 251.961 | 2.63 | Seven flaps |
8 | 286.024 | 2.67 | Eight flaps |
Table 6Tangential modal parameters
Mode No. | Modal frequency (Hz) | Modal damping (%) | Mode shapes |
1 | 105.629 | 2.41 | ellipses |
2 | 109.604 | 3.82 | Slippage |
3 | 220.247 | 2.47 | Six flaps |
4 | 230.315 | 0.23 | Slippage |
5 | 251.961 | 2.64 | Seven flaps |
6 | 286.987 | 3.02 | Eight flaps |
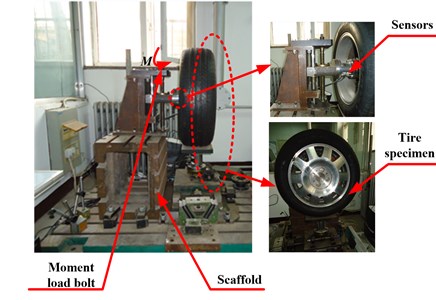
4.2. Experimental for the determination of external characteristics with static vertical situation
During the experiments to determine the external characteristics, the external characteristics showed a close relationship with the vehicle performance, especially for ride comfort and road handing. Fig. 11 shows the static external characteristics of the test rig of the tire. The squat, tread displacement and vertical force can be calculated using some sensors under the load moment working situation. The experimental data are shown in Table 7.
Table 7Test data of tire external characteristics
Load force (N) | Squat (mm) | Tread contact length (mm) | Vertical force distribution (shape) | Remarks |
2000 | 9 | 66 | Parabola | Tire press: 35psi; Normal temperature: 20 ºC |
4704 | 20.5 | 129 | Trapezoid | |
5880 | 25.2 | 145 | Saddle |
5. Simulation and test results
When a tire is subjected to static loads, its convex tread arc and large sidewall deformation lead to maximum stress distribution on the central rib [21-24]. Since the tread is a rubber extrusion, longitudinal and transverse stresses in the tire are generated in the contact area.
The external characteristics of tire model were calculated using the experimental modal parameters. The transfer characteristics of tire tread were also considered with improved or without improved tread. Notably, some experimental data were taken from Ref. [19, 24].
The vertical tire force distribution within the impressions’ and vertical load density were calculated, and the results are shown in Fig. 12. The graphs are consistent with the experimental results. Therefore, the lower level load can be approximated as a parabola. Fig. 12 shows that the central portion of impressions is larger, and the lowest point of tire carcass is the center of impressions. The middle level load has a wide flat area. The areas can be approximated as a trapezoid. The larger load may be approximated as a saddle shape [15, 21].
Fig. 11Tire test rig for the determination of external characteristics
The distribution curves of the tangential force are shown in Fig. 13. Moreover, the tangential forces corresponded to the vertical force. Fig. 13 shows that the curves have a sinusoidal shape [6, 10]. The values of tangential force are far less than the vertical force, and the improved accuracy of tire modeling is not clear under this condition.
Fig. 12Graphs showing imprinted vertical load within radial force density distribution
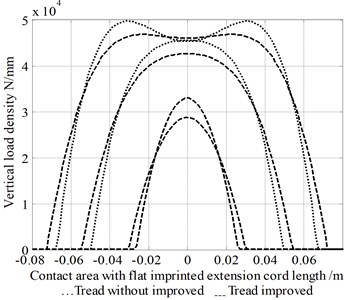
Fig. 13Graphs showing imprinted vertical load within shear force distribution
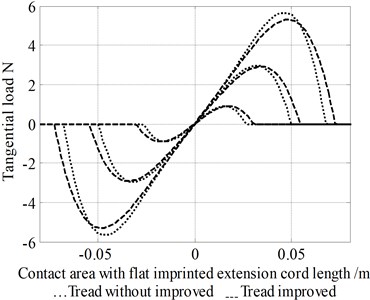
During the qualitative analysis, the results of Fig. 12 and 13 show that the distributions of imprinting and tangential forces are in good agreement with experimental data. With the increase in the force, the error values of tread with and without improvement are more and more obvious. It also shows that it is important to consider the tread transform characteristics.
Fig. 14 shows that the graph of vertical load corresponds to a squat. The effect of the tread model on the squat under the vertical load is small, but some improvements may be possible for a squat with tread modelling. Further, the effect on improving the squat of tire can be ignored as shown in Fig.14.
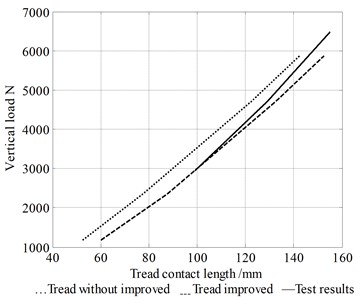
The graphical relationship between vertical force and contact length is shown in Fig. 15. Fig. 15 shows that the tread modelling significantly affected the contact length with regard to the vertical force load, and the improvement in the contact length corresponds to the test data. The results also show that the tread transfer characteristics of adjacent tread spring elements should be considered in the modeling process.
A Comparison of the obtained data with and without improved condition shows that contact length can be improved by a predictive accuracy of over 50 %. Then, the properties of the tire can be validated, i.e. the tread is the main reason for the change occurring with contact length, and carcass deformation is the main reason for the change occurring with squat. Hence, the proposed method is significantly better than the without considered tread transfer characteristics.
Fig. 14Graphs between vertical load and squat
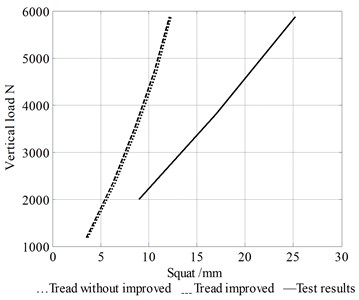
Fig. 15Graphs between vertical load and contact length
6. Conclusions
A new tread model was achieved based on contact mechanics and tire modelling using an experimental modal. The main conclusions of this study are as follows:
1) A novel tread model using contact mechanics was proposed to further improve the external tire characteristics accuracy of computational model with static vertical model. It can be extensively applied to the rolling and cornering conditions for tire modeling using the experimental modal parameters.
2) The proposed modified static vertical model using the experimental modal parameters was validated using the test rig information; this will provide a reference for the calculation model and other condition test, i.e. the tire rolling and cornering.
3) Compared to the previous study, the simulation and experimental results show that the tread transfer characteristics significantly affected the contact length, i.e., improved the predictive accuracy by over 50 %, and the effect on the squat of the tire can be ignored. The results indicate that the proposed method’s good performance in the accuracy is likely to find wide application in the subsequent tire modeling process.
In the future, another test will be considered with the proposed novel tread model for tire roll and cornering properties modeling and used to validate the proposed model using an actual vehicle dynamic simulation and apply to the actual vehicle.
References
-
Pacejka H. B. Tyre and Vehicle Dynamics. Butterworth-Heinemann, Oxford, 2002.
-
Pacejka H. B., Bakker E. The magic formula tyre model. Vehicle System Dynamics, Vol. 21, Issue 1, 1993, p. 1-18, https://doi.org/10.1080/00423119208969994.
-
Guo K. H., Lu D. UniTire: unified tire model for vehicle dynamic simulation. Vehicle System Dynamics, Vol. 45, Issue 1, 2007, p. 77-99, https://doi.org/10.1080/00423110701816742.
-
Bai F., Guo K. H., Lu D. Tire model for turn slip properties. SAE 2013 Commercial Vehicle Engineering Congress, Vol. 6, Issue 2, 2013, p. 353-361, https://doi.org/10.4271/2013-01-2371
-
Fromm H. Kurzer Bericht ÜBer Die Geschichte der Theorie des Radflatterns. Bericht 140 der Lilienthal Gesellschaft, NACA TM 1365, 1954.
-
Wang Z. F. Research on Key Issues of Tire Modeling by Using Experimental Modal Parameters. Yanshan University, Qinghuangdao, 2012.
-
Zegelaar P. The Dynamic Tyre Response to Brake Torque Variations and Road Unevennesses. Delft University of Technology, Netherlands, 1998.
-
Guan D. H., Wu W. D., Zhang A. Q. Tire modeling for vertical properties by using experimental modal parameters. SAE 1998 International Congress and Exposition, 1998, https://doi.org/10.4271/980252.
-
Guan D. H., Shang J., Yam L. H. Establishment of model for tire steady state cornering properties using experimental modal parameters. Vehicle System Dynamics, Vol. 34, Issue 1, 2000, p. 43-56.
-
Zhang Y. H. The Research on the Effects of Tire Tread Pattern on Adhesion on Wet Road and Rolling Performance of Tire. Hefei University of Technology, Anhui, 2007.
-
Zhang Wang J. D. J. Z. Analysis for the effect of tread element on tyre viscous hydroplaning performance. Transactions of the Chinese Society of Agricultual Engineering, Vol. 15, Issue 3, 1999, p. 60-64.
-
William B., Terry T. D. Single vehicle wet road loss of control: effects of tire tread depth and placement. SAE 2002 World Congress and Exhibition, 2002, https://doi.org/10.4271/2002-01-0553.
-
Wu W. D. Tire Experiment Modal Analysis and Building Tire Model by Using Experiential Modal Parameters. Tsing Hua University, Beijing, 1996.
-
Xu B. Y., Luo X. F., Liu W. S. Contact Mechanics. Higher Education Press, Beijing, 1992.
-
Hans R. D., Robert L. W., Brian B. K. Vibration modes of radial tires: application to non-rolling and rolling events. SAE 2005 Noise and Vibration Conference and Exhibition, 2009, https://doi.org/10.4271/ 2005-01-2526.
-
Matsuoka H. Discretized standing-wave tyre model. SAE 2009 World Congress and Exhibition, 2009, https://doi.org/10.4271/2009-01-0066.
-
Tandy D., Coleman C., Ray R., et al. An objective analysis of the effect of tire tread depth on crash causation and wet road vehicle dynamics. SAE 2013 World Congress and Exhibition, 2013, https://doi.org/10.4271/2013-01-0701.
-
Fu Z. F., Hua H. X. Modal Analysis Theory and Application. Publishing House of Shanghai Jiao Tong University, Shanghai, 2002.
-
Dang Z. L. Quantitative Research on Tire Model of Cornering Properties Using Experimental Modal Parameters. Tsing Hua University, Beijing, 2006.
-
http://www.plm.automation.siemens.com/en_us/products/lms/testing/index.shtml, 2014.
-
Zhao H. C., Wang G. L., Ding Y. M., et al. Effect of friction model and tire maneuvering on tire-pavement contact stress. Advances in Material Science and Engineering, 2015, p. 632-647, https://doi.org/10.1155/2015/632647.
-
Qin Y. C., Zhao F., Wang Z. F., et al. Comprehensive analysis influence of controllable damper time delay on semi-active suspension control strategies. Journal of Vibration and Acoustics, https://doi.org/10.1115/1.4035700.
-
Zhao F., Ge S. S., Tu F. W., et al. Adaptive neural network control for active suspension system with actuator saturation. IET Control Theory and Application, Vol. 10, Issue 14, 2016, p. 1696-1705.
-
Wang Z. F., Dong M. M., Qin Y. C., et al. Suspension system state estimation using adaptive Kalman filtering based on road classification. Vehicle System Dynamics, Vol. 55, Issue 3, 2016, p. 371-398, https://doi.org/10.1080/00423114.2016.1267374.
Cited by
About this article

The authors declare that there is no conflict of interests regarding the publication of this paper.
