Abstract
This paper firstly used the finite element method to study the impact of air coupling on the structural radiation noise of thin plates and conducted a comparative analysis on the vibration noise of thin plates in the water and air. Results showed that coupling effect and medium property had an obvious influence on the radiation noise of thin plates, and these factors must be considered. Secondly, this paper proposed laminated plates based on the single-layered thin plate. The related experiment of laminated plates was conducted and compared with the computational result to verify its reliability. As an important parameter of laminated plates, laying angle can change the structural stiffness of laminated plates and mechanical properties. Therefore, based on the verified computation model, this paper studied the radiation noise of laminated plates through changing the laying angle of laminated plates, improved the vibration noise of laminated plates through applying control forces. As a result, a laminated plate with the optimal performance can be obtained. Finally, laminated composite plates were applied to the inner surface of panels which had made greater acoustic contributions to high-speed trains and controlled the vibration noise of high-speed trains through applying control forces. Results showed that the peak noise of high-speed trains was obviously improved at multiple frequencies and total sound power levels reduced by 23.1 dB.
1. Introduction
As a kind of new-type materials with high stiffness and strength, laminated composite plates have been widely used in industrial fields including aerospace, nuke industry and automobiles at present. An important indicator of evaluating the dynamic performance of laminated composite plates is the amplitude of structural radiation noises. In recent years, more and more studies have been conducted on the acoustic characteristics of laminated composite plates. For instance, the sound radiation power of structures in fluid media based on a first-order shear deformation theory was studied [1, 2]. The influence of laying angle on the transmission loss of laminated composite plates was studied [3]. However, the above studies mostly analyzed the structural vibration characteristics of laminated plates based on classical theories, first-order theories [4] and high-order theories. However, classical theories solved problems easily and neglected transverse shear. The transverse stress of first-order theories presented a linear distribution along the direction of plate thickness, and it was inconsistent with the actual situation. With many unknowns, high-order theories needed to introduce shear factor and found it difficult to solve problems [5-8].
Nguyen-Van [9] has computed the vibration characteristics of laminated plates using flat shell elements, analyzed the impact of laminated plates shape and width-to-thickness ratio on vibration characteristics, compared the computational result with the reported result and showed the effectiveness of flat shell elements in computing the vibration characteristics of laminated plates. Niu [10] obtained the structure with minimum radiation sound power through optimizing the materials of laminated plates instead of solving Hertz equation to compute and optimize the radiation sound power of laminated plates. Shen [11] predicted the radiation sound energy of anisotropic stiffened laminated plates under the excitation of structure and air coupling, whose reliability of the computational result was verified by theories. However, the above studies were only confined to laminated plates instead of applying the structure to the actual engineering.
This paper firstly used finite element method to study the impact of air coupling on the structural radiation noise of thin plates and conducted a comparative analysis on the vibration noise of thin plates in media including water and air. Results showed that coupling effect and medium property had an obvious influence on the radiation noise of thin plates, and these factors must be considered. Secondly, this paper proposed laminated plate based on the single-layered thin plate. As an important parameter of laminated plates, laying angle can change the structural stiffness of laminated plates and mechanical properties. Therefore, this paper studied the radiation noise of laminated plates through changing the laying angle of laminated plates, improved the vibration noise of laminated plates through applying control forces. As a result, a laminated plate with the optimal performance can be obtained. Finally, it was applied to high-speed trains to realize its engineering value.
2. Numerical simulation of vibroacoustic characteristics of thin plates with considering coupling effect and medium property
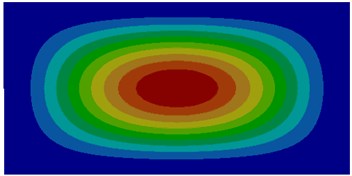
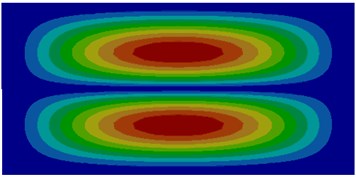
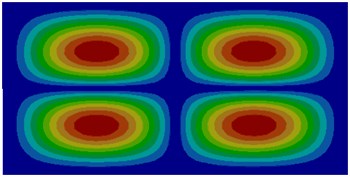
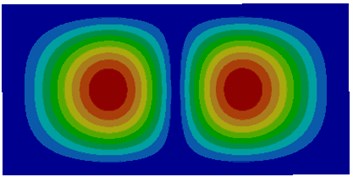
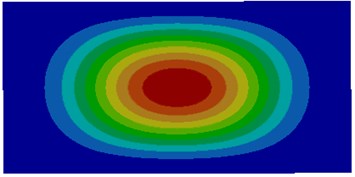
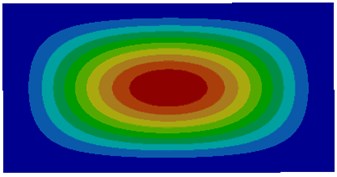
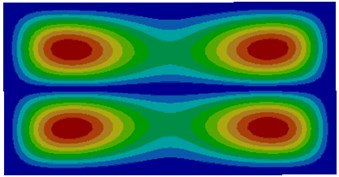
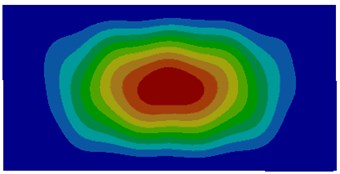
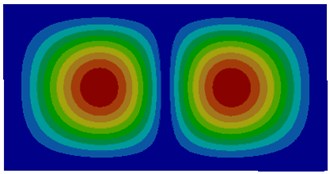
The thin plate studied in this paper was 100 mm long, 40 mm wide and 2 mm thick. Thickness was far less than width and length. Therefore, a quadrilateral shell element could be used to divide meshes. The size of meshes was 0.5 mm. Finally, the finite element model contained 16,000 quadrilateral elements. The thin plate was made of steel. Elasticity modulus was 2.1e11N/m2; shear modulus was 8.1e10N/m2; density was 7860 kg/m3; Poisson’s ratio was 0.3. The edge of the thin plate was fixed to compute vibroacoustic characteristics. Thin plate was usually the foundation of a complex structure, whose boundary condition was generally clamped. Air density was 1.21 kg/m3; water density was 1000 kg/m3; sound velocity in the air was 343 m/s; sound velocity in the water was 1500 m/s; the damping coefficient of thin plate was 0.002. The thin plate was supposed to bear a concentrated load which was perpendicular to the thin plate surface in the center point, and the amplitude was 1 N. 6 degrees of freedom of four sides of the thin plate were fixed. Firstly, vibration modes of the top six orders of the thin plate were computed without considering coupling effect, as shown in Fig. 1. Then, vibration modes of the thin plate in the air and water respectively to compute its vibration modes of the top six orders, as shown in Fig. 2 and Fig. 3.
The comparison between Fig. 1 and Fig. 2 displayed the impact of coupling effect on the vibration characteristics of thin plates. The first order mode in a non-coupling status was exactly consistent with the fifth order mode in a coupling status and similar to the second order mode in a coupling status. Modes in a non-coupling status extended from the center to various directions more seriously. Similarly, the second order, fifth order and sixth order modes in a non-coupling status were similar to the first order, third order and fourth order modes in a coupling status. However, the third order and fourth order modes in a non-coupling status were not presented in a coupling status.
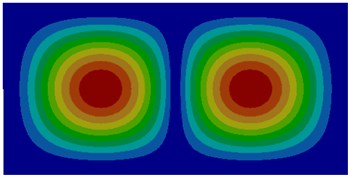
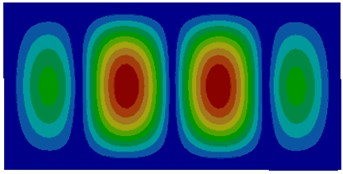
The comparison between Fig. 2 and Fig. 3 showed the impact of coupling medium on the vibration characteristics of thin plates. The first-order mode of air coupling was exactly consistent with the second order mode of water coupling. However, the second order mode of air coupling was similar to the first order mode of water coupling in the center and an obvious difference was shown around the thin plate. It could be seen from the comparison among modes of other several orders that modes of air coupling were consistency with those of water coupling near the center of thin plates and an obvious difference was shown around thin plates. It was because the resistance of water was larger and its coupling effect was less obvious than that of air.
Fig. 1Modes of thin plates without considering coupling effect
a) First order
b) Second order
c) Third order
d) Fourth order
e) Fifth order
f) Sixth order
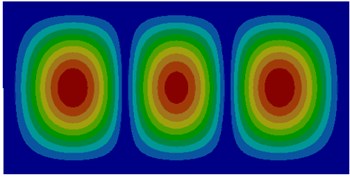
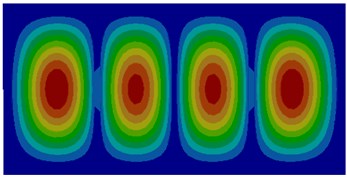
Fig. 2Modes of thin plates coupled with air
a) First order
b) Second order
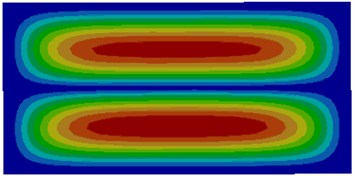
c) Third order
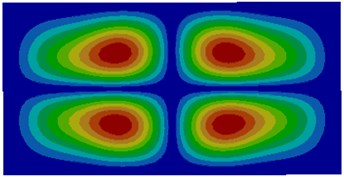
d) Fourth order
e) Fifth order
f) Sixth order
Fig. 3Modes of thin plates coupled with water
a) First order
b) Second order
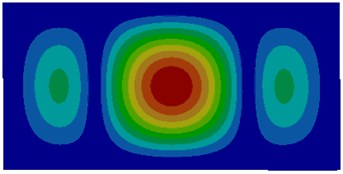
c) Third order
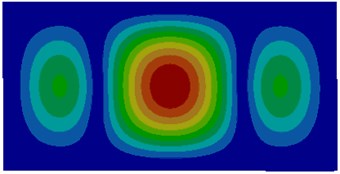
d) Fourth order
e) Fifth order
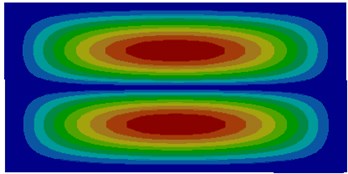
f) Sixth order
In Chapter 4, the sound powers of the high speed train were only computed by boundary element methods, and boundary element model had 20698 elements. The corresponding computation frequency was 2000 Hz. If the computational frequency was higher, the boundary element model will include many more elements. The computational time will be increased and the computational efficiency will be reduced. Additionally, if the computational frequency was higher, the boundary element method may be invalid, and Statistical Energy Analysis (SEA) must be adopted. Based on the mentioned analysis, the vibration velocity and radiation efficiency of thin plates were only computed within 2000 Hz.
Fig. 4Comparison of vibroacoustic characteristics of thin plates in the air and water
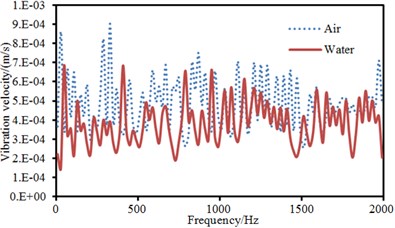
a) Vibration velocity
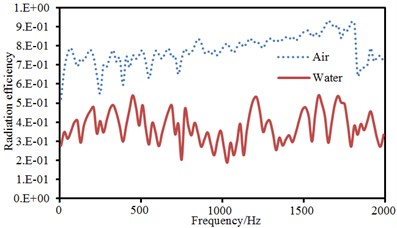
b) Radiation efficiency
Vibration velocities in the center point of the plate and sound radiation efficiencies in different coupling medium were extracted to make a comparison, as shown in Fig. 4. As displayed from Fig. 4. The vibration velocity of thin plate surface under water coupling was less than that under air coupling near non-resonant frequencies. In addition, it could be noticed that the resonance frequency of thin plates was decreased in the water. The radiation efficiency of thin plates was less than that in the air. Water density is greater than air density and sound velocity in the water is four times than that in the air. The radiation efficiency of thin plates in the water was far less than that in the air. However, the radiation sound power of thin plates in the water would be higher than that in the air at non-resonant frequencies.
3. Vibroacoustic characteristics of laminated composite plates
Single-layer thin plates rather than laminated composite plates were studied in the above. In the actual engineering, laminated composite plates are widely used. Based on the above computation and results, coupling effect must be considered in the case of computing the vibroacoustic characteristics of laminated plates. Otherwise, the computational result will have a large error.
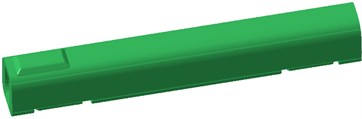
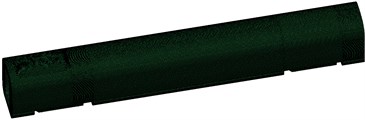
Laminated composite plates usually focus on one-way and symmetric laying. For the convenience of easy processing, laying angles were 0°, 30°, 45° and 90°, as shown in Fig. 5. A three-layered laminated composite plate was taken as an example and boundary condition was clamped. Under central and non-central excitations, the influence of the laminated plate with one-way laying at 0°, 30°, 45° and 90° on the sound radiation modes and sound powers of the top two orders was discussed.
Fig. 5Laminated plate with different laying angles
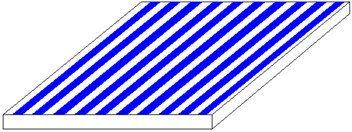
a) 0°
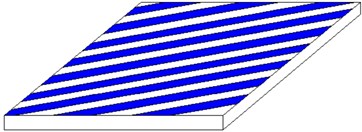
b) 30°
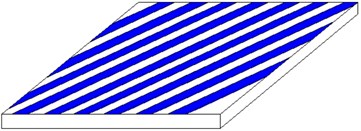
c) 45°
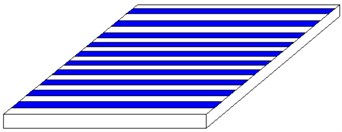
d) 90°
3.1. Experiments of laminated composite plates
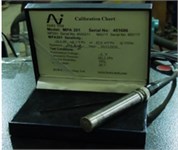
As shown in Fig. 6, the laminated composite plate was fixed and constrained. One actuator and two actuators were respectively pasted above the laminated composite plate to apply the active control force. As shown in Fig. 6(a), an actuator was pasted at the center of the laminated composite plate to simulate the single-point excitation working condition at the central position. As shown in Fig. 6(b), one actuator was pasted at a non-central position of the laminated composite plate to simulate the single-point excitation working condition at the non-central position. As shown in Fig. 6(c), two actuators were pasted at symmetric positions of the laminated composite plate to simulate the working condition of the centrally symmetric two-point excitation. As shown in Fig. 6(d), two actuators were pasted at asymmetric positions of the laminated composite plate to simulate the working condition of non-central symmetric excitation. In each experimental working condition, the laying angle of fibers was 30°. Sound radiation power under each working condition was tested to verify the reliability of numerical simulation results, and the experimental instruments are shown in Fig. 6(e), Fig. 6(f), Fig. 6(g) and Fig. 6(h). The actuator was connected into a power amplifier to apply the control force. Microphone was located above the thin plate to test the sound power. Then, microphone was connected into the data acquisition instrument to obtain the original sound signals. The tested signals were input into a computed to be processed. Finally, the sound power radiated from the thin plate can be obtained.
Fig. 6Experiments under different working conditions
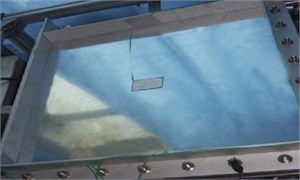
a) Central point excitation
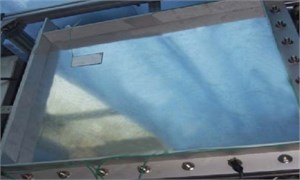
b) Non-central point excitation
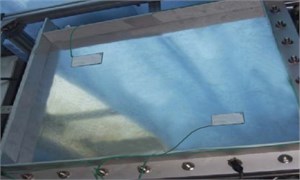
c) Two-point symmetric excitation
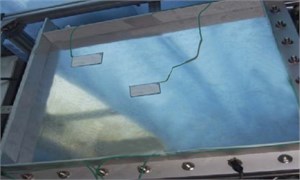
d) Two-point asymmetric excitation

e) Actuator
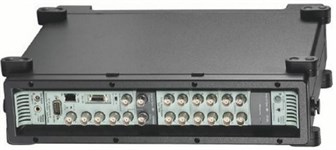
f) Data acquisition instrument
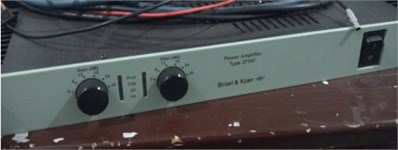
g) Power amplifier
h) Microphone
3.2. Vibroacoustic characteristics of laminated plates under single-point excitation
The radiation sound pressure from the structural vibration of the thin plate under harmonic excitation forces was which met Helmhotz differential equation, Neumann boundary condition and Sommerfeld radiation condition, as follows:
where in, was the density of air, was wave number, was the circular frequency of the excitation, was the propagation speed of sound in the air, was the distance between the structural surface node and any field point of sound field. Sound pressure in the space was as follows:
where in, was sound pressure of the node of the structural surface, was the vibration velocity in the normal direction. Therefore, sound pressure of the node of the structural surface can be computed when the vibration velocity in the normal direction was obtained. As a result, the sound radiation power can be obtained as follows:
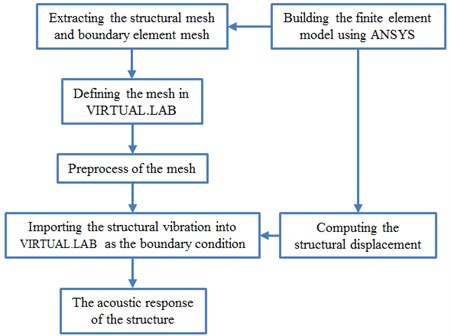
In this paper, the numerical simulation was mainly realized by combining ANSYS with VIRTUAL.LAB. The simulation model can be built rapidly using APDL language program in ANSYS, and the structural vibration displacement response can be then obtained. The structural mesh and surface mesh extracted from ANSYS were imported into VIRTUAL.LAB, respectively, and they were taken as structural mesh and acoustic mesh. The node displacement computed by ANSYS was taken as the boundary condition of acoustic analysis. As a result, the boundary element method was adopted to conduct acoustic simulation, and the specific process was shown in Fig. 7.
Fig. 7The specific process of the numerical simulation
3.2.1. Single-point excitation in the central position
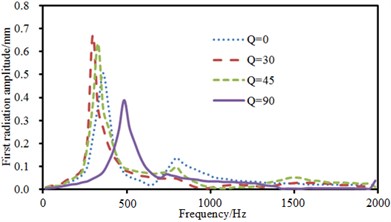
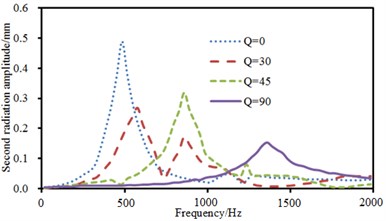
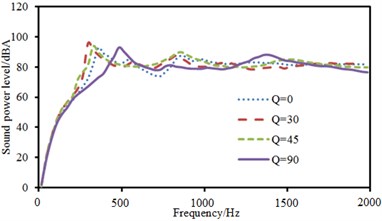
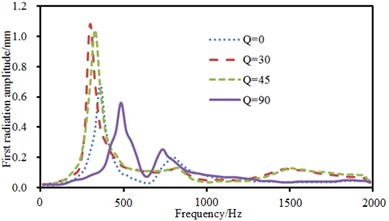
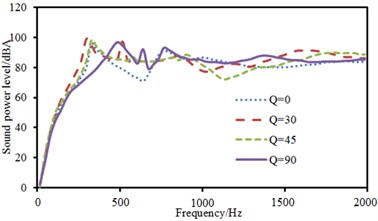
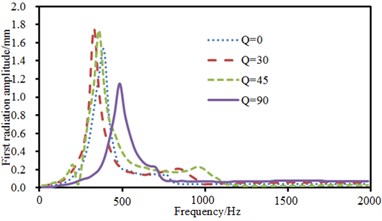
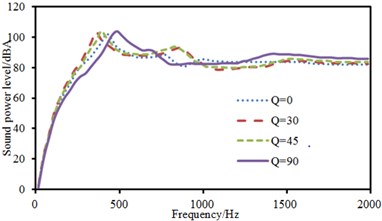
The experimental data can be obtained using the equipment in Fig. 6(a), and compared with the computational result, as shown in Fig. 8. It can be seen from Fig. 8 that the consistency between experimental and computation values was good, and the computational model and result were reliable. Fig. 9 showed the sound radiation modes and sound powers of the top two orders of laminated composite plate under the action of single-point force in the central position. As displayed from the figure, the amplitude of sound radiation modes of the first order was far greater than that of the second order under the central excitation. From Fig. 9(a), it could be seen that the change regulation of sound radiation modes was basically similar and only peak frequencies of sound radiation modes were different when the laying angle was 0°, 30° and 45°. However, when laying angle was 90°, the change regulation of sound radiation modes was obviously different from that at other angles. In addition, peak values of sound radiation modes were less than that at other angles. However, peak frequencies of sound radiation modes increased to a certain degree. When the analyzed frequency was more than 1000 Hz, sound radiation modes of all laying angles were very similar in change regulation and close to 0. From Fig. 9(b), it could be found that the change regulation of sound radiation mode was basically similar and only peak frequencies of sound radiation modes were different to some extent when laying angle was 30° and 45°. However, sound radiation modes had two obvious peak values in the whole analyzed frequency band when laying angle was 0°. Besides, the peak value of sound radiation modes was obviously greater than that at other angles. When laying angle was 90°, sound radiation modes were like a horizontal line in the whole frequency band and only had a non-obvious peak value near 750 Hz. However, sound radiation modes of all angles changed uniformly and gradually tended to be a horizontal line and only peak frequencies of sound radiation mode were different when the analyzed frequency was 1000 Hz. As can be seen from Fig. 9(c), the peak frequency of sound radiation power was exactly corresponding to that of sound radiation modes, which also indicated that the sound radiation power of structures was caused by the vibration of structures.
Fig. 8Comparison of sound power between experimental and computational values
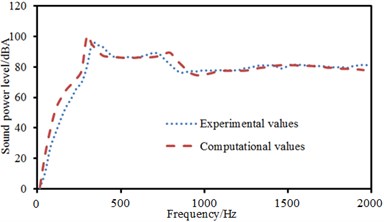
Fig. 9Sound radiation modes and powers of the top two orders under the central excitation
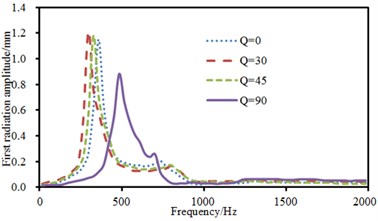
a) Sound radiation modes of the first order
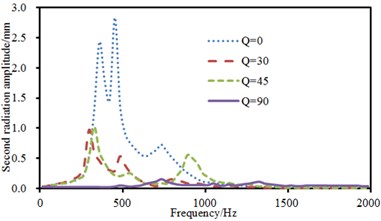
b) Sound radiation modes of the second order
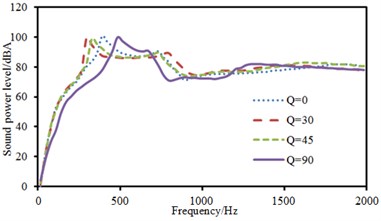
c) Radiation sound power
3.2.2. Single-point excitation in non-central positions
The experimental data can be obtained using the equipment in Fig. 6(b), and compared with the computational result, as shown in Fig. 10. It can be seen from Fig. 10 that the consistency between experimental and computation values was good, and the computational model and result were reliable. Fig. 11 showed the sound radiation modes and powers of the top two orders of composite laminated plate under the action of single-point exciting force in non-central positions. Laying angles including 0°, 30° and 45° had not a big influence on the sound radiation mode of the first order. Moreover, peak values and peak frequencies were close. However, laying angles including 0°, 30° and 45° had a big influence on the sound radiation mode of the second order. In the whole analyzed frequency band, sound radiation modes did not show a status of a horizontal line which was close to 0. The sound radiation mode was the largest when laying angle was 0° and peak values were twice that at laying angle 30° and 45°. In addition, sound radiation modes had two obvious peak values when laying angle was 30°. Comparatively speaking, there was a large difference in sound radiation power and peak frequency moved backward when laying angle was 90°. The comparison between Fig. 9 and Fig. 11 showed that the sound radiation modes of the first two orders under non-central excitation were obviously less than those under central excitation.
Fig. 10Comparison of sound power between experimental and computational values
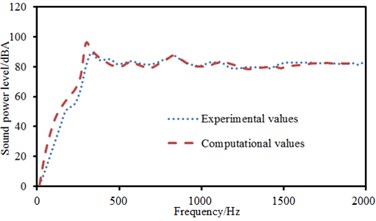
Fig. 11Sound radiation modes and powers of the top two orders under non-central excitation
a) Sound radiation modes of the first order
b) Sound radiation modes of the second order
c) Radiation sound power
3.3. Vibroacoustic characteristics of laminated plates under two-point excitations
3.3.1. Two-point excitations in a symmetric position
Only single-point force was applied to the laminated plate in the above. The above model was also adopted. Exciting forces of two points were symmetrical about the central position. The positions of excitation points were (0.25, 0.25) and (0.75, 0.75). stood for the width of laminated plates and represented the length of laminated plates. Sound radiation modes and sound powers of one-way laying and anti-symmetric laying were computed. The experimental data can be obtained using the equipment in Fig. 6(c), and compared with the computational result, as shown in Fig. 12. It can be seen from Fig. 12 that the consistency between experimental and computation values was good, and the computational model and result were reliable.
Fig. 13 showed sound radiation modes and sound powers of one-way laying at different angles. When laying angle was 0°, 30° and 45°, sound radiation modes and sound power kept a consistent change. However, sound radiation modes and sound power showed an obvious difference when laying angle was 90°. There were two obvious peak values on the curve of sound radiation modes and peak value was obviously less than that at other laying angles. In the same way, sound radiation power also had many obvious peak values and peak frequency was corresponding to sound radiation modes.
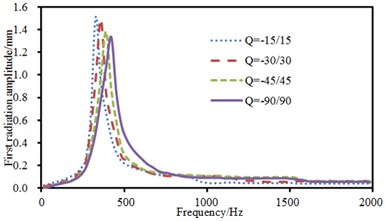
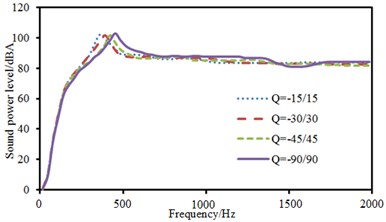
Fig. 14 showed sound radiation modes and sound powers of anti-symmetric laying at different angles. Sound radiation modes and sound power basically kept a consistent change trend at various angles and only peak values were obviously different. In addition, sound radiation mode had an obvious peak value near 1000 Hz when laying angle was –15°/15°. The corresponding sound radiation power also had an obvious peak value at this frequency.
Fig. 12Comparison of sound power between experimental and computational values
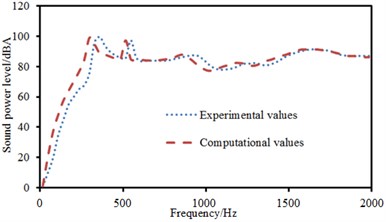
Fig. 13Sound radiation modes and sound power of one-way laying
a) Sound radiation modes of the first order
b) Radiation sound power
Fig. 14Sound radiation modes and power of anti-symmetric laying
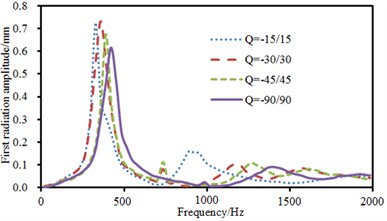
a) Sound radiation modes of the first order
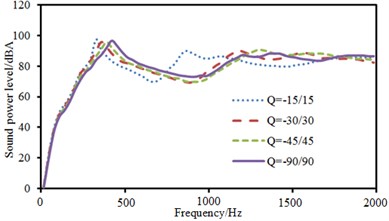
b) Radiation sound power
3.3.2. Two-point excitations in an asymmetric position
The above model was also adopted. Two-point excitations were in an asymmetric position. Positions of excitation points were (0.25, 0.25) and (0.5, 0.5). The experimental data can be obtained using the equipment in Fig. 6(d), and compared with the computational result, as shown in Fig. 15. It can be seen from Fig. 15 that the consistency between experimental and computation values was good, and the computational model and result were reliable. Then, sound radiation modes and sound powers of one-way laying and anti-symmetric laying at various angles were computed, as shown in Fig. 16 and Fig. 17. When laying angle was 0°, 30° and 45°, sound radiation modes and sound power kept a consistent change trend and peak values were close. However, sound radiation modes and sound power showed an obvious difference and peak frequency moved backward when laying angle was 90°. Moreover, the peak value of sound radiation modes was obviously less than that at other angles. However, the peak value of sound power kept consistent.
Fig. 17 presented sound radiation modes and sound powers of anti-symmetric laying at different angles. Sound radiation modes and sound power kept a consistent change trend at various laying angles and only peak values were obviously different. Furthermore, sound radiation modes and sound power basically kept unchanged and presented a horizontal line when the analyzed frequency was more than 1000 Hz.
Fig. 15Comparison of sound power between experimental and computational values
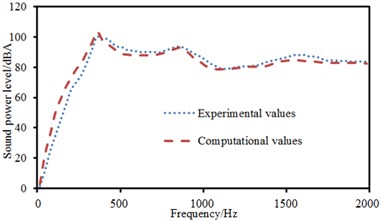
Fig. 16Sound radiation modes and sound power of one-way laying
a) Sound radiation modes of the first order
b) Radiation sound power
Fig. 17Sound radiation modes and sound power of anti-symmetric laying
a) Sound radiation mode of the first order
b) Radiation sound power
4. Application of laminated composite plates in high-speed trains
Single-layer plates and laminated composite plates were systemically studied above. Coupling effect must be considered when the vibroacoustic characteristics of plates were computed. In addition, vibroacoustic characteristics were obviously different at the position of different excitation points for laminated composite plates. The body of high-speed trains was made of aluminum profiles and laminated composite plates. Therefore, the above structure would be applied to high-speed trains and control forces were also applied to observe its engineering value.
Firstly, the paper researched main panels of high-speed trains, where the panels only had an aluminum profile structure, and laminated composite plates were not applied. A geometric model of high-speed trains was shown in Fig. 18(a). Based on the geometric model, a fluid mesh model of high-speed trains was obtained, as shown in Fig. 18(b). The fluid mesh model contained 2043982 elements. Computational boundary conditions were as follows: a velocity of 250 km/h was applied at the entrance; the exit was set as the pressure boundary condition; a slippage wall face was adopted on the top; the bottom was a fixed wall face. Finally, FLUENT software was used to compute surface pressure distribution of the high-speed train, as shown in Fig. 19. It was shown in the figure that the surface pressure was relatively high in the front of high-speed trains due to existence of a flange structure.
Fig. 18Geometric model and fluid mesh model of high-speed trains
a) Geometric model of high-speed trains
b) Fluid mesh model of high-speed trains
Fig. 19Surface pressure distribution without laminated composite plate and control force
a) Surface pressure distribution of high-speed trains at 0.1 s
b) Surface pressure distribution of high-speed trains at 0.5 s
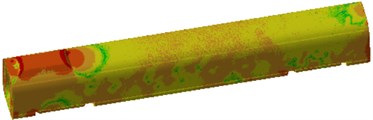
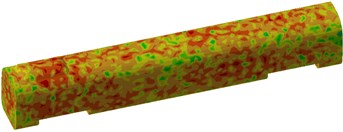
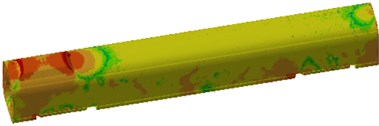
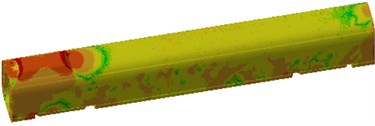
The external surface of high-speed trains was extracted to establish a boundary element model, as shown in Fig. 20. The boundary element model consisted of quadrilateral shell element, and there were 20698 elements and 24763 nodes. Boundary element model was coupled with the fluid model to obtain the computational model of vibroacoustic characteristics. Surface noise distribution of the high-speed trains at 100 Hz and 1000 Hz was extracted, as shown in Fig. 21. It was shown in Fig. 21 that the surface noise distribution of high-speed trains was relatively chaotic under the fluid effects and did not show obvious regulation. At the frequency of 1000 Hz, the surface noise of high-speed trains obviously exceeded 100 Hz. The reason was that noises of fluid excitation were mainly distributed at high frequencies, while mechanical excitation played a dominant role at mid-low frequencies. With the increase of the analyzed frequency, the surface noise of the high-speed train was increased.
The high speed train was divided into some panels, as shown in Table 1. Meanwhile, the panel contribution of sound radiation power at the peak frequency was extracted, and the result was shown in Fig. 22. It was shown in Fig. 22 that panels including panel 7, 11, 13, 14, 16, 17, 18, 19 and 20 made dominant contributions to surface noises of high-speed train bodies. Therefore, these panels were covered by laminated composite plates, and the control force in the chapter 3 was applied in these panels. Surface pressure distribution of the high-speed trains was recomputed, as shown in Fig. 23. By comparing Fig. 19 and Fig. 23, we can find that surface pressure distribution could be effectively improved by covering a laminated composite plate and applying control force on the high-speed train surface.
Fig. 20Boundary element model of high-speed trains
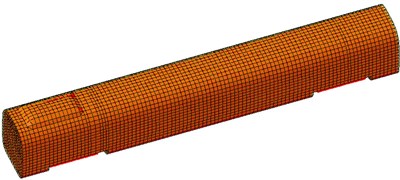
Fig. 21Surface noise distribution of high-speed trains at different frequencies
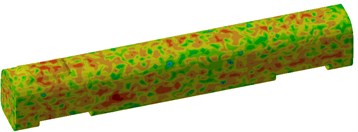
a) Surface noise distribution of high-speed trains at 100 Hz
b) Surface noise distribution of high-speed trains at 1000 Hz
Fig. 22Panel acoustic contribution of high-speed trains
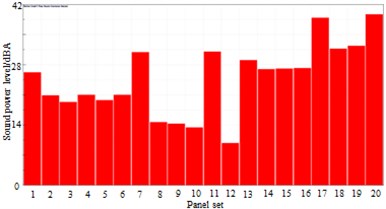
a) 250 Hz
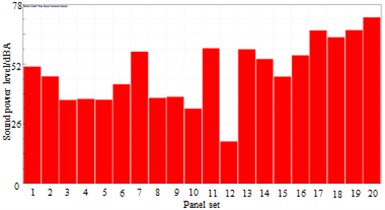
b) 689 Hz
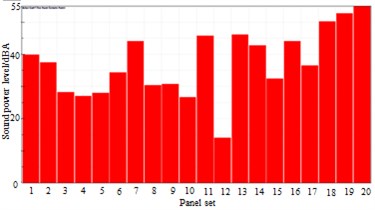
c) 936 Hz
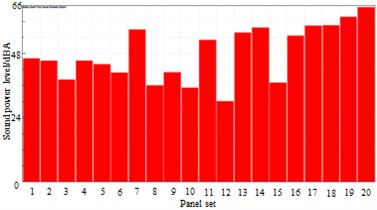
d) 1114 Hz
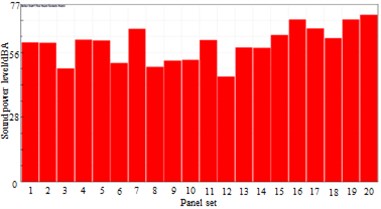
e) 1500 Hz
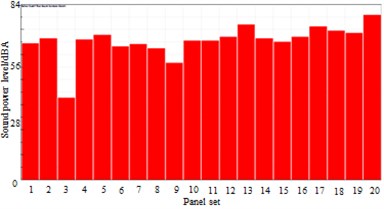
f) 1801 Hz
Table 1The location of the whole panels of the high speed train
Panel set | Location | Panel set | Location |
1 | Front-side panel at the right side | 11 | Front end panel |
2 | Middle-side panel at the right side | 12 | Window panel at both sides |
3 | Rear-side panel at the right side | 13 | Rear end panel |
4 | Front-side panel at the left side | 14 | Front-side panel at the floor |
5 | Middle-side panel at the left side | 15 | Middle-side panel at the floor |
6 | Rear-side panel at the left side | 16 | Rear-side panel at the floor |
7 | Shroud panel at the top | 17 | Front wheel panel at the floor |
8 | Front-side panel at the top | 18 | Rear wheel panel at the floor |
9 | Middle-side panel at the top | 19 | Front connect panel at the floor |
10 | Rear-side panel at the top | 20 | Rear connection panel at the floor |
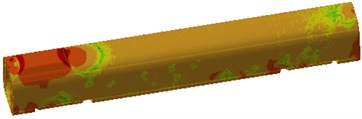
It was also feasible to use boundary element method to compute surface noise distribution of the high-speed trains with applying laminated composite plates and control force, as shown in Fig. 24. By comparing Fig. 21 and Fig. 24, we can find that at the same frequency points, the surface noise of high-speed trains could be effectively improved by covering laminated composite plates and applying control force. The surface noise of the high speed train was only serious on the end face and wheels.
Fig. 23Surface pressure distribution with applying laminated composite plate and control force
a) Surface pressure distribution of high-speed trains at 0.1 s
b) Surface pressure distribution of high-speed trains at 0.5 s
Fig. 24Surface noise distribution of high-speed trains at different frequencies
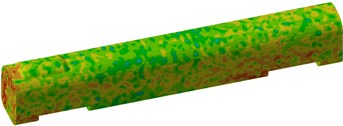
a) Surface noise distribution of high-speed trains at 100 Hz
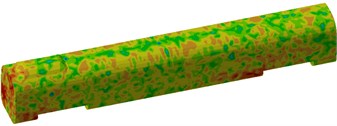
b) Surface noise distribution of high-speed trains at 1000 Hz
Fig. 25Sound powers of high-speed trains before and after applying laminated plates
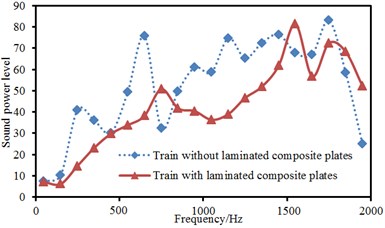
Sound radiation powers of high-speed trains were compared before and after applying laminated composite plates and control forces, as shown in Fig. 25. Results showed that noises at the peak value were obviously improved and total sound power level decreased by 23.1 dB. The initial design using the numerical simulation can reduce the exploitation time and cost, and it will need much time using measurement repeatedly.
If the computational boundary condition was considered comprehensively, the computational result will be more reliable. In the paper, only flow noises were studied, and it cannot be studied accurately using experiments because the wind tunnel will use a 1/8 scale model, not a real model. If the road test was conducted, the tested noise will include flow noises and mechanical noises, so using the numerical simulation method in this paper was very necessary.
5. Conclusions
1) Thin plates must consider coupling effect when the vibroacoustic characteristics were computed. The mode of thin plates coupled with air kept consistency with that coupled with water, but an obviously, difference was shown around the thin plate. Vibration velocities near non-resonant frequencies in the water were less than that in the air. The resonance frequency of thin plates was also reduced in the water. The radiation efficiency of thin plates in the water was less than that in the air.
2) When the single-point excitation was in the central position, laying angles including 0°, 30° and 45° had not a big influence on the sound radiation mode of the first order and peak values was close. However, laying angle 0° had an obvious influence on the sound radiation mode of the second order. Laying angle 90° had a big influence on the sound radiation modes of the first and second orders. When single-point excitation was in the non-central position, laying angles including 0°, 30° and 45° had not exert a big influence on the sound radiation mode of the first order, but had a great influence on the sound radiation mode of the second order.
3) When excitation points were symmetric about the center, there was a big difference in the sound radiation mode of the first order at different laying angles, and different one-way laying angles and anti-symmetric laying angles also had a great influence on radiation sound power. The difference value of radiation sound powers could reach 18 dB. When excitation points were asymmetric, there was a large change in the peak value of sound radiation mode of the first order. Different one-way laying angles had a small influence on sound power and different anti-symmetric laying angles had a slight effect on sound power.
4) Laminated composite plates were applied to panels which had made greater acoustic contributions to high-speed trains and control forces were also applied to the body of high-speed trains. Sound radiation powers of high-speed trains were compared before and after applying laminated composite plates. Results showed that noises at the peak value were obviously improved and average sound power level decreased by 22 dB.
References
-
Yin X. W., Liu L. J., Hua H. X. Acoustic radiation from a laminated composite plate reinforced by doubly periodic parallel stiffeners. Journal of Sound and Vibration, Vol. 306, Issues 3-5, 2007, p. 877-889.
-
Li S., Zhao D. Y. Numerical simulation of active control of structural vibration and acoustic radiation of a fluid-loaded laminated plated. Journal of Sound and Vibration, Vol. 272, Issues 1-2, 2004, p. 109-124.
-
Li S., Zhao D. Y. Influence of stacking geometry on sound transmission through laminated composite plates. Journal of Vibration and Shocks, Vol. 20, Issue 2, 2011, p. 86-88.
-
Cao X., Hua H., Zhang Z. Sound radiation from shear deformable stiffened laminated plates. Journal of Sound and Vibration, Vol. 330, Issue 16, 2011, p. 4047-4063.
-
Mantari J. L., Oktem A. S., Soares C. G. Static and dynamic analysis of laminated composite and sandwich plates and shells by using a new higher-order shear deformation theory. Composite structures, Vol. 94, Issue 1, 2011, p. 37-49.
-
Reddy J. N. Mechanics of Laminated Composite Plate: Theory and Analysis. CRC Press, New York, 1997.
-
Honda S., Narita Y. Natural frequencies and vibration modes of laminated composite plates reinforced with arbitrary curvlinear fiber shape paths. Journal of Sound and Vibration, Vol. 331, Issues 1-2, 2012, p. 180-191.
-
Bhar A., Phoenix S. S., Satsangi S. K. Finite element analysis of laminated composite stiffened plates using FSDT and HSDT: A comparative perspective. Composite Structures, Vol. 92, Issue 2, 2010, p. 312-321.
-
Nguyen Van H., Mai Duy N., Karunasena W., et al. Buckling and vibration analysis of laminated composite plate/shell structures via a smoothed quadrilateral flat shell element with in-plane rotations. Computers and Structures, Vol. 89, Issue 7, 2011, p. 612-625.
-
Niu B., Olhoff N., Lund E., et al. Discrete material optimization of vibrating laminated composite plates for minimum sound radiation. International Journal of Solids and Structures, Vol. 47, Issue 16, 2010, p. 2097-2114.
-
Shen C., Xin F. X., Cheng L., et al. Sound radiation of orthogonally stiffened laminated composite plates under airborne and structure borne excitations. Composites Science and Technology, Vol. 84, 2013, p. 51-57.
Cited by
About this article

