Abstract
Considering the asymmetric structure of a rolling mill system, a chatter model is established by coupling a rolling process model and structure model to describe the asymmetric vibration characteristics. According to this mathematical model, the critical rolling speed is determined by calculating eigenvalues of the characteristic matrix. Model correctness and validity are confirmed by an experimental observation of a 2030 cold rolling mill. On this basis, the effects of asymmetric structure parameters on the rolling mill stability are investigated with the help of the numerical approach. It is found that the influence of the asymmetric structure parameters on stability and critical conditions is significant. An optimal stiffness ratio and optimal mass ratio is determined, in order to ensure the best stability for the considered system. As the asymmetry in terms of the stiffness and mass becomes considerable, a modal conversion phenomenon occurs. This study serves as a contribution both for the mill vibration suppressing, and for mill optimization design.
1. Introduction
The modern rolling industry has been improving the product quality, and the technical requirements of high accuracy and high dynamic performance have been making the issue of rolling mill vibration more prominent. Rolling mill system instability seriously affects the product quality, reduces the product accuracy, restricts the rolling speed improvement, and even causes serious damage to the rolling mill equipment.
In recent years, scholars have done a lot of researches on rolling mill vibration. Based on the symmetry assumptions that the mill system is symmetrical along the strip center, Huyue Zhao and Peihua Huet al. [1-4] established structural models of mill vibration and analyzed the influence of the mill process and structure parameters on the system stability. By summarizing a large number of literatures, Zhiying Gao [5] pointed out the necessity of the asymmetry consideration for the rolling mill system and indicated that the asymmetric structure parameters and process parameters had a non-negligible impact on the chatter problem and material deformation. Considering the asymmetric structure of mill system, Jiaxiang Zou and Kim et al. [6-8] established rolling mill vibration models and analyzed the effects of process parameters on the critical speed of mill system. The asymmetry of the rolling speed and the friction coefficient of upper part and lower part were considered and the influence of asymmetry on the rolling pressure, rolling torque and rolling deformation zone were analyzed by Huang Y. M. and Yong Zang et al. [9-13], but the researches were based on the static state. Swiatoniowski [14] discussed the dynamics phenomenon which was caused by various asymmetric factors during the process of rolling plastic deformation. Jafari [15] studied the influence of the upper and lower rolls speeds asymmetry on the rolling force, rolling torque and rolling mill vibration behavior.
To summarize the above, some chatter models are based on the symmetry assumption that the mill system is symmetrical along the strip center. So, they just take half of the system into account. However, these chatter models can only study the modal which the upper rolls and lower rolls vibrate in the reverse direction, resulting in the deletion of the modal which the upper rolls and lower rolls vibrate in the same direction, what leads to the misjudgment about mill vibration induction mechanism. Some models consider the asymmetric structure, but they just study the effect of some parameters on the stability of the mill system. Overall, the influence of upper and lower structural parameters asymmetry on the stability of the rolling mill system has not been studied enough in the existing researches.
Based on the asymmetric structural parameters which include mill stiffness, mass and damping, this paper establishes a rolling mill vibration model to study influences of the asymmetrical structural parameters on the stability of the rolling mill system after the model correctness and validity has been verified. Furthermore, the paper analyzes the relationship between the instability types and structure asymmetry level. The research may be helpful to suppress the mill vibration and provide a guidance for dynamic system structure modifications and mill optimization design.
2. Vibration model with asymmetric structure parameters
2.1. Structure model and modal analysis
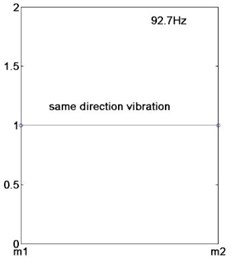
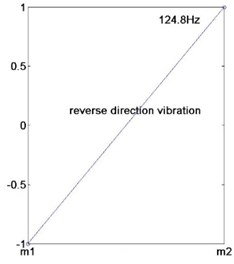
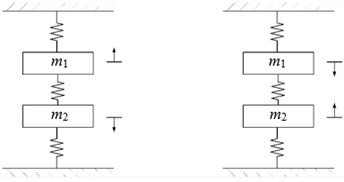
For a typical four-high mill, in order to facilitate the analysis, the upper-system and sub-system are simplified as ones with a single degree of freedom respectively. It is assumed that the mill vibrates up and down along the vertical direction. The asymmetric structure model of rolling mill is illustrated in Fig. 1.
Fig. 1Simplified asymmetric structure model
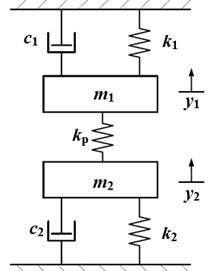
This paper establishes an asymmetric model by extending the vertical model from literature [4]. The asymmetric model which considers the difference of structure parameters between the system upper and lower parts can be used to study the asymmetric vibration phenomenon and the influence of asymmetric parameters on the system stability. As shown in Fig. 1, is the lumped equivalent mass of the top roll, top backup roll and upper mill housing, which is simplified to the center of the top work roll. is the lumped equivalent mass of the bottom roll, bottom backup roll and lower mill housing, which is simplified to the center of the bottom work roll. , are the vertical equivalent stiffness and vertical damping due to support from the upper frame and the upper beam of the rolling mill. , are the vertical equivalent stiffness and vertical damping due to the support from lower frame and the lower beam of the rolling mill. is the equivalent stiffness of strip deformation during vibration. , are displacements of the vertical vibration from upper rolls and lower rolls respectively. is the variation of rolling force.
This paper uses the structural parameters from literature [4] to analyze the natural frequencies and mode shapes of the system. The selected structural parameters are shown in Table 1, the natural frequencies and mode shapes of the system are shown in Table 2.
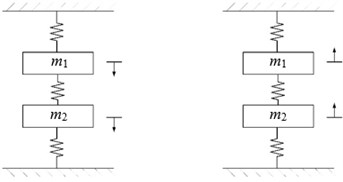
It can be seen from Fig. 2, the upper and lower rolls system vibrates in the same direction at the first-order natural frequency, which is called the same direction vibration modal. The upper and lower rolls system vibrates in the reverse direction at the second-order natural frequency, which is called the reverse direction vibration modal. The reference [4] can only demonstrate a study of the reverse direction modal for the symmetric assumption. As compared with the reference [4], the asymmetric model can be used to study either the reverse direction vibration mode of the system, or the same direction vibration mode of the system, avoiding the loss of the vibration mode. This model is the basis for studying the effect of asymmetric parameters on the rolling mill stability.
Table 1Parameters of mill structure, strip material
/ (kg) | / (kg) | / (N.m-1) | / (N.m-1) | / (N.s.m-1) |
203200 | 203200 | 6.9×10¹⁰ | 6.9×10¹⁰ | 1.64×10⁷ |
/ (N.s.m-1) | / (GPa) | / (MPa) | ||
1.64×10⁷ | 210 | 0.3 | 810 | 0.04 |
/ (m) | / (m) | / (mm) | / (m) | / (N.m-1) |
4.75 | 4.75 | 2 | 0.3 | 2.8×10¹⁰ |
Table 2System natural frequencies and mode shapes
First order | Second order | |
Natural frequencies (Hz) | 92.7 | 124.8 |
Mode shapes | 1 | –1 |
1 | 1 |
Fig. 2a) Vibration mode under first-order natural frequency, b) vibration mode under second-order natural frequency, c) same direction vibration schematic diagram, d) reverse direction vibration schematic diagram
a)
b)
c)
d)
2.2. Dynamic model of rolling process
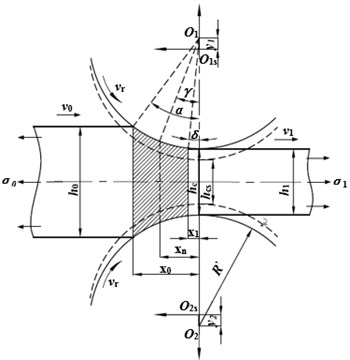
The geometry of the roll bite is illustrated in Fig. 3, where and are the original geometrical centers of the top and bottom rolls (before vibration begins). and are the ever-changing centers of the rolls. and are the strip thicknesses at the inlet and outlet. isthe roll gap spacing measured along the centerline , isthe roll gap spacing measured along the centerline . is the inlet angle, . is the neutral angle. is the outlet angle, . is the horizontal projection length of the contact arc, . and are the radiuses of the original work roll and deformed work roll. and are the strip tensile stresses at the inlet and outlet. and are the strip velocities at the inlet and outlet. is the roll peripheral velocity. , and are the inlet position, neutral position and outlet position measured from the centerline , . And it is assumed that the strip width at the inlet and outlet are .
Zeng et al. [4] assumed that the model is symmetrical, so it is only valid to study symmetrical vibration of the rolling mill. In this paper, the model is asymmetric and the vibration of upper and lower rolls is asymmetrical, so the equation in [4] is replaced with the Eq. (1):
The Hill simplified formula of Bland-Ford rolling force model is as follows [6]:
where, is the mean tensile stress, usually considered as . is the stress state factor, . is the reduction ratio, . is the mean deformation resistance, . and are the coefficients associated with the strip carbon content. is the mean total deformation extent, . is the total deformation extent at the inlet of this mill stand, . is the total deformation extent at the outlet of this mill stand, . is the initial strip thickness at the inlet of the first mill stand in a configuration. and are coefficients, usually considered as 0.4, 0.6.
According to the relationship in the rolling deformation zone, the rolling force acting on rolls in the vertical direction is given by:
The strip velocities at the inlet and outlet, the strip inlet position, outlet position and neutral position can be obtained based on the geometry of the roll bite, as well as on the metal flow equation and equilibrium conditions of the force in the deformation zone, as shown in Eq. (4):
From Eq. (2), (3) and (4), the rolling force acting on the rolls, the strip velocities at the inlet and outlet can be implicitly formulated as a function in terms of the following variables, i.e.:
Fig. 3Roll bite geometry during vibration
Since the chatter phenomenon in rolling is considered as a dynamic phenomenon rather than a static one, it is more important to study the variations of the system parameters rather than their steady-state values [3]. The variation of , and can be obtained by utilizing the first-order Taylor expansion [1, 3, 4]:
where, , .
, , , , , are the partial derivatives of with respect to , , , , , respectively. These coefficients characterize the impact factors of the variation of , , , , on the variation of , , , , , are the partial derivatives of with respect to , , , , , respectively. These coefficients characterize the impact factors of the variation of , , , , on the variation of . , , , , are the partial derivatives of with respect to , , , , , respectively. These coefficients characterize the impact factors of the variation of , , , , on the variation of .
All the calculations of coefficients in Eq. (6) are given in Appendix.
A change of the roll gap caused the fluctuation of the strip velocity, and then resulted in the fluctuation of the strip tensile stress. The tensile stress variation at the inlet and outlet can be expressed as:
where, is the Young’s modulus of the strip. and are distances from this stand to the upstream stand and downstream stand.
2.3. Mathematical model of rolling vibration
Equilibrium equation of vibration system can be written as:
As Eq. (7) has the integral terms of time, Eq. (7) is taken as a derivative with respect to time.
By combining the structure modal with dynamic model of rolling process, we can get the mathematical rolling chatter model:
In order to analyze the system stability, the Eq. (10) is written as the Eq. (11) which is the first-order algebraic equation combined with the Eq. (6) and Eq. (7), and using to substitute :
And the mathematical model of rolling vibration is expressed as a first-order differential equation in the matrix form:
where:
3. Model verification
The above established vibration model, which considers the structure asymmetry of the upper and lower rolls, is more in line with the actual situation. And it can be used to study the effect of asymmetric structure on the mill system stability. Due to the destruction of the chatter, it is difficult to conduct an experiment or test. In order to verify the model correctness, this paper uses structural parameters, process parameters and vibration test data of the 4th stand of a 2030 cold rolling mill.
The rolling process parameters, rolling speed in case of chatter occurrence, the result from the literature [6] and the results of this paper are listed in Table 3. As shown in Table 3, the simulation result obtained with the asymmetric model and described in this paper has a good consistency with the result from the literature [6] and the test chatter rolling speed. Therefore, the asymmetric vibration model established in this paper is correct and effective.
Table 3Comparisons of test data and simulation results
Chatter number | 1 | 2 | 3 | |
Inlet thickness / (mm) | 0.755 | 0.789 | 0.705 | |
Outlet thickness / (mm) | 0.568 | 0.577 | 0.506 | |
Strip width / (mm) | 1206 | 1206 | 1020 | |
Outlet tension / (MPa) | 197 | 189 | 185 | |
Inlet tension / (MPa) | 156 | 180 | 175 | |
Critical speed / (m/s) | Test | 20.33 | 19.83 | 21.67 |
Literature | 26 | 23.8 | 25.4 | |
Paper | 24.95 | 23.95 | 23.95 | |
4. Stability analysis and dynamic response
In this section, the influences of the structure asymmetry on the system stability under the conditions of constant natural stiffness are . And the constant of total mass is also analyzed, respectively. In order to facilitate the analysis, let us assume that , . Taking the structural parameters in Table 1, we can get the natural stiffness 3.45×10¹⁰N/m, total mass 406400 kg.
4.1. Mathematical model of the rolling vibration
4.1.1. Stability analysis under asymmetric stiffness
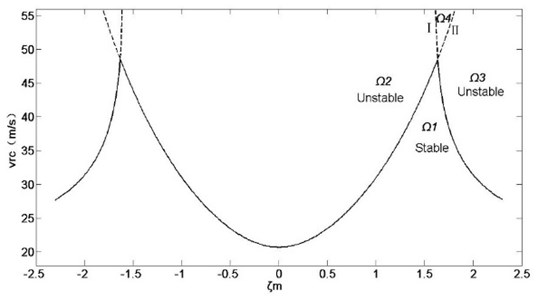
In this section, the influence of upper and lower stiffness ratio on the stability of rolling mill system is analyzed under the condition of constant natural stiffness. So, let us assume that , . The necessary and sufficient condition for a linear time-invariant system to be stable is that all the system eigenvalues or the roots of the characteristic equation possess a negative real part. As shown in Eq. (13), the characteristic matrix of the mathematical model is a six-order square, and the elements of the characteristic matrix are generally represented by complex mathematical relationships of rolling process parameters. Thus, it is difficult to achieve the eigenvalue of the system in a symbolic or analytical form. However, it is rather easy to calculate the eigenvalue with a numerical method. If all the eigenvalues have the negative real part, the system is stable, if not, the system is unstable. The result is illustrated in Fig. 4.
As shown in Fig. 4, the full line shows the critical speeds under different stiffness ratios. It is observed that the figure is symmetrical about 0, which means the system stability is the same when , so the paper has just analyzed the right half of the figure. It is observed that the system unstable critical line is spliced by Line I and Line II. For a further analysis of the system dynamics, two points (point A, point B) are taken on Line I and Line II randomly. The eigenvalue and instability type of the two points and their neighborhood are shown in Table 4.
Fig. 4Influence of stiffness ratio on system stability under constant natural stiffness
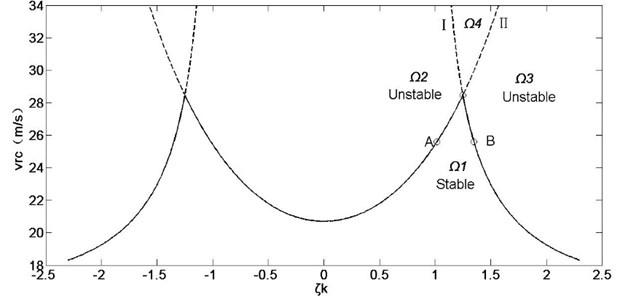
Table 4Eigenvalue and instability type of point A, point B and their neighborhood
/ (m/s) | (×102) | (×102) | (×102) | (×102) | Instability type | ||
25.61 | A– | 1.008 | 0.005±9.43i | –0.137±5.95i | –3.503 | –1.500 | Reverse direction instability |
A | 1.018 | 0.000±9.45i | –0.133±5.96i | –3.503 | –1.501 | Stable | |
A+ | 1.028 | –0.004±9.47i | –0.129±5.96i | –3.503 | –1.501 | Critical stability | |
B– | 1.337 | –0.136±10.23i | –0.004±6.00i | –3.490 | –1.499 | Stable | |
B | 1.347 | –0.140±10.26i | 0.000±6.00i | –3.490 | –1.499 | Critical stability | |
B+ | 1.357 | –0.144±10.29i | 0.004±6.00i | –3.489 | –1.499 | Same direction instability | |
As it can be seen from Table 4, at the rolling speed of 25.61 m/s, all the eigenvalue of the system has the negative real part when 1.018, what means the system is stable at the moment. When 1.018, a pair of pure imaginaries appears in the system, and this pair of conjugate eigenvalue represents the characteristic of the same direction modal defined in section 2.1, what means the system is in the critical state this time. However, when 1.018, the real parts of eigenvalue becomes positive, in other words, the same direction vibration modal loses its stability. Therefore, Line I is the critical boundary of the same direction vibration modal. Similarly, Line II is the critical boundary of the reverse direction vibration modal. Line I, Line II and coordinate axis form the region , where the system is stable. The system is unstable in other regions.
As it can be seen from the above analysis, when the stiffness difference in upper and lower parts is small, the stable domain in the system is determined by Line I. At the lower side of Line I the system is stable, and the system is unstable and vibrates in the reverse direction at the upper side of Line I. However, when the stiffness difference in upper and lower parts is large, the stable domain in the system is determined by Line II. At the lower side of the Line II, the system is stable, and the system is unstable and vibrates in the same direction at the upper side of Line II. There is an optimal stiffness distribution ratio at the intersection of two lines, namely 1.247, where the mill system is the most stable. In these three regions around the optimal stiffness ratio, the system vibration modal is different, and there is a modal conversion phenomenon there. On the left of the optimal stiffness ratio, the region , which is enclosed by Line I and Line II, is unstable and vibrates in the reverse direction. On the right of the optimal stiffness ratio, the region which is enclosed by Line I and Line II is unstable and vibrates in the same direction. Above the optimal stiffness ratio, the region , which is enclosed by Line I and Line II, is unstable with two modes.
4.1.2. Dynamic response at unstable points
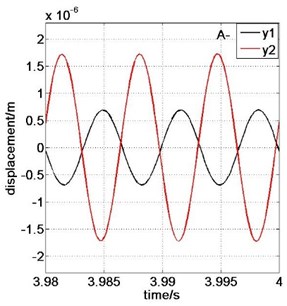
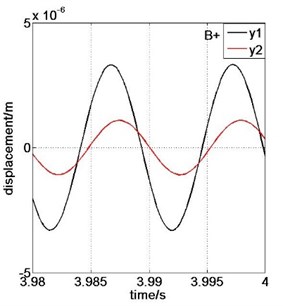
Moreover, in order to verify the correctness of the system stability analysis, the system motions corresponding to the unstable point A– and point B+ are numerically simulated. For an initial disturbance 10-6m, the simulation results are shown in Figs. 5-6. And the time domain from 3.98 s to 4 s is taken to compare the instability types of and in Fig 7.
Fig. 5Dynamic system response at A– for ζk= 1.008, vr= 25.61 m/s
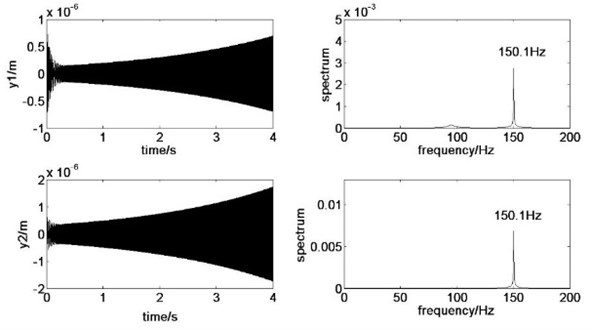
Fig. 6Dynamic system response at B+ for ζk= 1.357, vr= 25.61 m/s
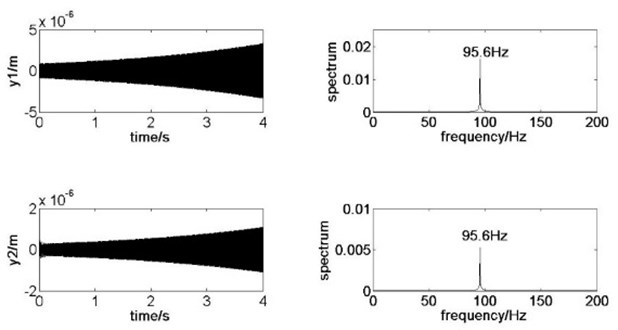
Fig. 7Displacement contrast for y1 and y2: a) A– point, b) B+ point
a)
b)
As shown in Fig. 5, the system is unstable and vibrates with the second-order natural frequency at the condition of 1.008, 25.61 m/s. As shown in Fig. 7, the upper rolls and lower rolls vibrate in the reverse direction. Therefore, the system is unstable with the reverse direction vibration modal. As shown in Fig. 6, the system is unstable with the first-order natural frequency at the condition of 1.357, 25.61 m/s. As shown in Fig. 7, the upper rolls and lower rolls vibrate in the same direction. Therefore, the system is unstable with the same direction vibration modal. The calculation results and analysis conclusions in section 4.1.1 were proved to be correct.
4.1.3. Influence of asymmetric stiffness on the rolling mill stability under different structural parameters
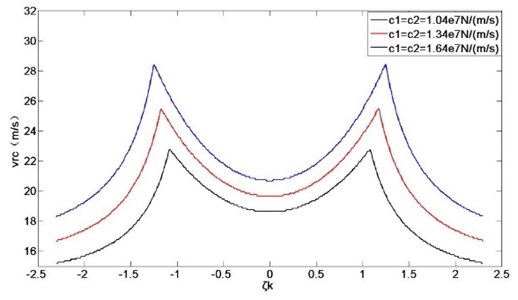
In order to analyze the effect of asymmetric stiffness on the rolling mill stability under different structural parameters, the system stability is studied under different natural stiffness value, mass value and damping value, respectively. The simulation results are shown in Fig. 8-10.
Fig. 8Influence of asymmetric stiffness on the rolling mill stability at different natural stiffness
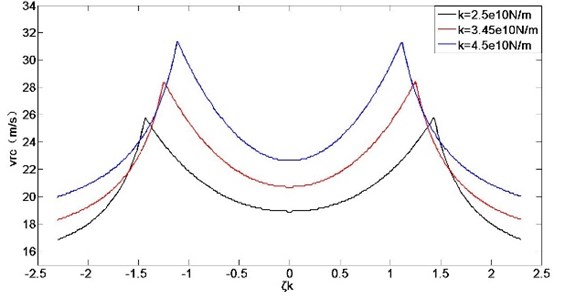
Fig. 9Influence of asymmetric stiffness on the rolling mill stability at different mass
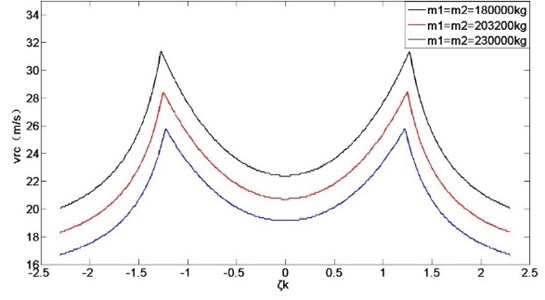
As shown in Figs. 8-10, with increasing of the natural stiffness and mass, the optimal stiffness ratio gets smaller. With the damping increase, the optimal stiffness ratio gets bigger. However, with the change of natural stiffness value, mass value and damping value, the influence rule of stiffness ratios on the mill system stability has not changed, it only changes the position of the optimal stiffness ratio. The stiffness ratio of the rolling mill can be adjusted appropriately under the premise of meeting the other design requirements to obtain the optimal stiffness ratio, which makes the rolling mill system more stable.
Fig. 10Influence of asymmetric stiffness on the rolling mill stability at different damping
4.2. Stability analysis and dynamic response under asymmetric mass
In this section, the influence of mass ratio on the stability of rolling mill system is analyzed under the condition of constant total mass, by assuming that , .
Fig. 11Influence of mass ratio on system stability under constant total mass
As shown in Fig. 11, the influence of asymmetric mass on the system stability is similar to the asymmetric stiffness. Specific analysis methods and procedures are described in section 4.1.1, so we do not repeat them here. The full line shows the critical speeds under different mass ratios. Line I, Line II and axis form the region , where the system is stable. The system is unstable in other regions. When the mass difference in upper and lower parts is small, the stable domain in the system is determined by Line I. At the lower side of Line I the system is stable, and the system is unstable and vibrates in the reverse direction at the upper side of Line I. However, when the mass difference in asymmetry upper and lower parts is large, the stable domain in the system is determined by Line II. At the lower side of Line II the system is stable, and the system is unstable and vibrates in the same direction at the upper side of Line II. There is an optimal mass distribution ratio at the intersection of two lines, namely 1.627, where the mill system is the most stable. In three regions around the optimal mass ratio, the system vibration modal is different, and there is a modal conversion phenomenon. On the left of the optimal mass ratio, the region , which is enclosed by Line I and Line II, is unstable and vibrates in the reverse direction. On the right side of the optimal mass ratio, the region , which is enclosed by Line I and Line II, is unstable and vibrates in the same direction. Above the optimal mass ratio, the region , which is enclosed by Line I and Line II, is unstable in two modes.
Under the condition of structural parameters changing, the effect of asymmetric mass on the rolling mill stability is in line with the effect of asymmetric stiffness on the rolling mill stability. With the change of stiffness value, total mass value and damping value, the influence rule of mass ratios on the mill system stability has not changed. It only changes the position of the optimal mass ratio. The mass ratio of the rolling mill can be adjusted appropriately under the premise of meeting other design requirements to obtain the optimal mass ratio, which makes the rolling mill system more stable.
The results verify that asymmetric structure parameters have a significant impact on the system stability and critical conditions. And the study of the influence of asymmetric structure parameters on the rolling mill stability will help us to study the vibration modes of the rolling mill more comprehensive. It is necessary to consider the asymmetry of mill structure, and it can provide a guidance for dynamic system structure modifications and mill optimization design.
5. Conclusions
This paper described a constructed rolling mill dynamic model by coupling the structure mode which considered the structure asymmetry, and the rolling process model which considered the asymmetric vibration. The following conclusions are obtained:
1) The asymmetric vibration model established in this paper has the correctness and effectiveness by comparing test data and reference simulation results with the simulation results of this paper.
2) Asymmetric structure parameters have a significant impact on the system stability and critical speed. The mill system obtains the highest critical rolling speed that can ensure the best stability at the optimal stiffness ratio and optimal mass ratio. With the change of structure parameter values, the influence rule of stiffness ratios and mass ratios on the mill system stability does not change, it only changes the position of the optimal ratio.
3) With the degree of asymmetry in stiffness and mass increase, the phenomenon of modal conversion occurs. When the stiffness ratio and mass ratio are smaller than the optimal ratio, the upper rolls and lower rolls vibrate in the reverse direction with the second-order natural frequency in the unstable domain. When the stiffness ratio and mass ratio are larger than the optimal ratio, the upper rolls and lower rolls vibrate in the same direction with the first-order natural frequency in the unstable domain.
References
-
Zhao H., Ehmann K. F. Stability analysis of chatter in tandem rolling mills-part 1: single- and multi-stand negative damping effect. Journal of Manufacturing Science and Engineering, Vol. 135, Issue 3, 2013, p. 031001.
-
Yun I. S., Wilson W. R. D., Ehmann K. F. Chatter in the strip rolling process, part 1: dynamic model of rolling. Journal of Manufacturing Science and Engineering, Vol. 120, Issue 2, 1998, p. 330-336.
-
Hu P. H., Ehmann K. F. A dynamic model of the rolling process. Part I: homogeneous model. International Journal of Machine Tools and Manufacture, Vol. 40, Issue 1, 2000, p. 1-19.
-
Zeng L., Zang Y., Gao Z., et al. Stability analysis of the rolling mill multiple-modal-coupling vibration under nonlinear friction. Journal of Vibroengineering, Vol. 17, Issue 6, 2015, p. 2824-2836.
-
Gao Z. Y., Zang Y., Zeng L. Q. Review of chatter in the rolling mills. Journal of Mechanical Engineering, Vol. 51, Issue 16, 2015, p. 87-105.
-
Zou J. X., Xu L. J. Vibration Control of Cold Tandem Mill System. Metallurgical Industry Press, Beijing, 1998.
-
Hou D. X., Peng R. R., Liu H. R. Vertical-horizontal coupling vibration characteristics of strip mill rolls under the variable friction. Journal of Northeastern University (Nature Science), Vol. 34, Issue 11, 2013, p. 1616-1619.
-
Kim Y. S., Zhang N., Ji J. C., et al. The effect of rolling speed and friction on cold rolling mill stability. International Mechanical Engineering Congress and Exposition, American Society of Mechanical Engineers, 2012, p. 291-299.
-
Hwang Y. M., Tzou G. Y. Analytical and experimental study on asymmetrical sheet rolling. International Journal of Mechanical Sciences, Vol. 39, Issue 3, 1997, p. 289-303.
-
Gao H., Ramalingam S. C., Barber G. C., et al. Analysis of asymmetrical cold rolling with varying coefficients of friction. Journal of Materials Processing Technology, Vol. 124, Issue 1, 2002, p. 178-182.
-
Salimi M., Kadkhodaei M. Slab analysis of asymmetrical sheet rolling. Journal of Materials Processing Technology, Vol. 150, Issue 3, 2004, p. 215-222.
-
Zhang S. H., Zhao D. W., Gao C. R., et al. Analysis of asymmetrical sheet rolling by slab method. International Journal of Mechanical Sciences, Vol. 65, Issue 1, 2012, p. 168-176.
-
Zang Y., Sun H. Investigation on parameters in asymmetrical rolling process. Journal of University of Science and Technology Beijing, Vol. 2, 1994.
-
Świa̧toniowski A., Thomson P. F. Theoretical study of the dynamic effect on the warping of rolled strip and loss of flatness. Journal of Materials Processing Technology, Vol. 61, Issue 4, 1996, p. 373-381.
-
Jafari A. A. Asymmetrical Rolling and Self-Excited Vibration in a Hot Roughing Mill. University of Wollongong, Australia, 1994.
Cited by
About this article

This study is supported by the National Natural Science Foundation of China (No. 51175035), the Ph.D. Programs Foundation of Ministry of Education of China (No. 20100006110024).
